| Param | Original file | Final file |
|---|---|---|
| Filename | modeM0/AS1A10_123T06_9000004122_28724cztM0_level2.evt | modeM0/AS1A10_123T06_9000004122_28724cztM0_level2_quad_clean.evt |
| Size (bytes) | 653,371,200 | 98,726,400 |
| Size | 623.1 MB | 94.2 MB |
| Events in quadrant A | 3,770,588 | 626,415 |
| Events in quadrant B | 3,899,018 | 629,609 |
| Events in quadrant C | 5,581,549 | 598,969 |
| Events in quadrant D | 6,007,667 | 591,911 |
| Mode M9 | |||
|---|---|---|---|
| Quadrant | BADHDUFLAG | Total packets | Discarded packets |
| A | 0 | 5 | 0 |
| B | 0 | 5 | 0 |
| C | 0 | 5 | 0 |
| D | 0 | 5 | 0 |
| Mode M0 | |||
|---|---|---|---|
| Quadrant | BADHDUFLAG | Total packets | Discarded packets |
| A | 0 | 16312 | 2 |
| B | 0 | 16690 | 2 |
| C | 0 | 21888 | 2 |
| D | 0 | 23234 | 2 |
| Mode SS | |||
|---|---|---|---|
| Quadrant | BADHDUFLAG | Total packets | Discarded packets |
| A | 0 | 158 | 0 |
| B | 0 | 158 | 0 |
| C | 0 | 158 | 0 |
| D | 0 | 158 | 0 |
| Quadrant | Total seconds | Saturated seconds | Saturation percentage |
|---|---|---|---|
| A | 7813 | 161 | 2.060668% |
| B | 7813 | 234 | 2.995008% |
| C | 7813 | 528 | 6.757967% |
| D | 7813 | 449 | 5.746832% |
Noise dominated data is calculated using 1-second bins in cleaned event files. If a bin has >2000 counts, and if more than 50% of those come from <1% of pixels, then it is considered to be noise-dominated and hence unusable.
| Quadrant | # 1 sec bins | Bins with >0 counts | Bins with >2000 counts | High rate bins dominated by noise | Noise dominated (total time) | Noise dominated (detector-on time) | Marked lightcurve |
|---|---|---|---|---|---|---|---|
| A | 8278 | 7815 | 2 | 2 | 0.02% | 0.03% | 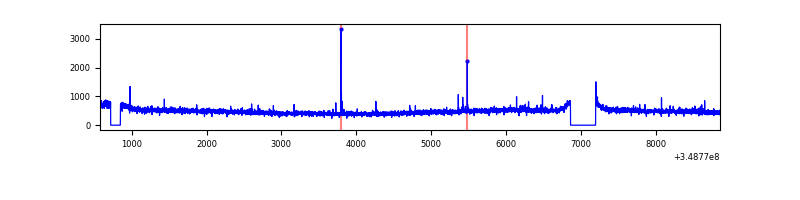 |
| B | 8278 | 7813 | 27 | 27 | 0.33% | 0.35% | 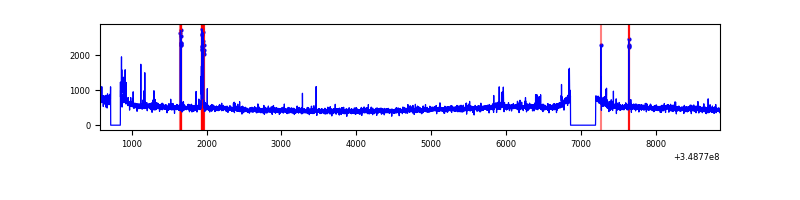 |
| C | 8278 | 7813 | 31 | 31 | 0.37% | 0.40% | 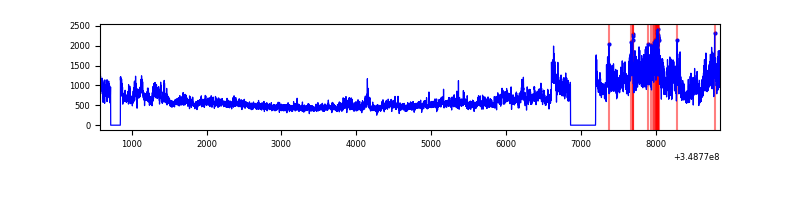 |
| D | 8278 | 7813 | 286 | 286 | 3.45% | 3.66% | 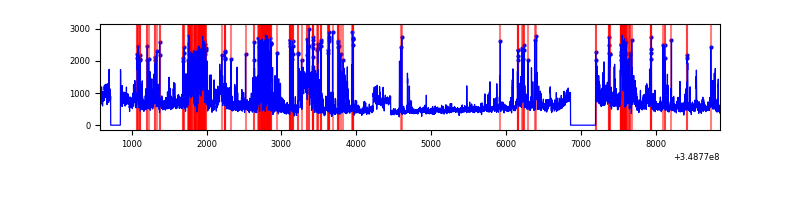 |
Top three noisy pixels from each quadrant. If the there are fewer than three noisy pixels in the level2.evt file, extra rows are filled as -1
| Pixel properties | Quadrant properties | ||||||
|---|---|---|---|---|---|---|---|
| Quadrant | DetID | PixID | Counts | Sigma | Mean | Median | Sigma |
| A | 14 | 239 | 33572 | 166.78 | 965 | 943 | 195.6 |
| A | 13 | 254 | 14407 | 68.82 | 965 | 943 | 195.6 |
| A | 3 | 137 | 9497 | 43.72 | 965 | 943 | 195.6 |
| B | 5 | 172 | 77396 | 418.35 | 951 | 924 | 182.8 |
| B | 0 | 229 | 35428 | 188.76 | 951 | 924 | 182.8 |
| B | 12 | 111 | 22203 | 116.41 | 951 | 924 | 182.8 |
| C | 3 | 233 | 1862648 | 8676.93 | 913 | 914 | 214.6 |
| C | 14 | 238 | 147515 | 683.26 | 913 | 914 | 214.6 |
| C | 4 | 224 | 9620 | 40.58 | 913 | 914 | 214.6 |
| D | 1 | 52 | 1211997 | 5422.47 | 927 | 902 | 223.3 |
| D | 8 | 195 | 724272 | 3238.77 | 927 | 902 | 223.3 |
| D | 12 | 233 | 381805 | 1705.43 | 927 | 902 | 223.3 |
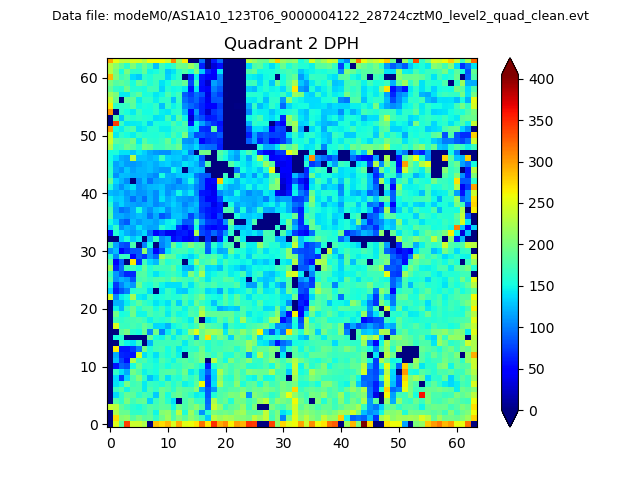
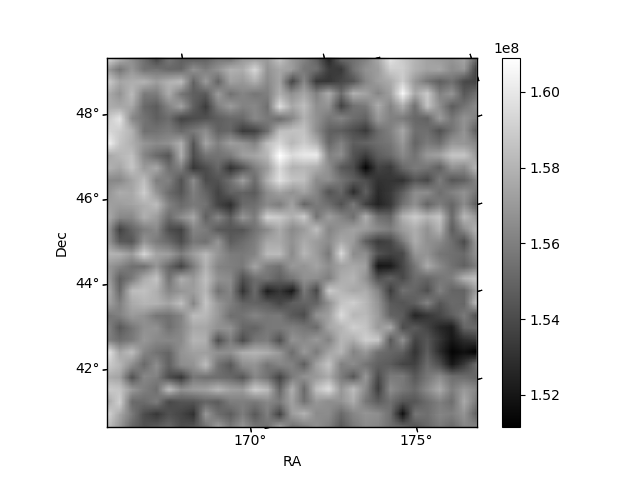
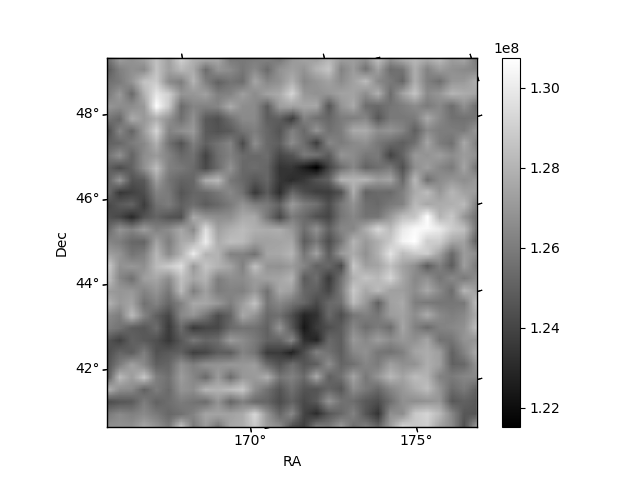
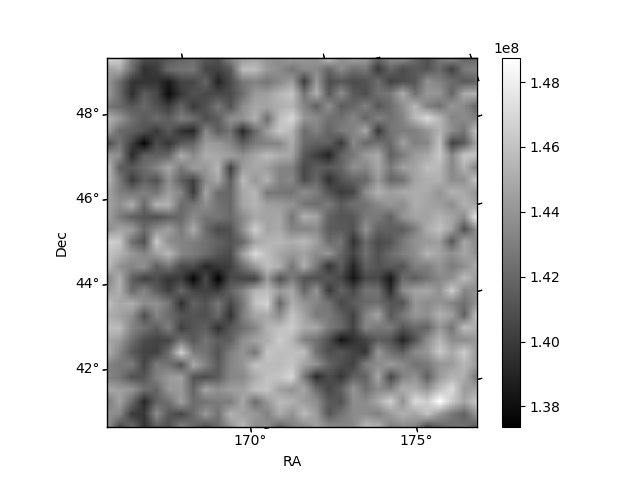
Histogram calculated using DETX and DETY for each event in the final _common_clean file
| Quadrant A | 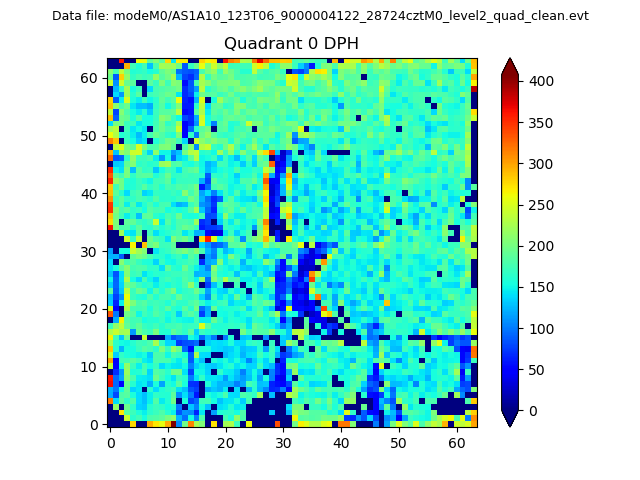 |
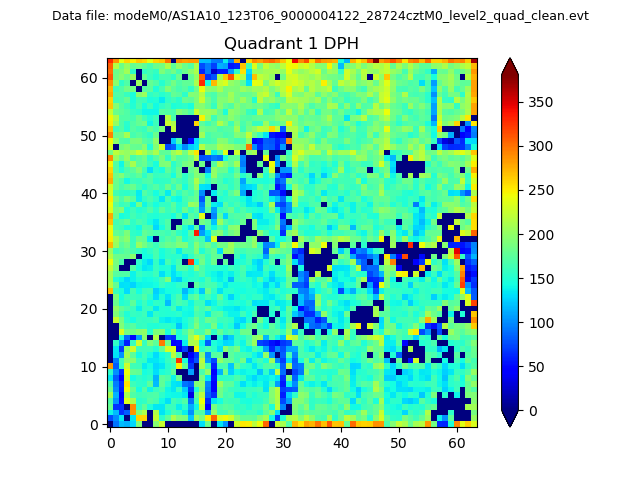 |
Quadrant B |
|---|---|---|---|
| Quadrant D | 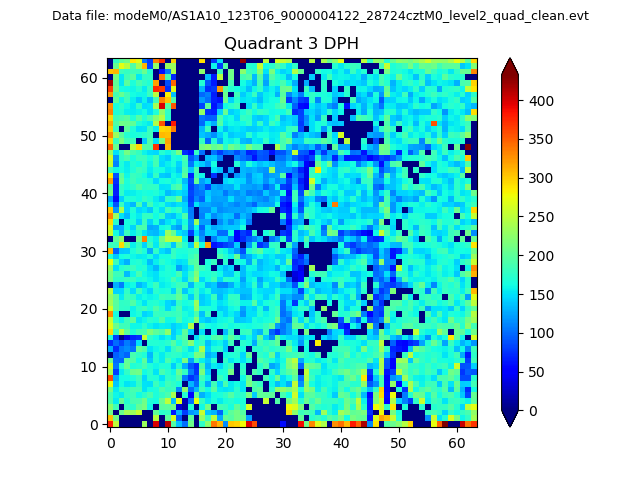 |
 |
Quadrant C |
| Plot type | Count rate plots | Images |
|---|---|---|
| Comparison with Poisson distribution Blue bars denote a histogram of data divided into 1 sec bins. Red curve is a Poisson curve with rate = median count rate of data. |
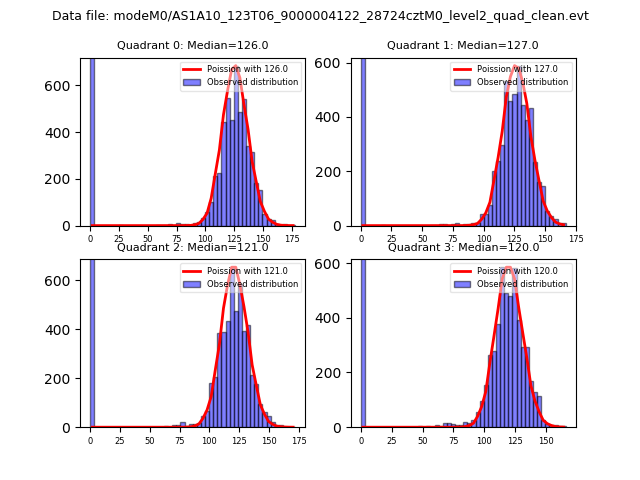 |
 |
| Quadrant-wise count rates Data is divided into 100 sec bins |
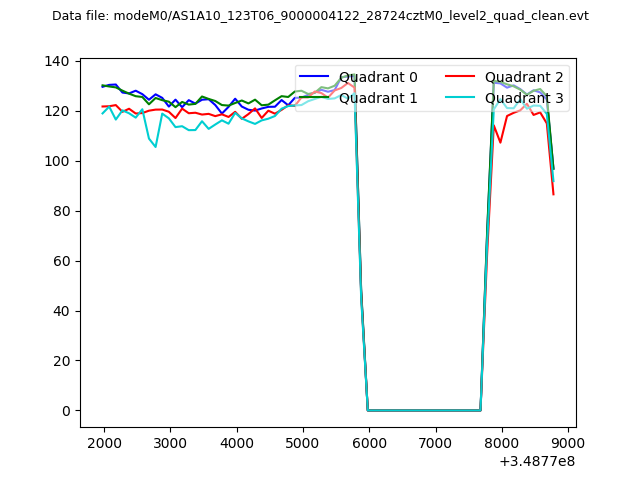 |
|
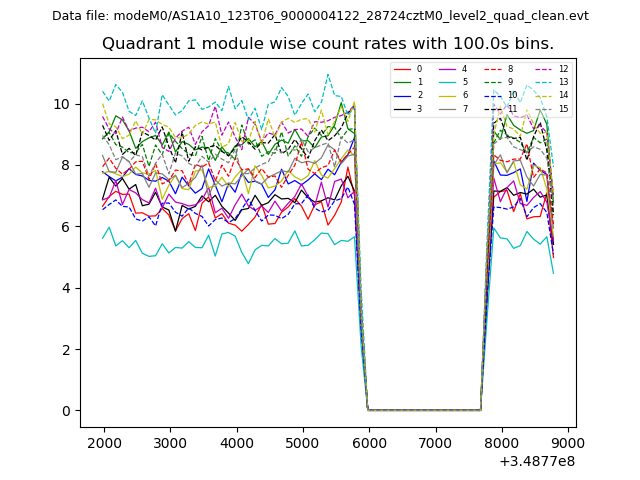
| Module-wise count rates for Quadrant A Data is divided into 100 sec bins |
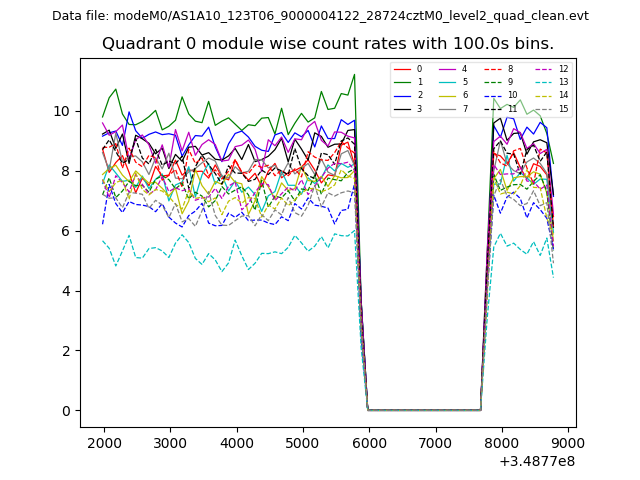 |
 |
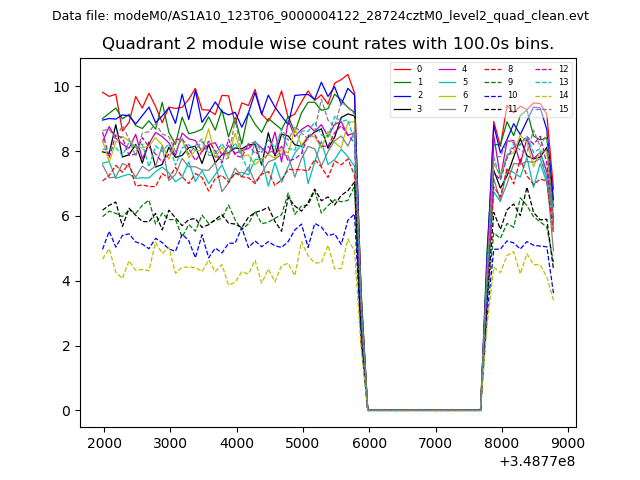
| Module-wise count rates for Quadrant B Data is divided into 100 sec bins |
 |
 |
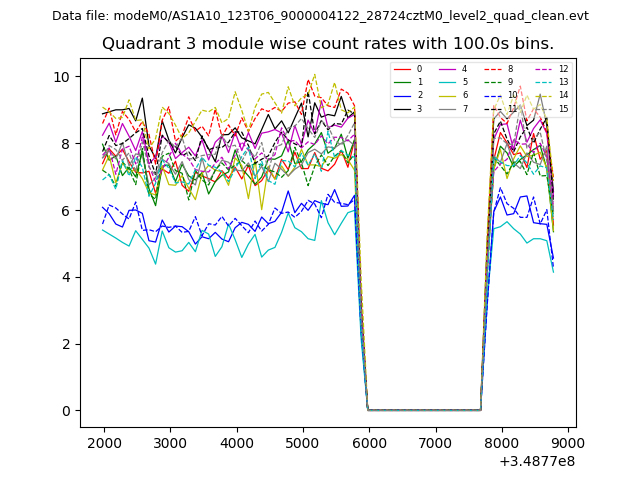
| Module-wise count rates for Quadrant C Data is divided into 100 sec bins |
 |
 |
| Module-wise count rates for Quadrant D Data is divided into 100 sec bins |
 |
 |
| Parameter | Plot |
|---|---|
| CZT HV Monitor | 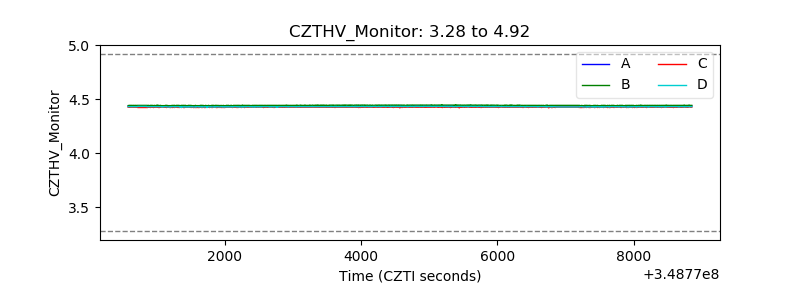 |
| D_VDD |  |
| Temperature 1 | 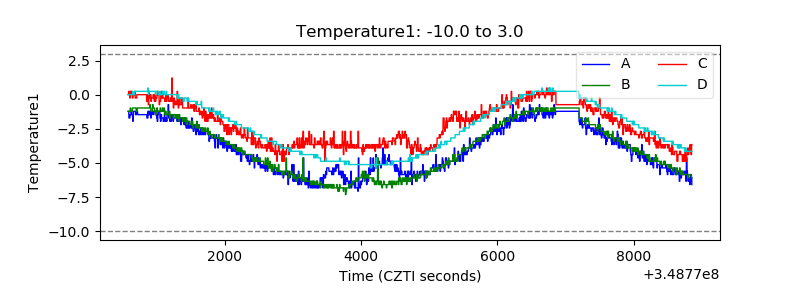 |
| Veto HV Monitor | 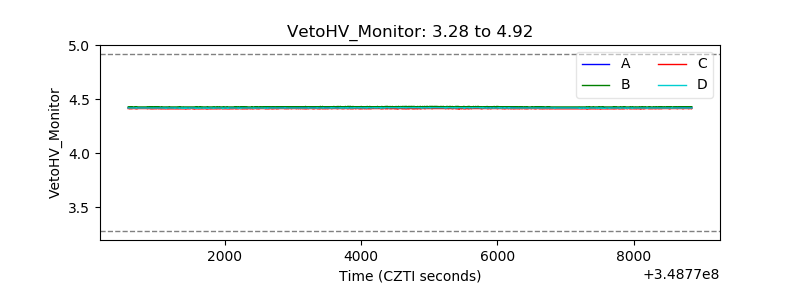 |
| Veto LLD | 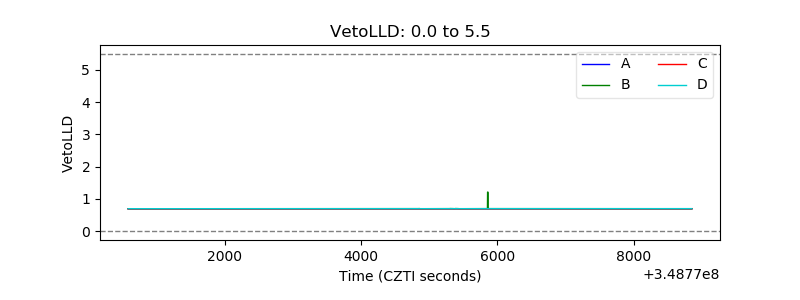 |
| Alpha Counter | 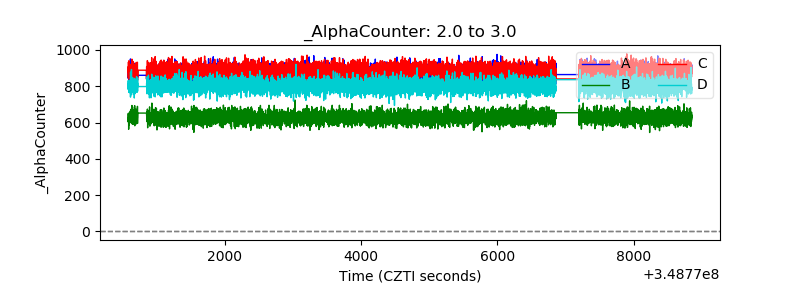 |
| _CPM_Rate | 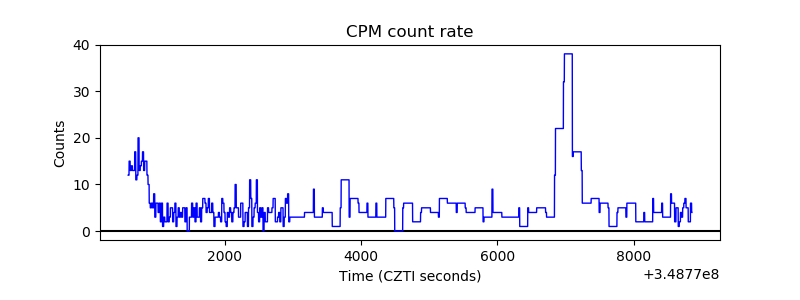 |
| CZT Counter | 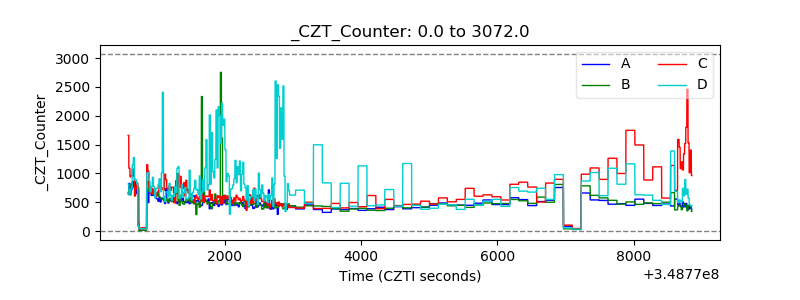 |
| +2.5 Volts monitor |  |
| +5 Volts monitor |  |
| _ROLL_ROT | 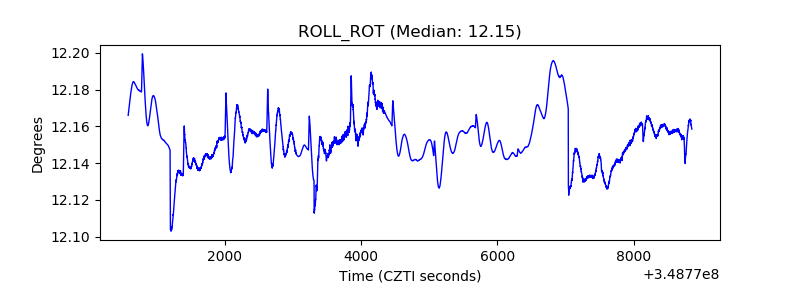 |
| _Roll_DEC | 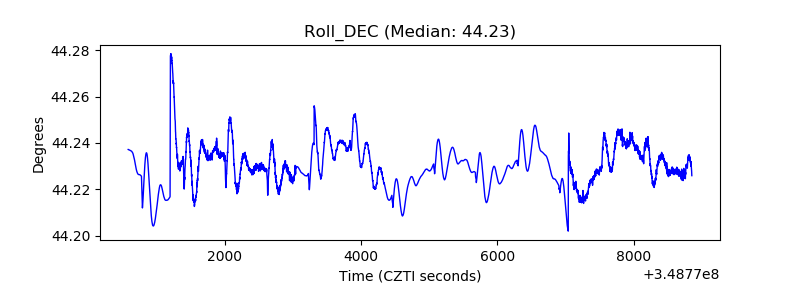 |
| _Roll_RA |  |
| Veto Counter | 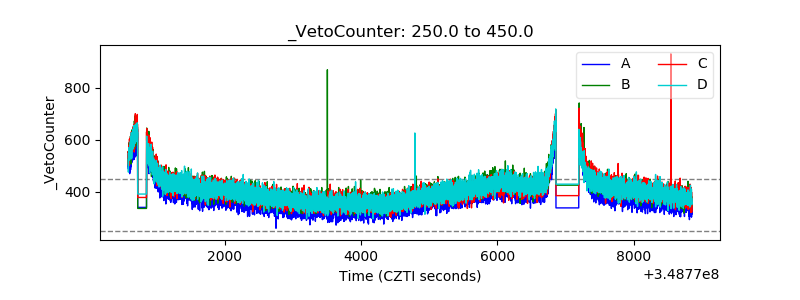 |