| Param | Original file | Final file |
|---|---|---|
| Filename | modeM0/AS1A10_123T06_9000004122_28727cztM0_level2.evt | modeM0/AS1A10_123T06_9000004122_28727cztM0_level2_quad_clean.evt |
| Size (bytes) | 241,182,720 | 36,302,400 |
| Size | 230.0 MB | 34.6 MB |
| Events in quadrant A | 1,161,757 | 241,070 |
| Events in quadrant B | 1,166,372 | 243,521 |
| Events in quadrant C | 3,206,234 | 213,535 |
| Events in quadrant D | 1,606,359 | 229,242 |
| Mode M9 | |||
|---|---|---|---|
| Quadrant | BADHDUFLAG | Total packets | Discarded packets |
| A | 0 | 5 | 0 |
| B | 0 | 5 | 0 |
| C | 0 | 5 | 0 |
| D | 0 | 5 | 0 |
| Mode M0 | |||
|---|---|---|---|
| Quadrant | BADHDUFLAG | Total packets | Discarded packets |
| A | 0 | 5047 | 1 |
| B | 0 | 4991 | 1 |
| C | 0 | 11217 | 1 |
| D | 0 | 6423 | 1 |
| Mode SS | |||
|---|---|---|---|
| Quadrant | BADHDUFLAG | Total packets | Discarded packets |
| A | 0 | 50 | 0 |
| B | 0 | 50 | 0 |
| C | 0 | 50 | 0 |
| D | 0 | 50 | 0 |
| Quadrant | Total seconds | Saturated seconds | Saturation percentage |
|---|---|---|---|
| A | 2378 | 21 | 0.883095% |
| B | 2378 | 38 | 1.597981% |
| C | 2378 | 706 | 29.688814% |
| D | 2378 | 116 | 4.878049% |
Noise dominated data is calculated using 1-second bins in cleaned event files. If a bin has >2000 counts, and if more than 50% of those come from <1% of pixels, then it is considered to be noise-dominated and hence unusable.
| Quadrant | # 1 sec bins | Bins with >0 counts | Bins with >2000 counts | High rate bins dominated by noise | Noise dominated (total time) | Noise dominated (detector-on time) | Marked lightcurve |
|---|---|---|---|---|---|---|---|
| A | 2913 | 2378 | 0 | 0 | 0.00% | 0.00% | 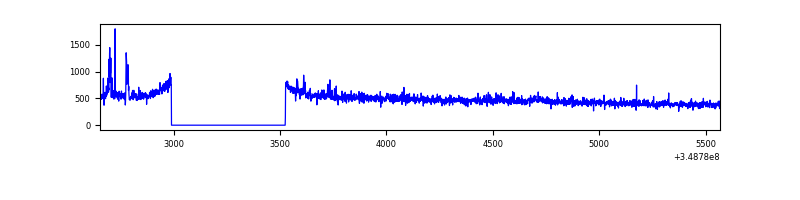 |
| B | 2913 | 2378 | 0 | 0 | 0.00% | 0.00% | 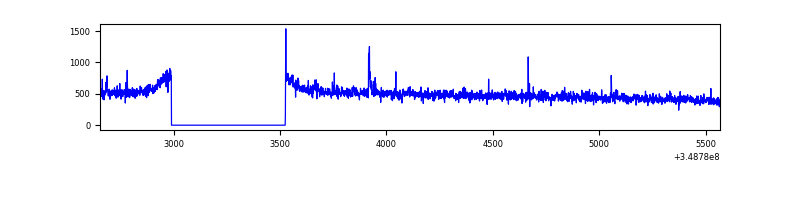 |
| C | 2913 | 2378 | 185 | 185 | 6.35% | 7.78% | 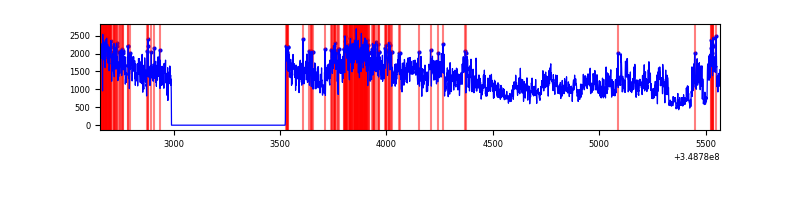 |
| D | 2913 | 2378 | 81 | 81 | 2.78% | 3.41% | 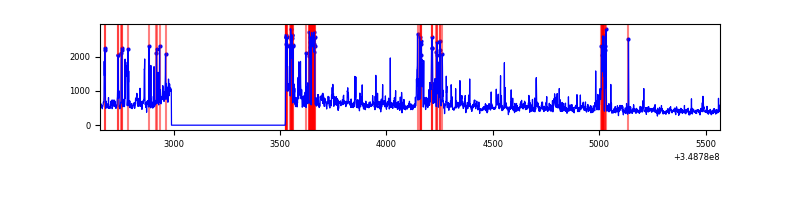 |
Top three noisy pixels from each quadrant. If the there are fewer than three noisy pixels in the level2.evt file, extra rows are filled as -1
| Pixel properties | Quadrant properties | ||||||
|---|---|---|---|---|---|---|---|
| Quadrant | DetID | PixID | Counts | Sigma | Mean | Median | Sigma |
| A | 15 | 174 | 23003 | 373.29 | 291 | 284 | 60.9 |
| A | 7 | 192 | 11067 | 177.17 | 291 | 284 | 60.9 |
| A | 13 | 254 | 4212 | 64.54 | 291 | 284 | 60.9 |
| B | 15 | 32 | 7037 | 115.49 | 293 | 284 | 58.5 |
| B | 12 | 111 | 6901 | 113.16 | 293 | 284 | 58.5 |
| B | 11 | 111 | 6083 | 99.18 | 293 | 284 | 58.5 |
| C | 3 | 233 | 2092228 | 32666.28 | 264 | 265 | 64.0 |
| C | 14 | 238 | 58745 | 913.17 | 264 | 265 | 64.0 |
| C | 14 | 254 | 24923 | 385.04 | 264 | 265 | 64.0 |
| D | 1 | 52 | 236817 | 3407.16 | 280 | 271 | 69.4 |
| D | 8 | 195 | 164981 | 2372.45 | 280 | 271 | 69.4 |
| D | 12 | 233 | 118275 | 1699.71 | 280 | 271 | 69.4 |
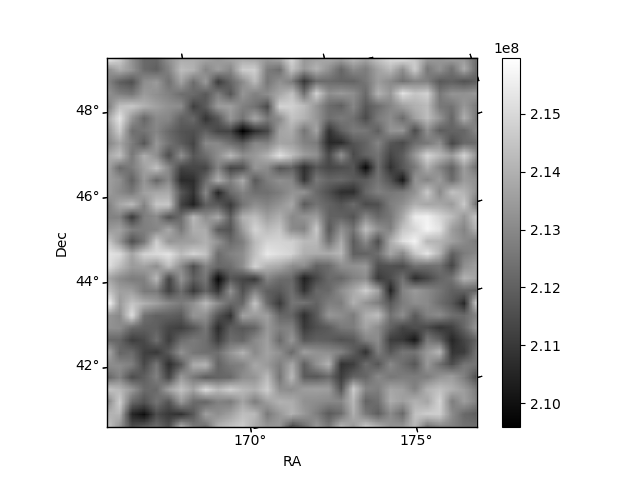
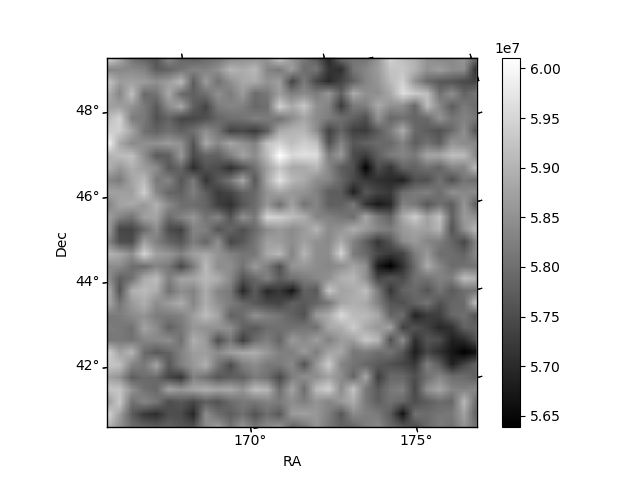
Histogram calculated using DETX and DETY for each event in the final _common_clean file
| Quadrant A | 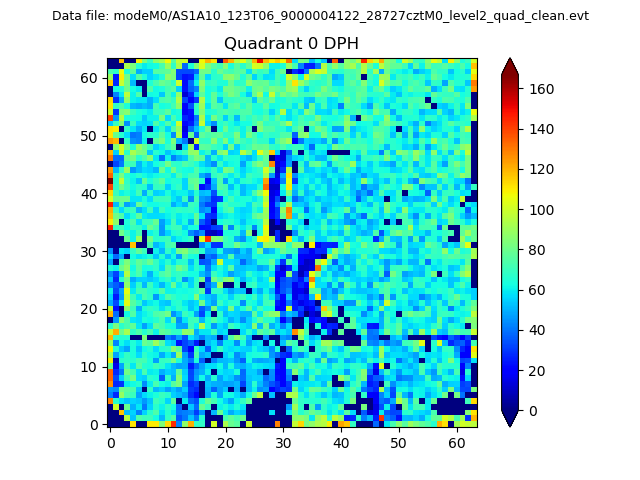 |
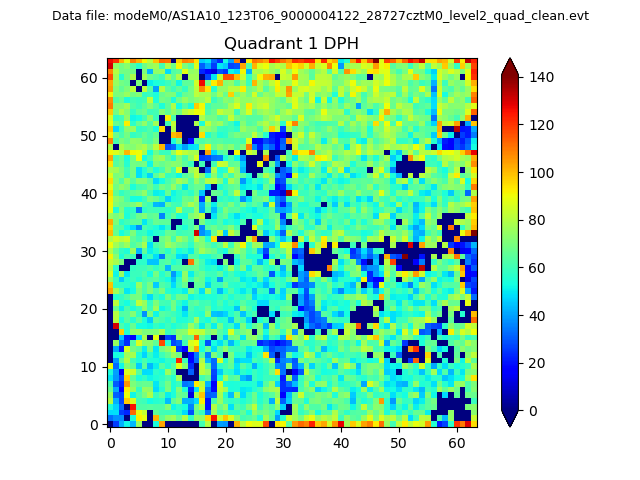 |
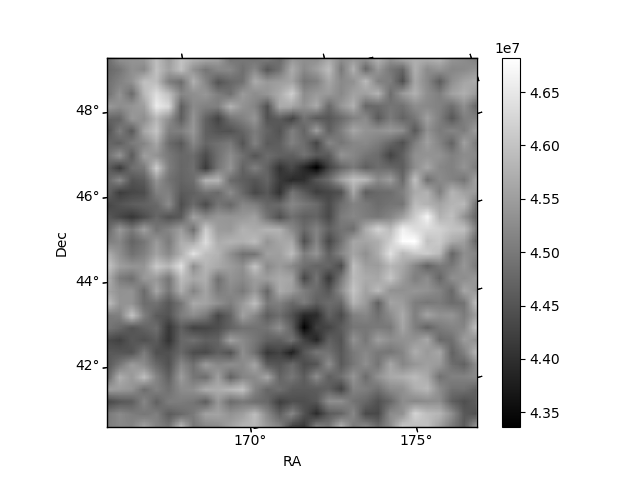
Quadrant B |
|---|---|---|---|
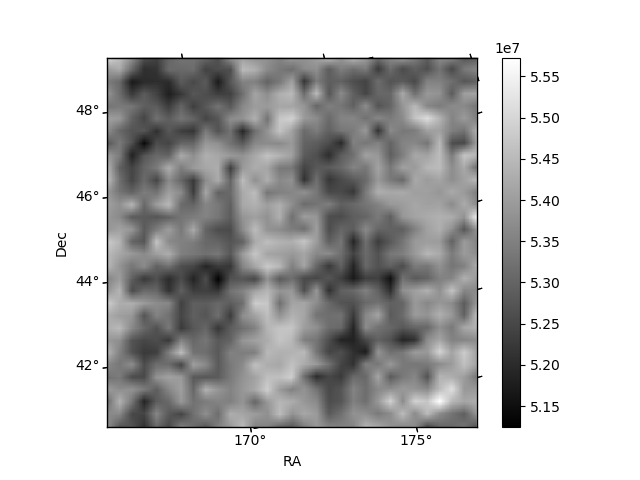
| Quadrant D | 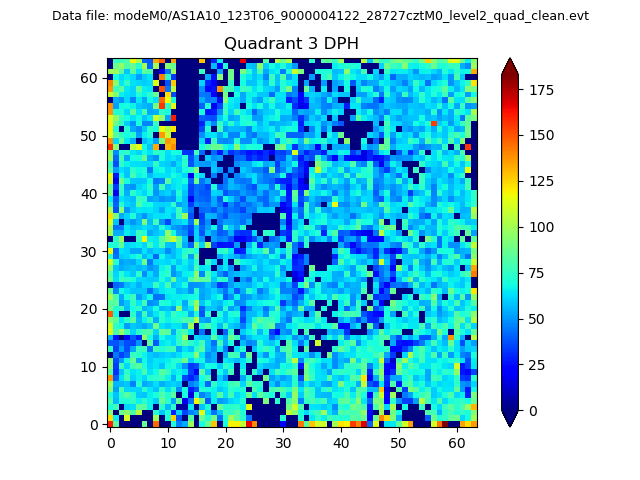 |
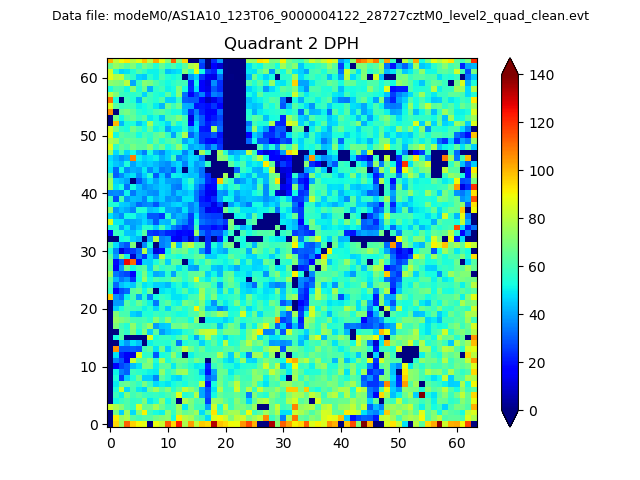 |
Quadrant C |
| Plot type | Count rate plots | Images |
|---|---|---|
| Comparison with Poisson distribution Blue bars denote a histogram of data divided into 1 sec bins. Red curve is a Poisson curve with rate = median count rate of data. |
 |
 |
| Quadrant-wise count rates Data is divided into 100 sec bins |
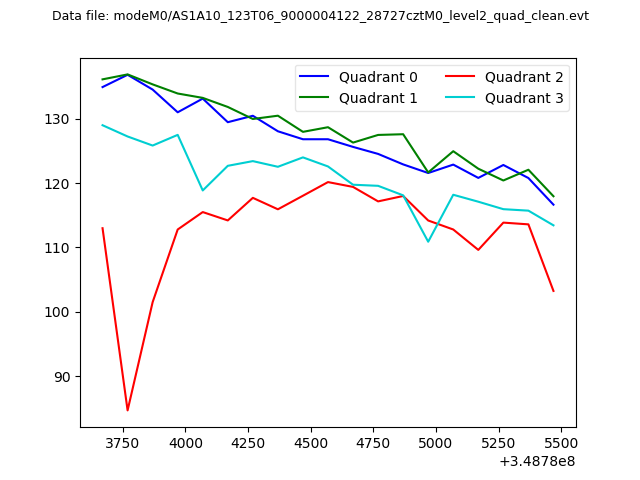 |
|
| Module-wise count rates for Quadrant A Data is divided into 100 sec bins |
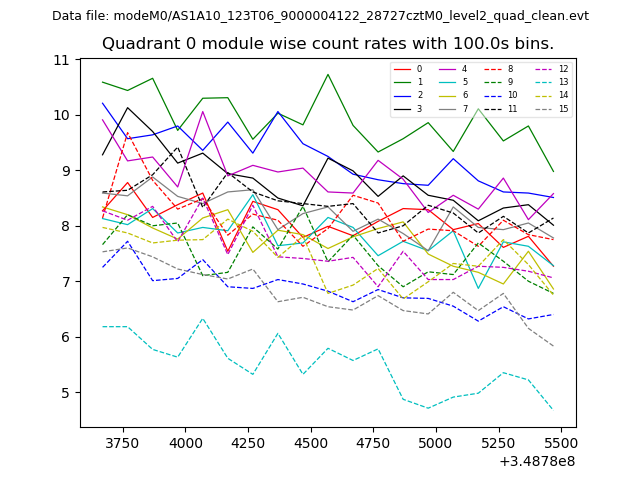 |
 |
| Module-wise count rates for Quadrant B Data is divided into 100 sec bins |
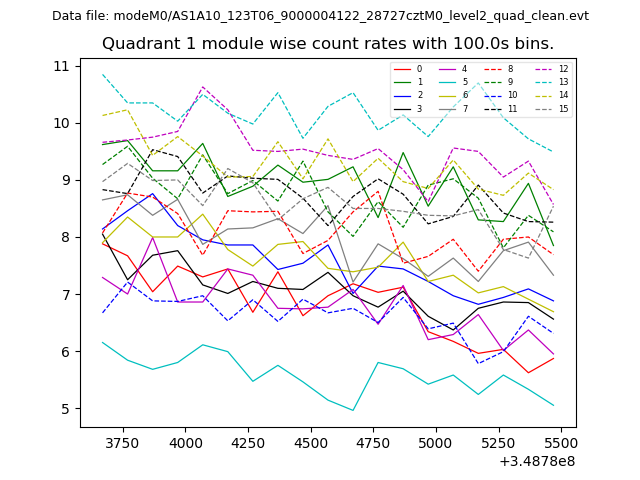 |
 |
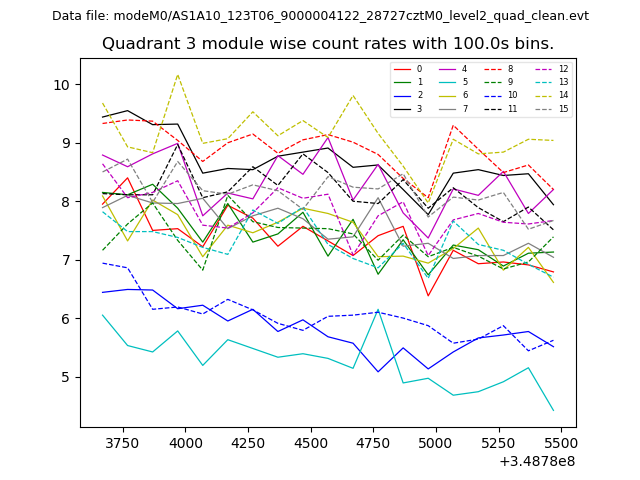
| Module-wise count rates for Quadrant C Data is divided into 100 sec bins |
 |
 |
| Module-wise count rates for Quadrant D Data is divided into 100 sec bins |
 |
 |
| Parameter | Plot |
|---|---|
| CZT HV Monitor | 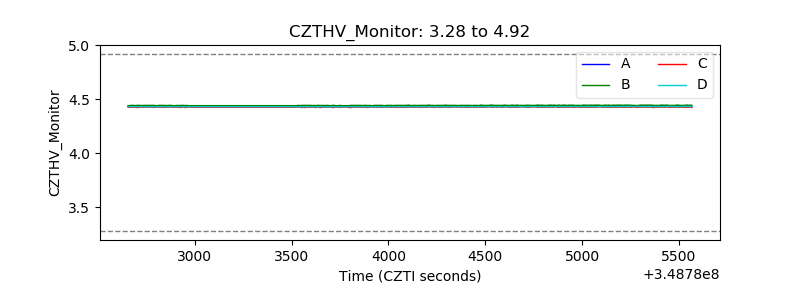 |
| D_VDD | 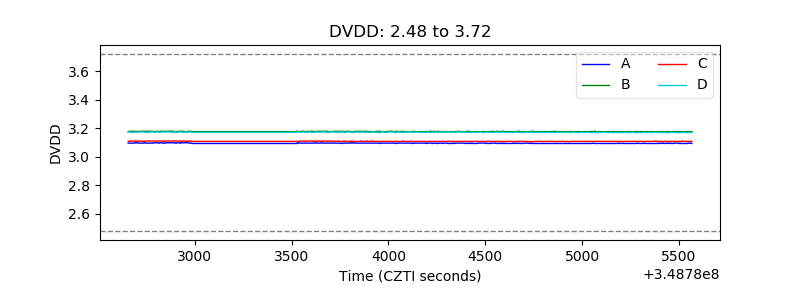 |
| Temperature 1 | 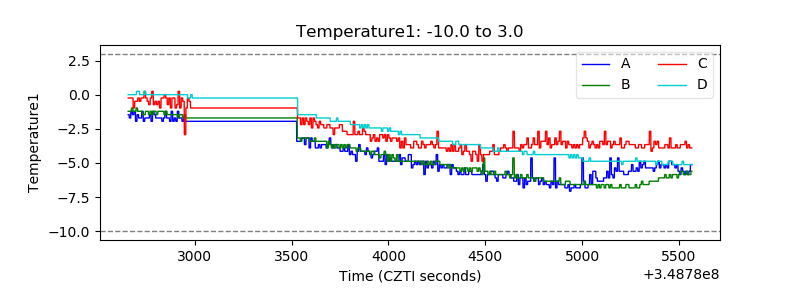 |
| Veto HV Monitor | 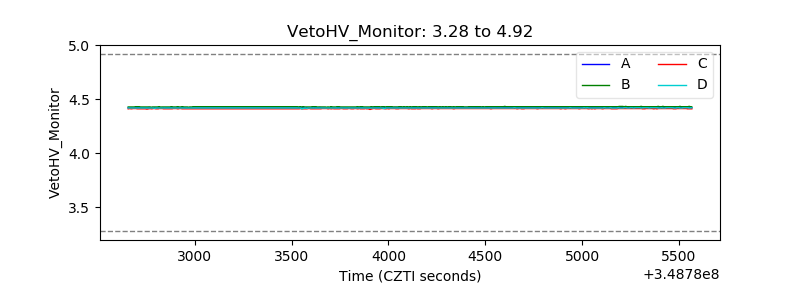 |
| Veto LLD | 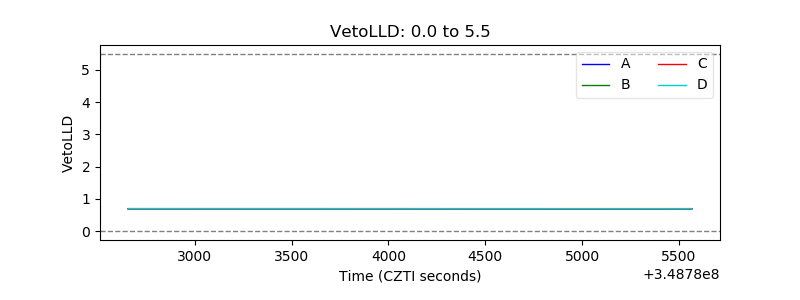 |
| Alpha Counter | 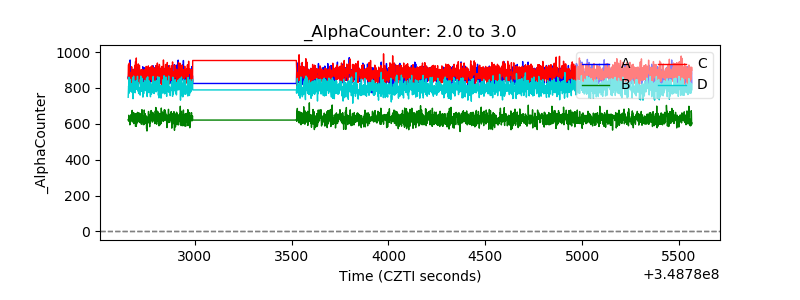 |
| _CPM_Rate | 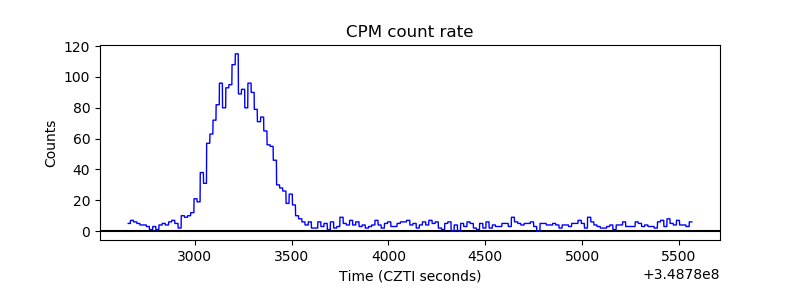 |
| CZT Counter | 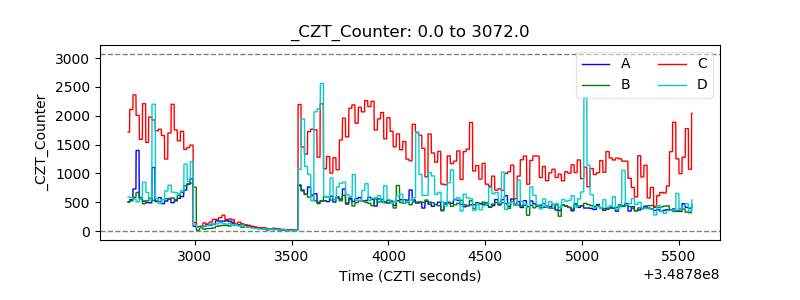 |
| +2.5 Volts monitor |  |
| +5 Volts monitor |  |
| _ROLL_ROT | 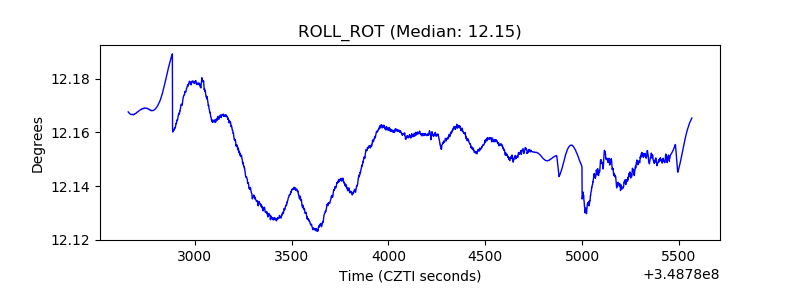 |
| _Roll_DEC | 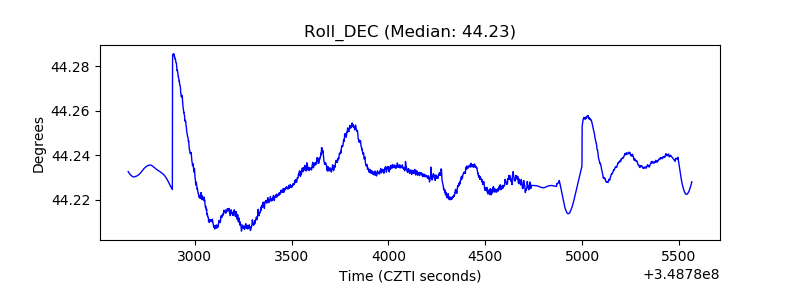 |
| _Roll_RA | 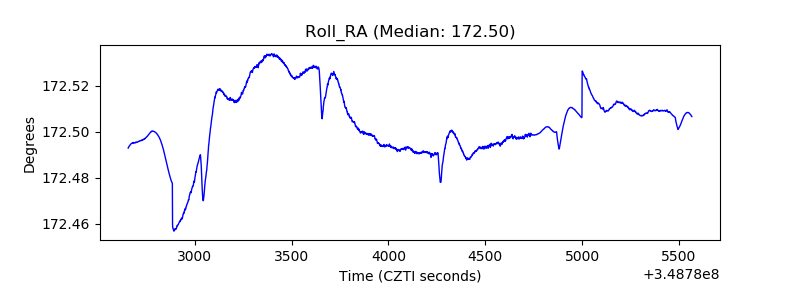 |
| Veto Counter | 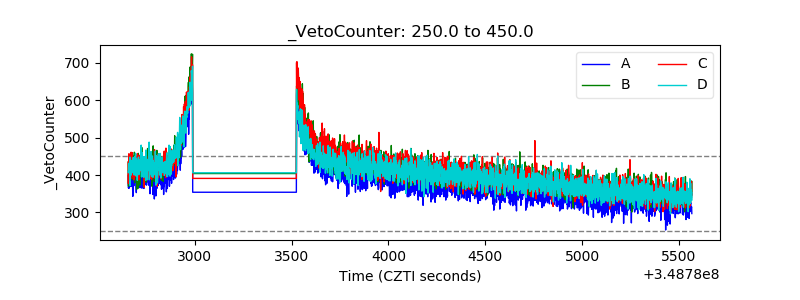 |