| Param | Original file | Final file |
|---|---|---|
| Filename | modeM0/AS1A10_123T07_9000004124cztM0_level2.fits | modeM0/AS1A10_123T07_9000004124cztM0_level2_quad_clean.evt |
| Size (bytes) | 639,273,600 | 461,093,760 |
| Size | 609.7 MB | 439.7 MB |
| Events in quadrant A | 3,962,682 | 2,518,463 |
| Events in quadrant B | 3,814,150 | 2,540,067 |
| Events in quadrant C | 3,876,778 | 2,434,113 |
| Events in quadrant D | 3,320,150 | 2,086,149 |
| Mode M9 | |||
|---|---|---|---|
| Quadrant | BADHDUFLAG | Total packets | Discarded packets |
| A | 0 | 107 | 0 |
| B | 0 | 107 | 0 |
| C | 0 | 107 | 0 |
| D | 0 | 107 | 0 |
| Mode M0 | |||
|---|---|---|---|
| Quadrant | BADHDUFLAG | Total packets | Discarded packets |
| A | 0 | 158512 | 0 |
| B | 0 | 146119 | 0 |
| C | 0 | 146142 | 0 |
| D | 0 | 210318 | 0 |
| Mode SS | |||
|---|---|---|---|
| Quadrant | BADHDUFLAG | Total packets | Discarded packets |
| A | 0 | 1304 | 0 |
| B | 0 | 1306 | 0 |
| C | 0 | 1306 | 0 |
| D | 0 | 1306 | 0 |
| Quadrant | Total seconds | Saturated seconds | Saturation percentage |
|---|---|---|---|
| A | 63894 | 3332 | 5.214887% |
| B | 63896 | 1806 | 2.826468% |
| C | 63887 | 1975 | 3.091396% |
| D | 63894 | 5323 | 8.330986% |
Noise dominated data is calculated using 1-second bins in cleaned event files. If a bin has >2000 counts, and if more than 50% of those come from <1% of pixels, then it is considered to be noise-dominated and hence unusable.
| Quadrant | # 1 sec bins | Bins with >0 counts | Bins with >2000 counts | High rate bins dominated by noise | Noise dominated (total time) | Noise dominated (detector-on time) | Marked lightcurve |
|---|---|---|---|---|---|---|---|
| A | 74746 | 63828 | 0 | 0 | 0.00% | 0.00% | 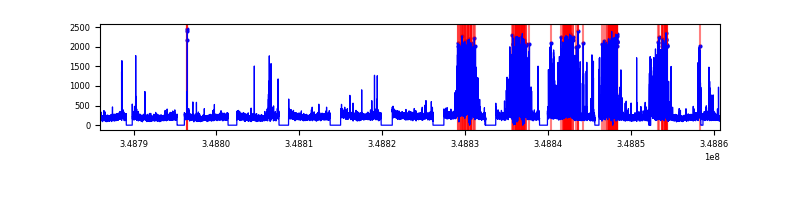 |
| B | 74746 | 63882 | 0 | 0 | 0.00% | 0.00% |  |
| C | 74746 | 63882 | 0 | 0 | 0.00% | 0.00% |  |
| D | 74746 | 63875 | 0 | 0 | 0.00% | 0.00% |  |
Top three noisy pixels from each quadrant. If the there are fewer than three noisy pixels in the level2.evt file, extra rows are filled as -1
| Pixel properties | Quadrant properties | ||||||
|---|---|---|---|---|---|---|---|
| Quadrant | DetID | PixID | Counts | Sigma | Mean | Median | Sigma |
| A | 0 | 29 | 3808 | 11.34 | 1034 | 976 | 249.8 |
| A | 7 | 110 | 3047 | 8.29 | 1034 | 976 | 249.8 |
| A | 9 | 19 | 3023 | 8.19 | 1034 | 976 | 249.8 |
| B | 2 | 9 | 2984 | 10.24 | 1009 | 966 | 197.1 |
| B | 3 | 80 | 2537 | 7.97 | 1009 | 966 | 197.1 |
| B | 3 | 17 | 2517 | 7.87 | 1009 | 966 | 197.1 |
| C | 12 | 241 | 2773 | 7.03 | 1024 | 962 | 257.5 |
| C | 3 | 126 | 2599 | 6.36 | 1024 | 962 | 257.5 |
| C | 9 | 242 | 2560 | 6.21 | 1024 | 962 | 257.5 |
| D | 15 | 46 | 2514 | 6.58 | 948 | 863 | 250.8 |
| D | 6 | 67 | 2364 | 5.99 | 948 | 863 | 250.8 |
| D | 6 | 231 | 2322 | 5.82 | 948 | 863 | 250.8 |
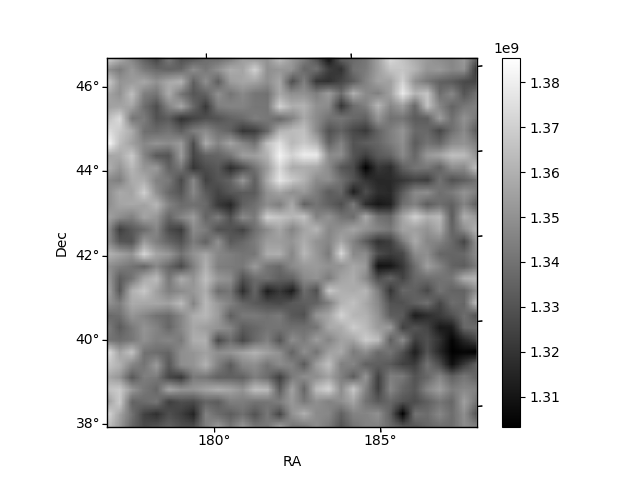
Histogram calculated using DETX and DETY for each event in the final _common_clean file
| Quadrant A | 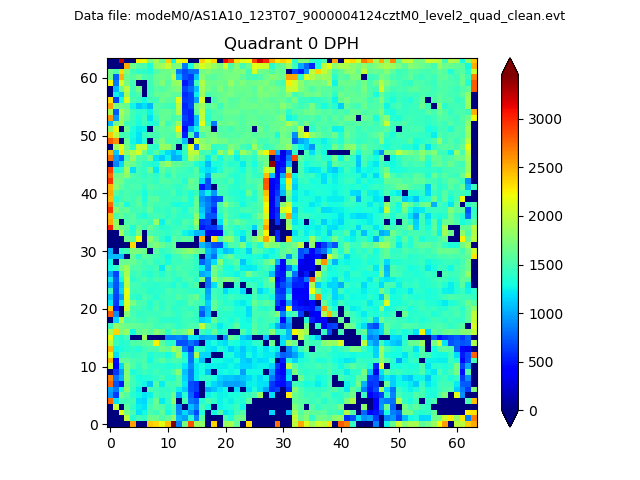 |
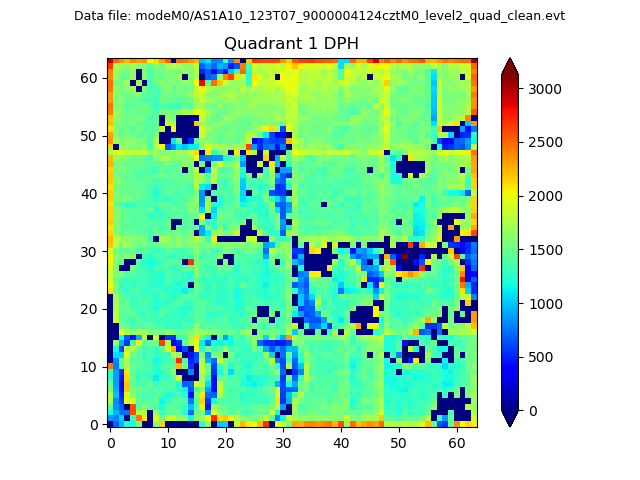 |
Quadrant B |
|---|---|---|---|
| Quadrant D | 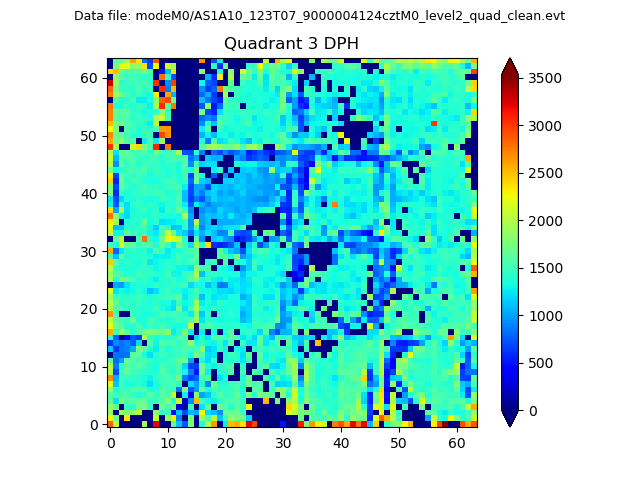 |
 |
Quadrant C |
| Plot type | Count rate plots | Images |
|---|---|---|
| Comparison with Poisson distribution Blue bars denote a histogram of data divided into 1 sec bins. Red curve is a Poisson curve with rate = median count rate of data. |
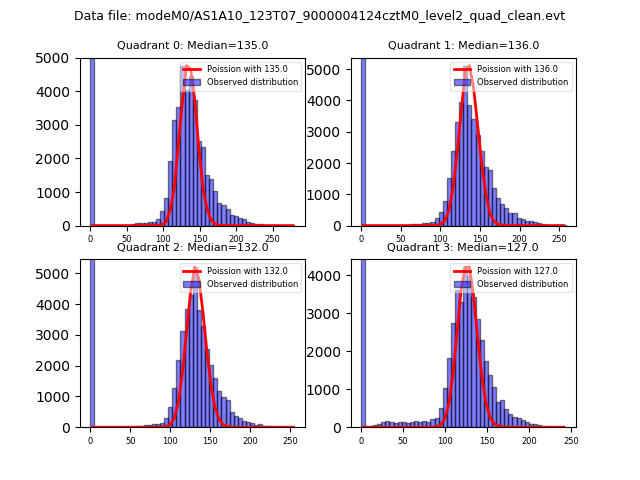 |
 |
| Quadrant-wise count rates Data is divided into 100 sec bins |
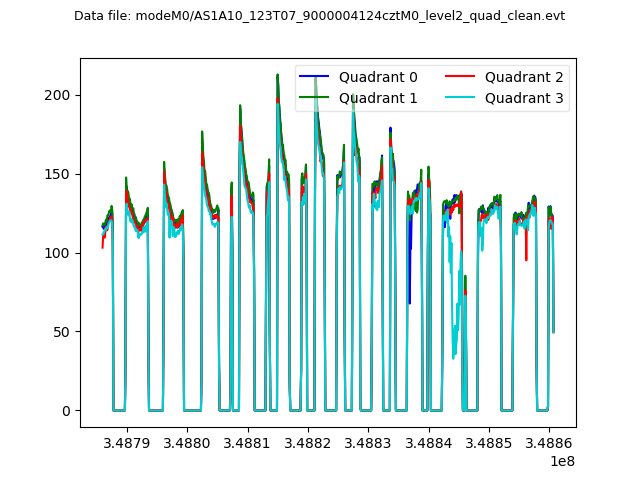 |
|
| Module-wise count rates for Quadrant A Data is divided into 100 sec bins |
 |
 |
| Module-wise count rates for Quadrant B Data is divided into 100 sec bins |
 |
 |
| Module-wise count rates for Quadrant C Data is divided into 100 sec bins |
 |
 |
| Module-wise count rates for Quadrant D Data is divided into 100 sec bins |
 |
 |
| Parameter | Plot |
|---|---|
| CZT HV Monitor |  |
| D_VDD |  |
| Temperature 1 |  |
| Veto HV Monitor |  |
| Veto LLD |  |
| Alpha Counter |  |
| _CPM_Rate |  |
| CZT Counter |  |
| +2.5 Volts monitor |  |
| +5 Volts monitor |  |
| _ROLL_ROT |  |
| _Roll_DEC |  |
| _Roll_RA |  |
| Veto Counter | 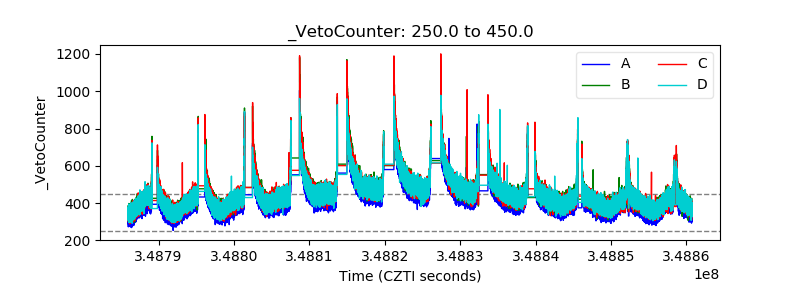 |