| Param | Original file | Final file |
|---|---|---|
| Filename | modeM0/AS1A10_123T07_9000004124_28727cztM0_level2.evt | modeM0/AS1A10_123T07_9000004124_28727cztM0_level2_quad_clean.evt |
| Size (bytes) | 759,064,320 | 140,083,200 |
| Size | 723.9 MB | 133.6 MB |
| Events in quadrant A | 4,795,933 | 895,554 |
| Events in quadrant B | 4,842,918 | 913,673 |
| Events in quadrant C | 5,929,897 | 876,443 |
| Events in quadrant D | 6,730,543 | 851,695 |
| Mode M9 | |||
|---|---|---|---|
| Quadrant | BADHDUFLAG | Total packets | Discarded packets |
| A | 0 | 16 | 0 |
| B | 0 | 16 | 0 |
| C | 0 | 16 | 0 |
| D | 0 | 16 | 0 |
| Mode M0 | |||
|---|---|---|---|
| Quadrant | BADHDUFLAG | Total packets | Discarded packets |
| A | 0 | 21138 | 2 |
| B | 0 | 21148 | 2 |
| C | 0 | 24500 | 2 |
| D | 0 | 27075 | 2 |
| Mode SS | |||
|---|---|---|---|
| Quadrant | BADHDUFLAG | Total packets | Discarded packets |
| A | 0 | 208 | 0 |
| B | 0 | 208 | 0 |
| C | 0 | 208 | 0 |
| D | 0 | 208 | 0 |
| Quadrant | Total seconds | Saturated seconds | Saturation percentage |
|---|---|---|---|
| A | 10178 | 72 | 0.707408% |
| B | 10178 | 84 | 0.825309% |
| C | 10178 | 175 | 1.719395% |
| D | 10178 | 295 | 2.898408% |
Noise dominated data is calculated using 1-second bins in cleaned event files. If a bin has >2000 counts, and if more than 50% of those come from <1% of pixels, then it is considered to be noise-dominated and hence unusable.
| Quadrant | # 1 sec bins | Bins with >0 counts | Bins with >2000 counts | High rate bins dominated by noise | Noise dominated (total time) | Noise dominated (detector-on time) | Marked lightcurve |
|---|---|---|---|---|---|---|---|
| A | 11778 | 10179 | 9 | 9 | 0.08% | 0.09% | 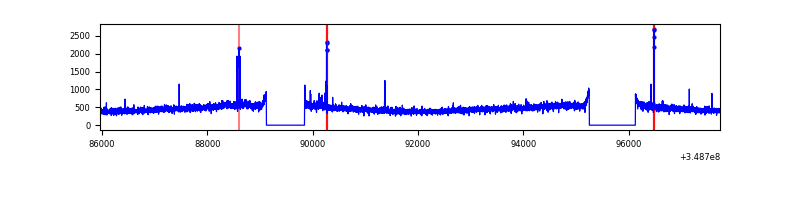 |
| B | 11778 | 10178 | 1 | 1 | 0.01% | 0.01% | 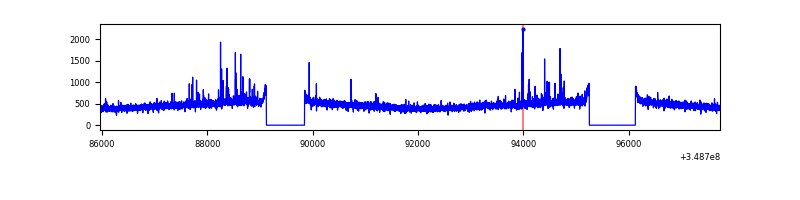 |
| C | 11778 | 10178 | 33 | 33 | 0.28% | 0.32% | 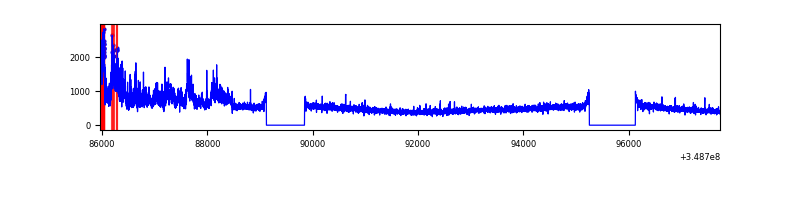 |
| D | 11778 | 10178 | 204 | 204 | 1.73% | 2.00% | 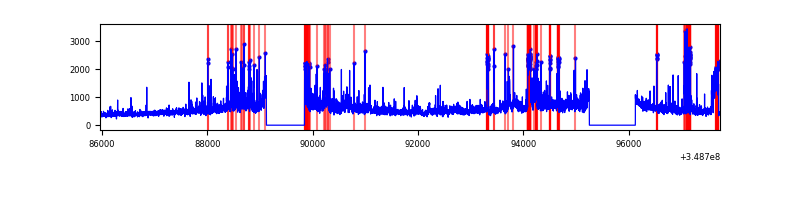 |
Top three noisy pixels from each quadrant. If the there are fewer than three noisy pixels in the level2.evt file, extra rows are filled as -1
| Pixel properties | Quadrant properties | ||||||
|---|---|---|---|---|---|---|---|
| Quadrant | DetID | PixID | Counts | Sigma | Mean | Median | Sigma |
| A | 15 | 174 | 72339 | 290.26 | 1214 | 1188 | 245.1 |
| A | 13 | 254 | 17855 | 67.99 | 1214 | 1188 | 245.1 |
| A | 7 | 16 | 13831 | 51.58 | 1214 | 1188 | 245.1 |
| B | 4 | 80 | 71214 | 299.83 | 1209 | 1176 | 233.6 |
| B | 12 | 111 | 29054 | 119.35 | 1209 | 1176 | 233.6 |
| B | 11 | 111 | 25908 | 105.88 | 1209 | 1176 | 233.6 |
| C | 3 | 233 | 1181491 | 4327.48 | 1164 | 1170 | 272.8 |
| C | 14 | 238 | 193114 | 703.73 | 1164 | 1170 | 272.8 |
| C | 14 | 254 | 14740 | 49.75 | 1164 | 1170 | 272.8 |
| D | 8 | 195 | 1172905 | 4188.94 | 1164 | 1130 | 279.7 |
| D | 1 | 52 | 767030 | 2737.99 | 1164 | 1130 | 279.7 |
| D | 12 | 233 | 237368 | 844.52 | 1164 | 1130 | 279.7 |
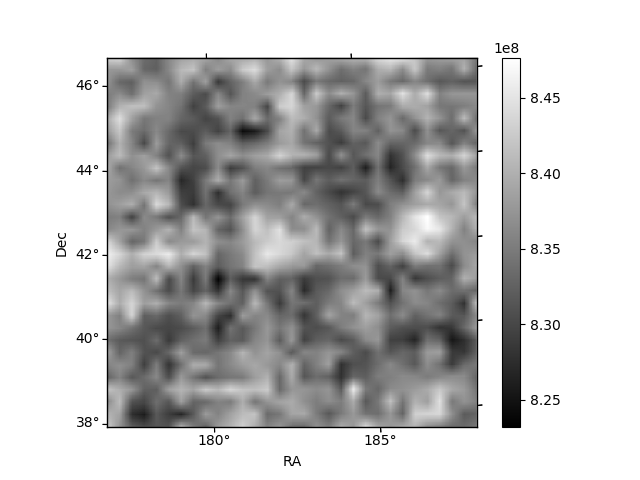
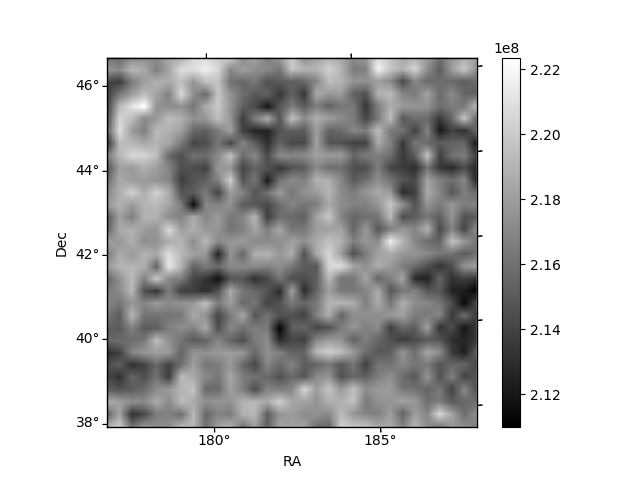
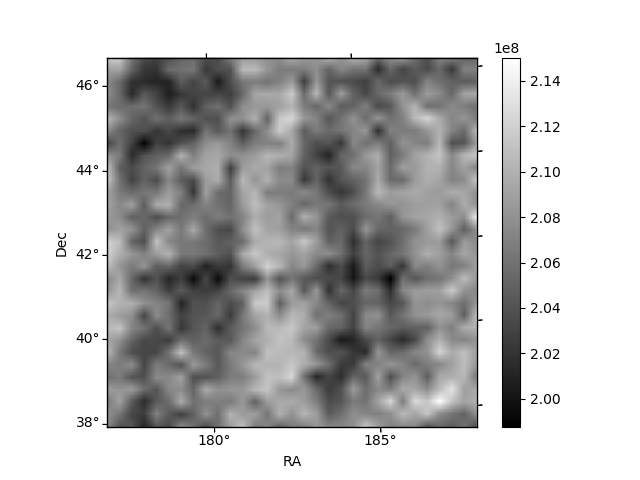
Histogram calculated using DETX and DETY for each event in the final _common_clean file
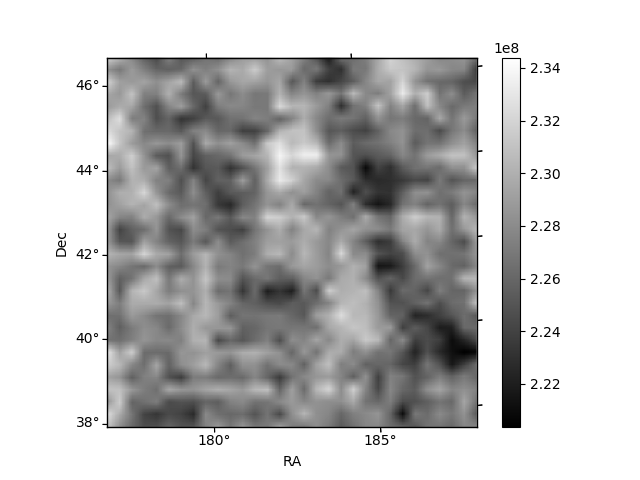
| Quadrant A | 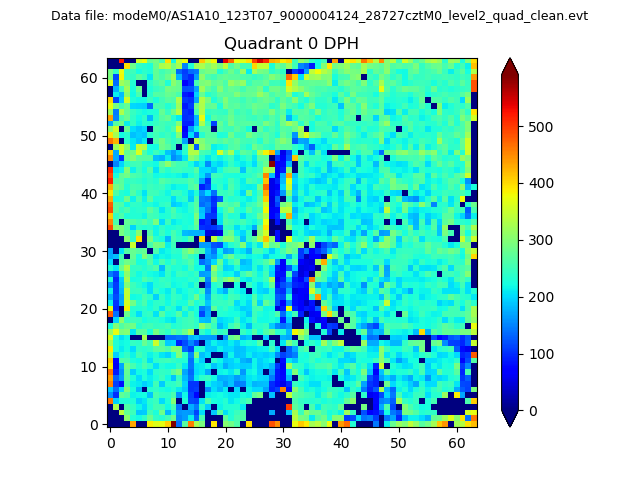 |
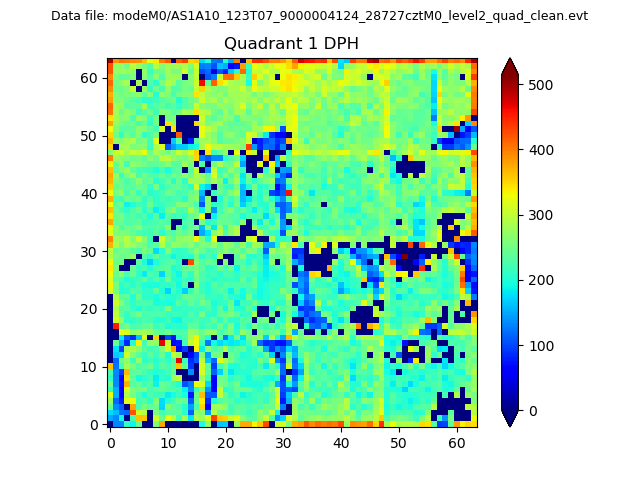 |
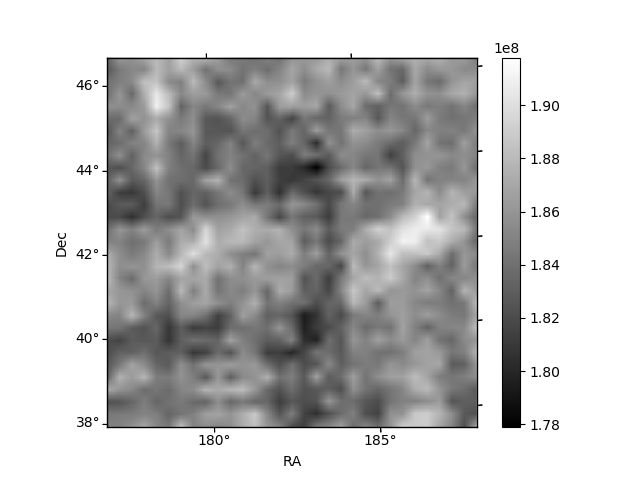
Quadrant B |
|---|---|---|---|
| Quadrant D | 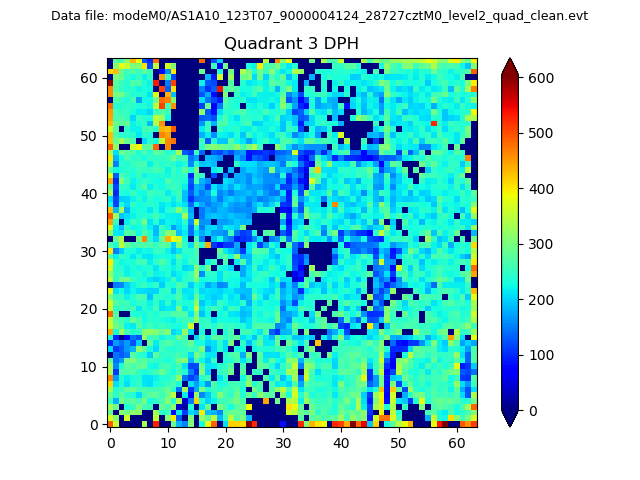 |
 |
Quadrant C |
| Plot type | Count rate plots | Images |
|---|---|---|
| Comparison with Poisson distribution Blue bars denote a histogram of data divided into 1 sec bins. Red curve is a Poisson curve with rate = median count rate of data. |
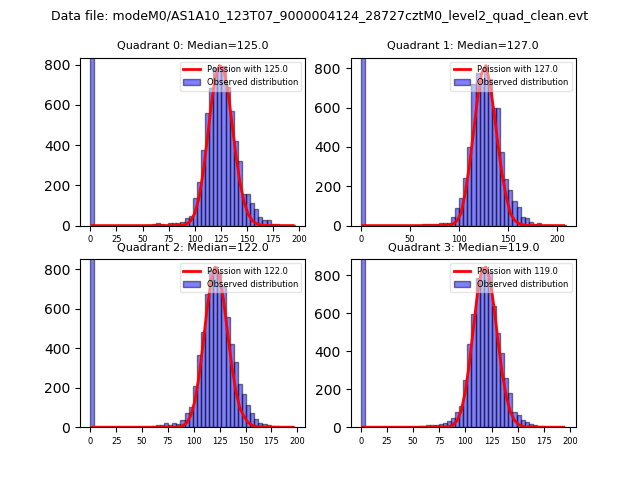 |
 |
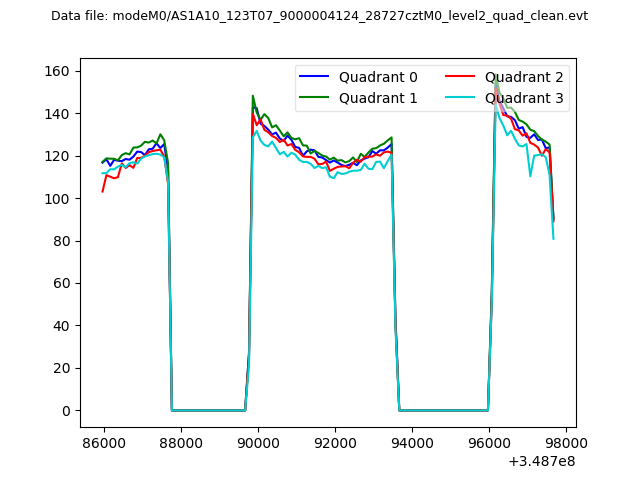
| Quadrant-wise count rates Data is divided into 100 sec bins |
 |
|
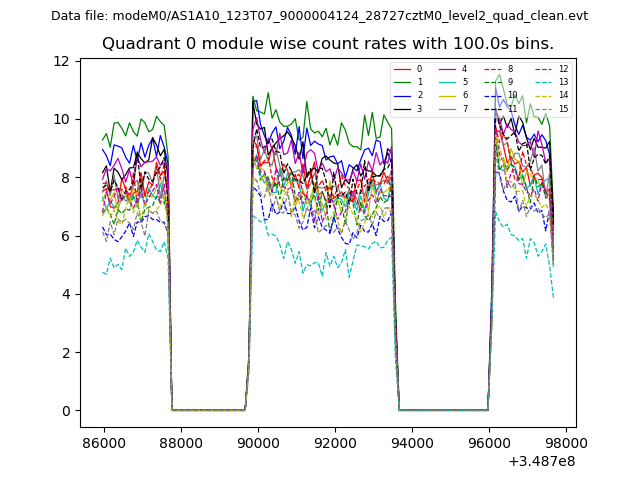
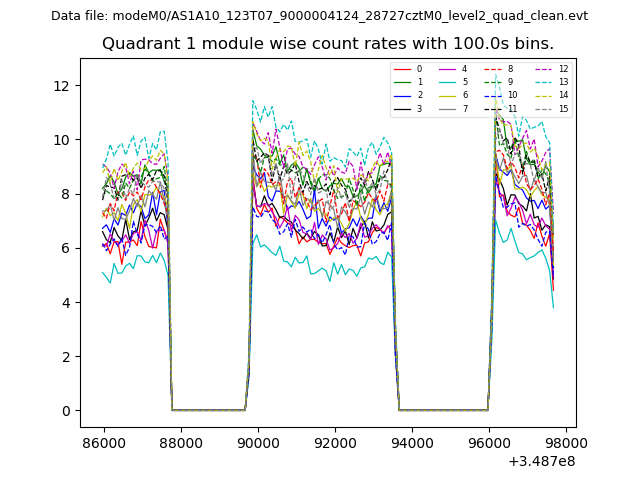
| Module-wise count rates for Quadrant A Data is divided into 100 sec bins |
 |
 |
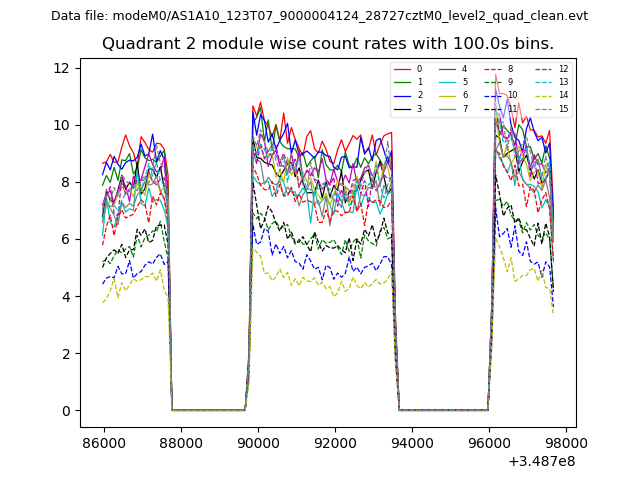
| Module-wise count rates for Quadrant B Data is divided into 100 sec bins |
 |
 |
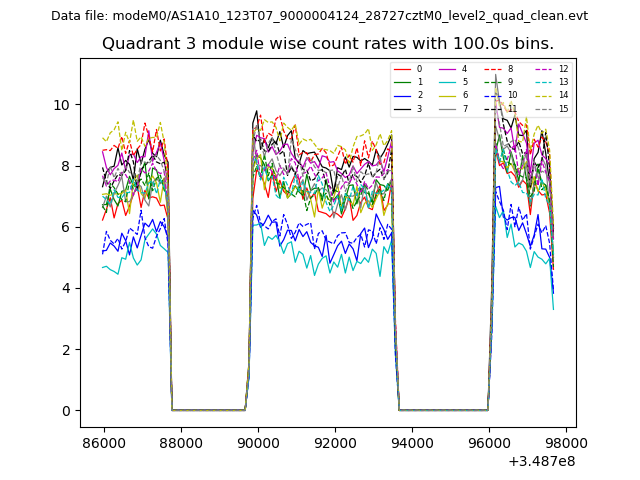
| Module-wise count rates for Quadrant C Data is divided into 100 sec bins |
 |
 |
| Module-wise count rates for Quadrant D Data is divided into 100 sec bins |
 |
 |
| Parameter | Plot |
|---|---|
| CZT HV Monitor | 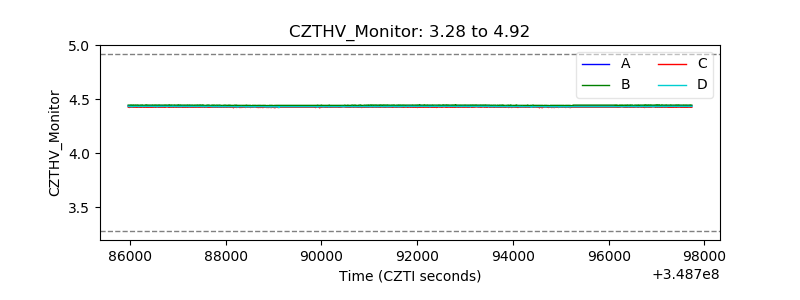 |
| D_VDD | 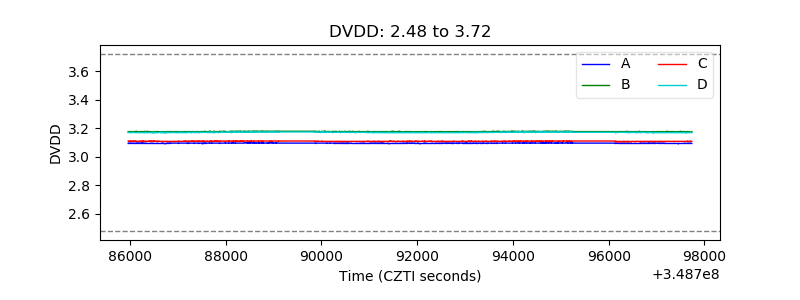 |
| Temperature 1 | 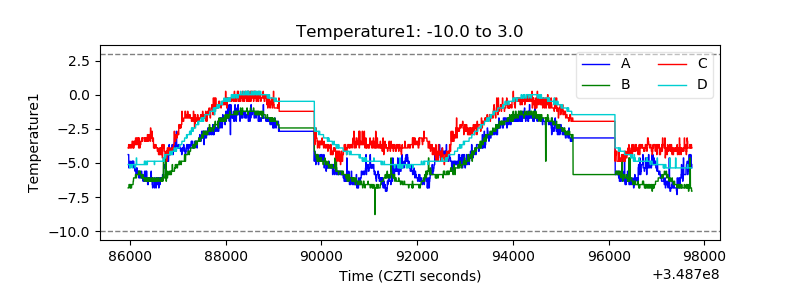 |
| Veto HV Monitor | 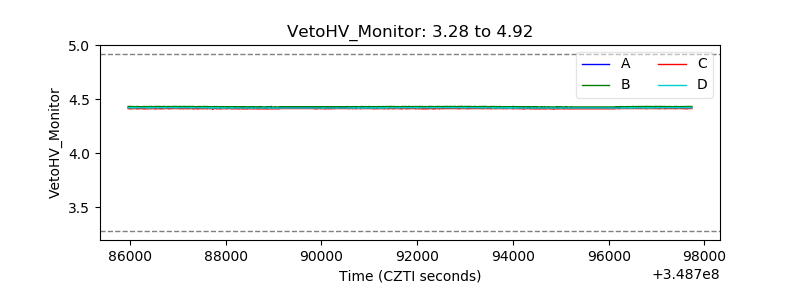 |
| Veto LLD | 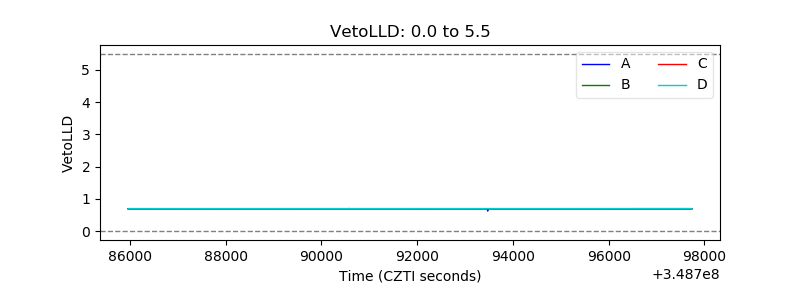 |
| Alpha Counter | 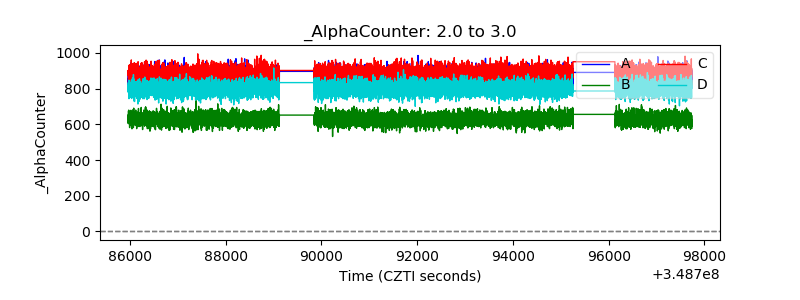 |
| _CPM_Rate | 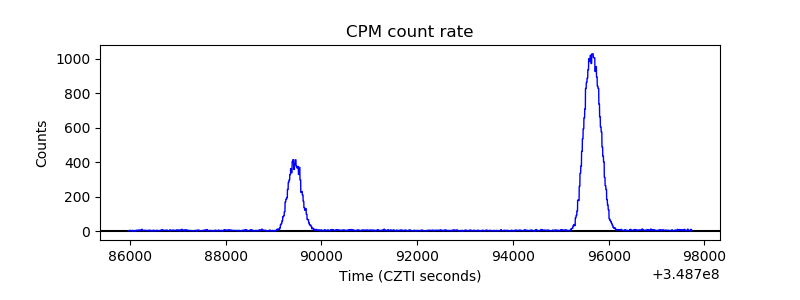 |
| CZT Counter | 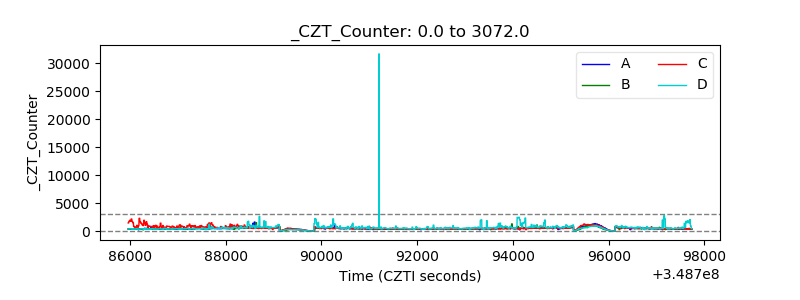 |
| +2.5 Volts monitor |  |
| +5 Volts monitor | 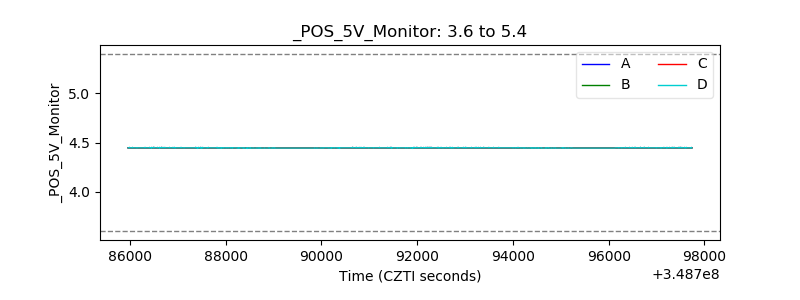 |
| _ROLL_ROT | 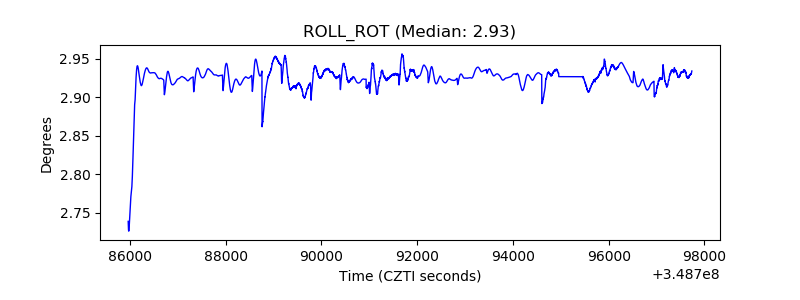 |
| _Roll_DEC | 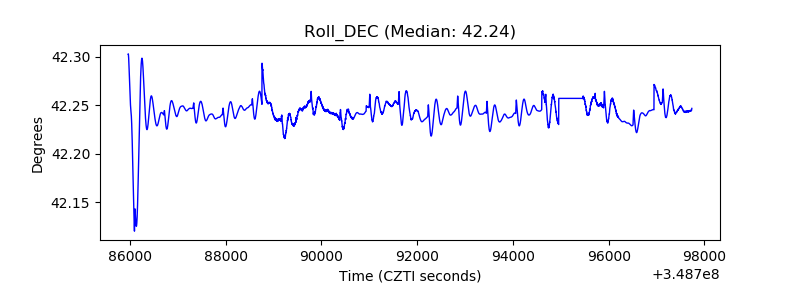 |
| _Roll_RA | 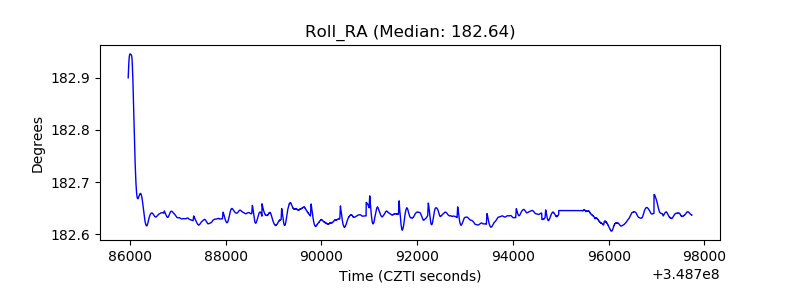 |
| Veto Counter | 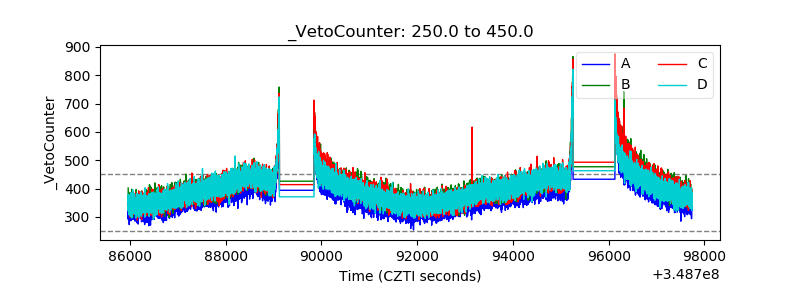 |