| Param | Original file | Final file |
|---|---|---|
| Filename | modeM0/AS1A10_123T07_9000004124_28728cztM0_level2.evt | modeM0/AS1A10_123T07_9000004124_28728cztM0_level2_quad_clean.evt |
| Size (bytes) | 460,900,800 | 92,419,200 |
| Size | 439.5 MB | 88.1 MB |
| Events in quadrant A | 2,994,534 | 592,124 |
| Events in quadrant B | 3,109,231 | 613,397 |
| Events in quadrant C | 3,045,321 | 583,834 |
| Events in quadrant D | 4,369,437 | 558,108 |
| Mode M9 | |||
|---|---|---|---|
| Quadrant | BADHDUFLAG | Total packets | Discarded packets |
| A | 0 | 10 | 0 |
| B | 0 | 10 | 0 |
| C | 0 | 10 | 0 |
| D | 0 | 10 | 0 |
| Mode M0 | |||
|---|---|---|---|
| Quadrant | BADHDUFLAG | Total packets | Discarded packets |
| A | 0 | 13436 | 256 |
| B | 0 | 13637 | 179 |
| C | 0 | 13494 | 225 |
| D | 0 | 17758 | 329 |
| Mode SS | |||
|---|---|---|---|
| Quadrant | BADHDUFLAG | Total packets | Discarded packets |
| A | 0 | 134 | 2 |
| B | 0 | 134 | 2 |
| C | 0 | 134 | 0 |
| D | 0 | 134 | 0 |
| Quadrant | Total seconds | Saturated seconds | Saturation percentage |
|---|---|---|---|
| A | 6458 | 31 | 0.480025% |
| B | 6487 | 37 | 0.570372% |
| C | 6465 | 74 | 1.144625% |
| D | 6457 | 198 | 3.066440% |
Noise dominated data is calculated using 1-second bins in cleaned event files. If a bin has >2000 counts, and if more than 50% of those come from <1% of pixels, then it is considered to be noise-dominated and hence unusable.
| Quadrant | # 1 sec bins | Bins with >0 counts | Bins with >2000 counts | High rate bins dominated by noise | Noise dominated (total time) | Noise dominated (detector-on time) | Marked lightcurve |
|---|---|---|---|---|---|---|---|
| A | 7633 | 6541 | 2 | 2 | 0.03% | 0.03% | 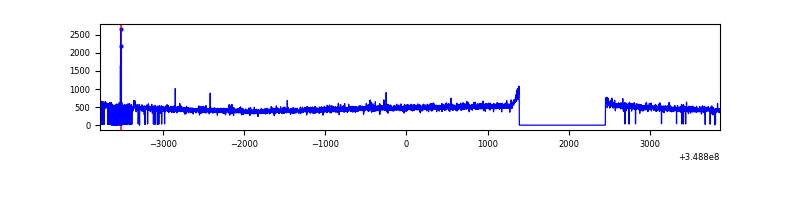 |
| B | 7632 | 6559 | 1 | 1 | 0.01% | 0.02% | 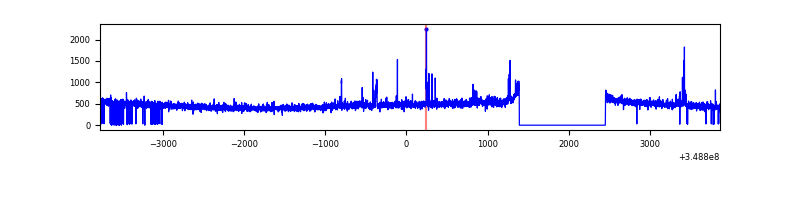 |
| C | 7633 | 6540 | 0 | 0 | 0.00% | 0.00% | 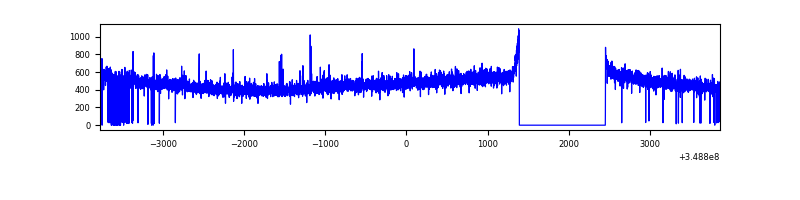 |
| D | 7631 | 6536 | 176 | 176 | 2.31% | 2.69% | 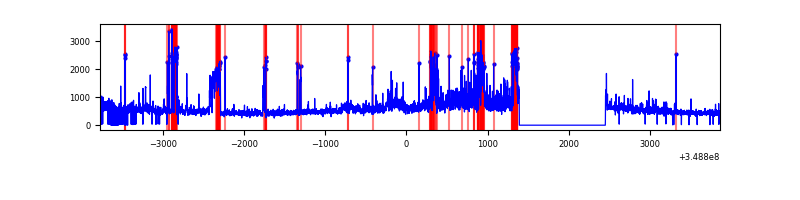 |
Top three noisy pixels from each quadrant. If the there are fewer than three noisy pixels in the level2.evt file, extra rows are filled as -1
| Pixel properties | Quadrant properties | ||||||
|---|---|---|---|---|---|---|---|
| Quadrant | DetID | PixID | Counts | Sigma | Mean | Median | Sigma |
| A | 13 | 254 | 12426 | 75.23 | 771 | 754 | 155.2 |
| A | 14 | 239 | 8702 | 51.22 | 771 | 754 | 155.2 |
| A | 3 | 137 | 7648 | 44.43 | 771 | 754 | 155.2 |
| B | 4 | 80 | 57688 | 382.68 | 774 | 753 | 148.8 |
| B | 12 | 111 | 18276 | 117.78 | 774 | 753 | 148.8 |
| B | 11 | 111 | 16259 | 104.22 | 774 | 753 | 148.8 |
| C | 14 | 238 | 128466 | 731.88 | 742 | 747 | 174.5 |
| C | 14 | 254 | 13292 | 71.89 | 742 | 747 | 174.5 |
| C | 3 | 233 | 12615 | 68.01 | 742 | 747 | 174.5 |
| D | 8 | 195 | 799973 | 4574.02 | 730 | 710 | 174.7 |
| D | 1 | 52 | 676871 | 3869.53 | 730 | 710 | 174.7 |
| D | 12 | 233 | 94123 | 534.58 | 730 | 710 | 174.7 |
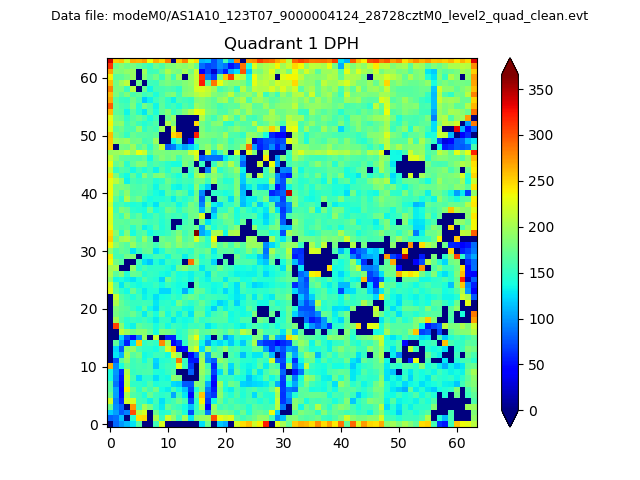
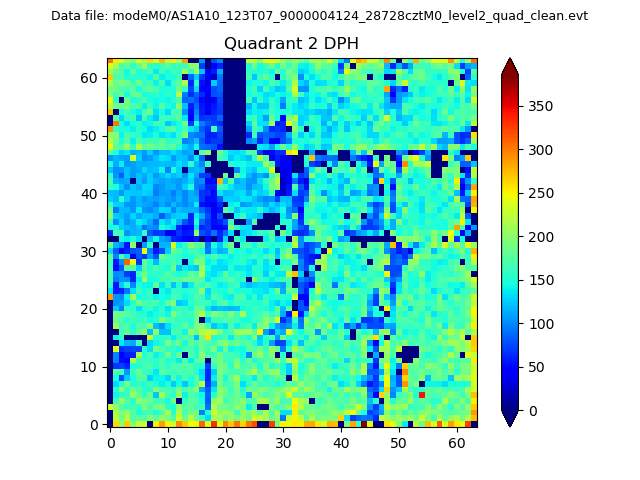
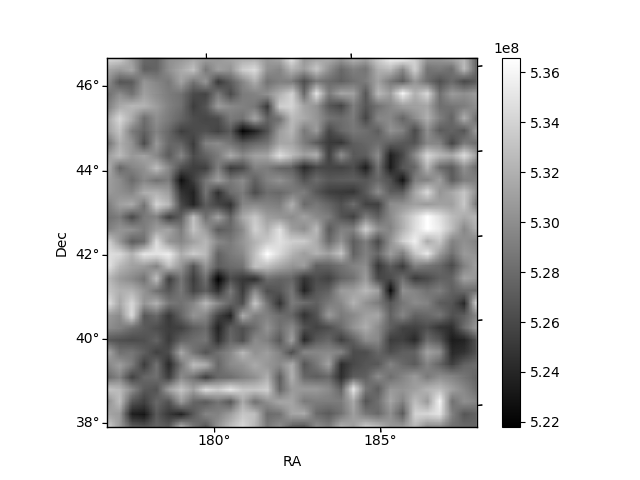
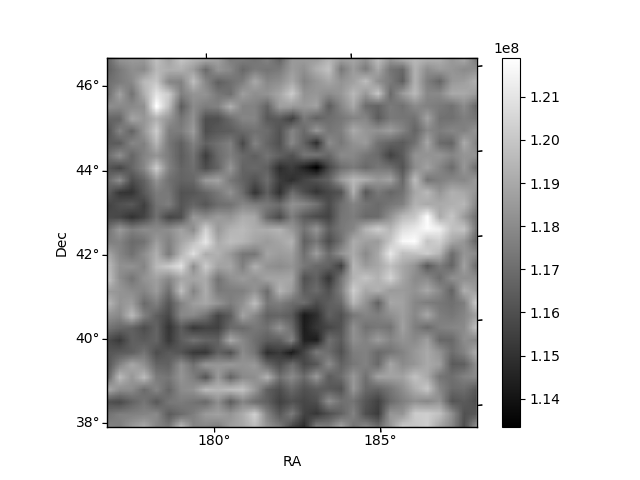
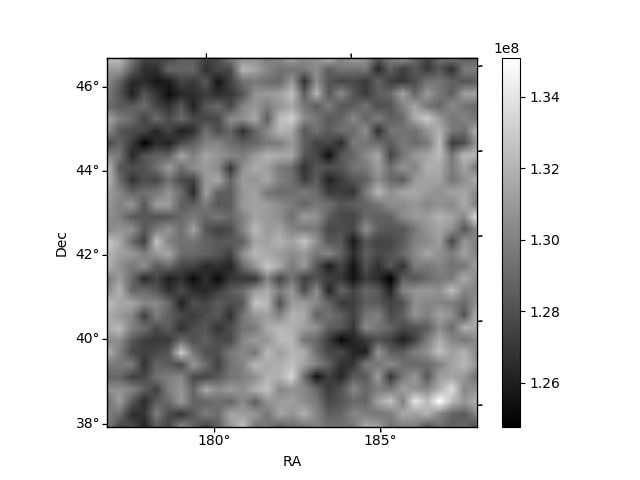
Histogram calculated using DETX and DETY for each event in the final _common_clean file
| Quadrant A |  |
 |
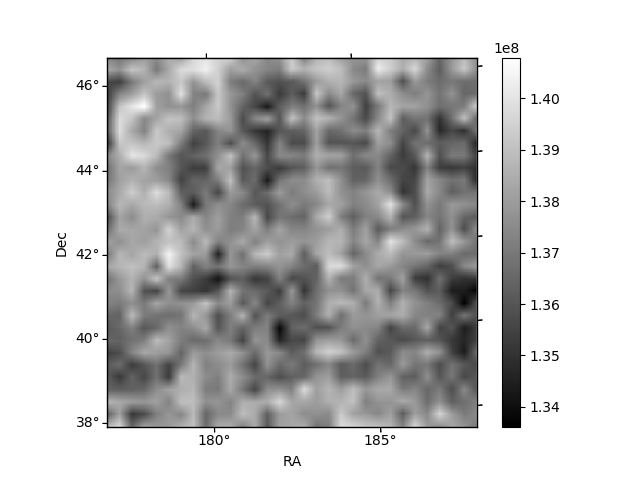
Quadrant B |
|---|---|---|---|
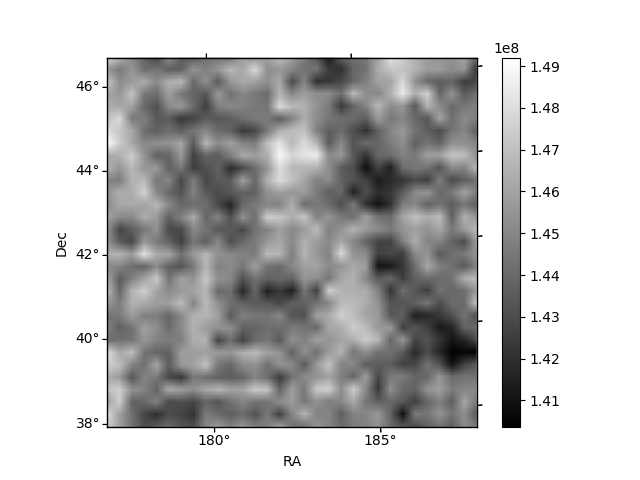
| Quadrant D | 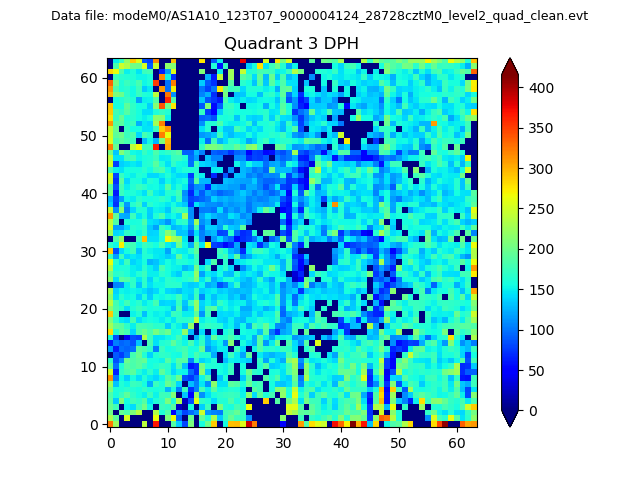 |
 |
Quadrant C |
| Plot type | Count rate plots | Images |
|---|---|---|
| Comparison with Poisson distribution Blue bars denote a histogram of data divided into 1 sec bins. Red curve is a Poisson curve with rate = median count rate of data. |
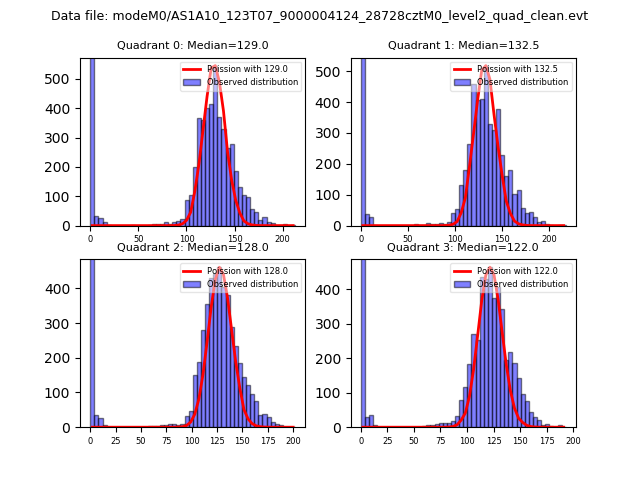 |
 |
| Quadrant-wise count rates Data is divided into 100 sec bins |
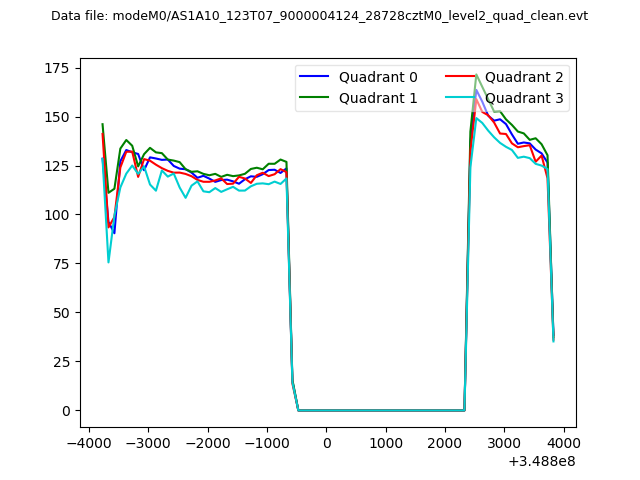 |
|
| Module-wise count rates for Quadrant A Data is divided into 100 sec bins |
 |
 |
| Module-wise count rates for Quadrant B Data is divided into 100 sec bins |
 |
 |
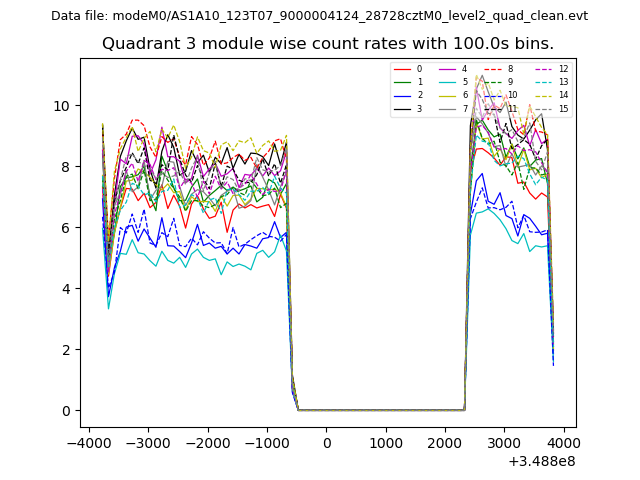
| Module-wise count rates for Quadrant C Data is divided into 100 sec bins |
 |
 |
| Module-wise count rates for Quadrant D Data is divided into 100 sec bins |
 |
 |
| Parameter | Plot |
|---|---|
| CZT HV Monitor | 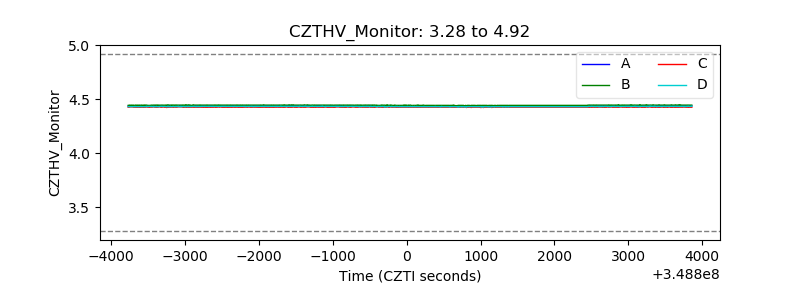 |
| D_VDD | 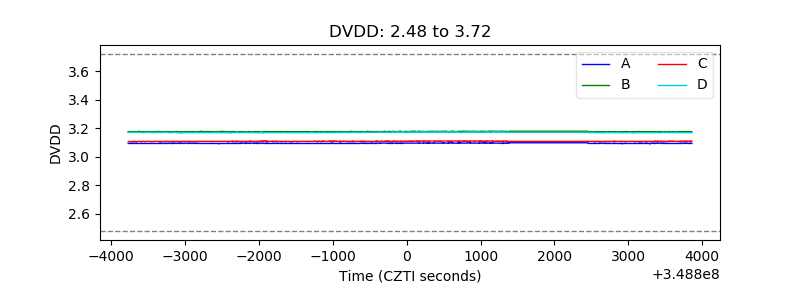 |
| Temperature 1 | 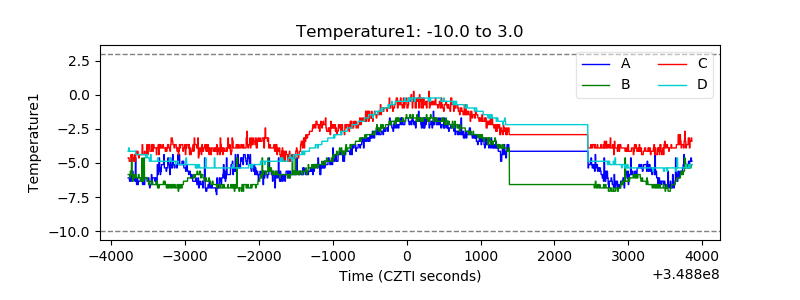 |
| Veto HV Monitor | 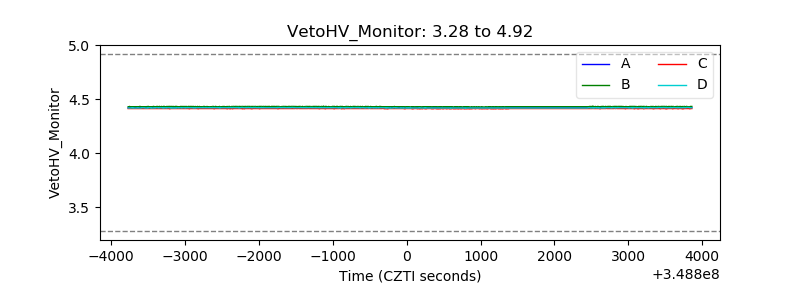 |
| Veto LLD |  |
| Alpha Counter | 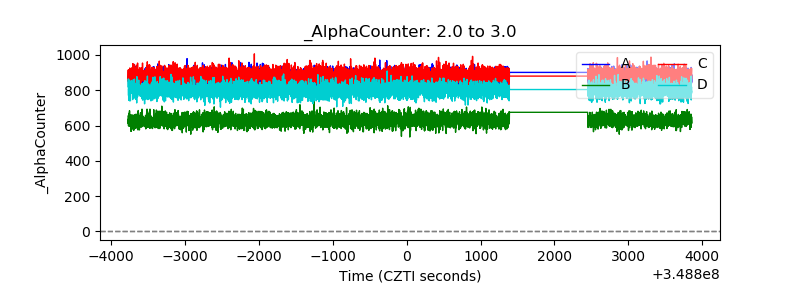 |
| _CPM_Rate | 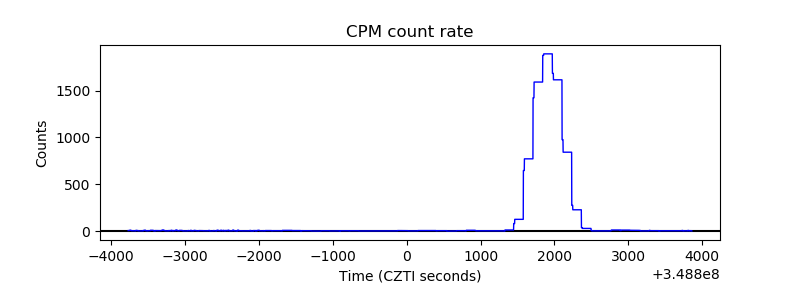 |
| CZT Counter | 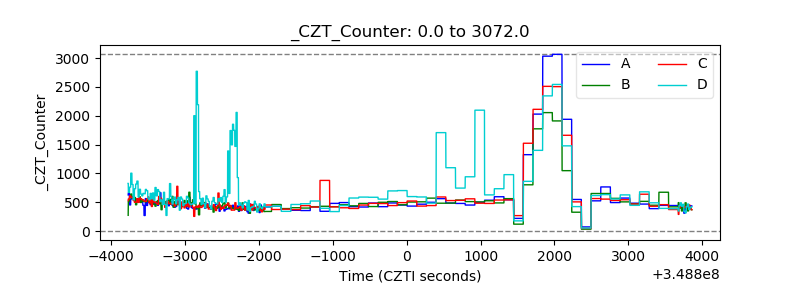 |
| +2.5 Volts monitor |  |
| +5 Volts monitor | 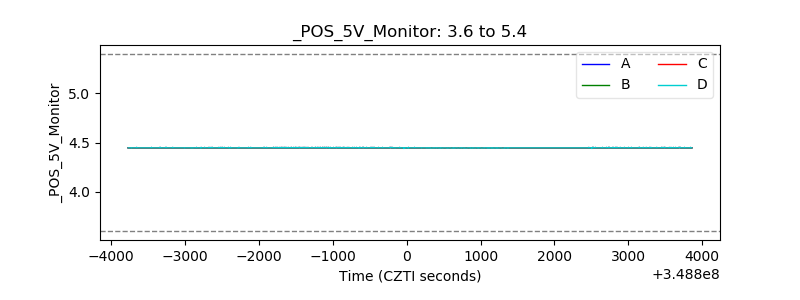 |
| _ROLL_ROT | 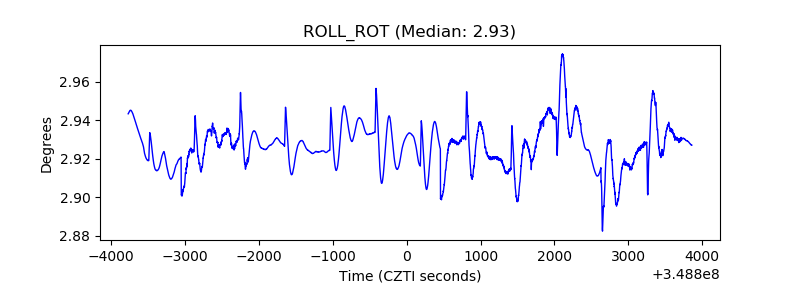 |
| _Roll_DEC | 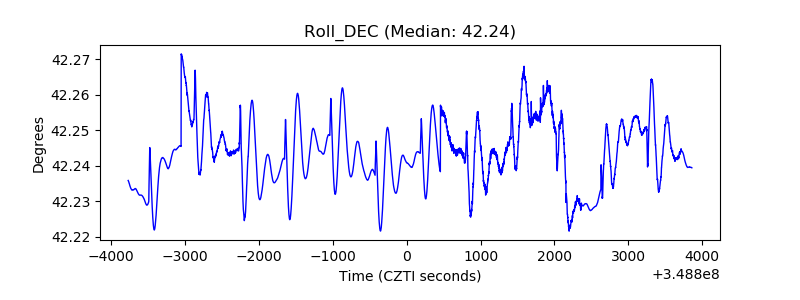 |
| _Roll_RA | 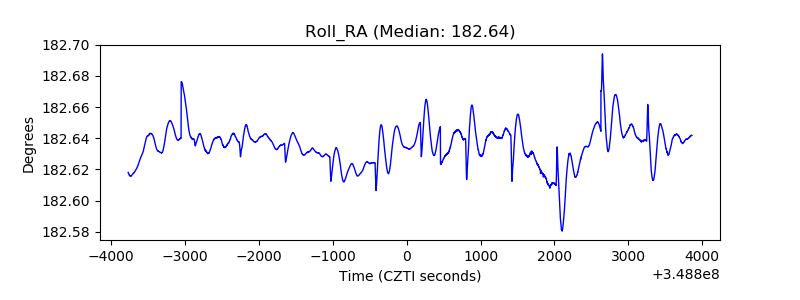 |
| Veto Counter | 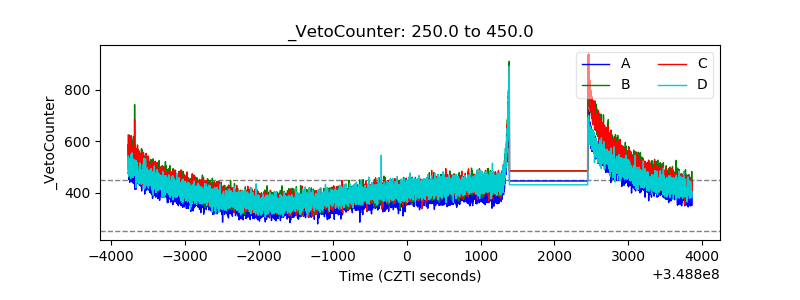 |