| Param | Original file | Final file |
|---|---|---|
| Filename | modeM0/AS1A10_123T07_9000004124_28731cztM0_level2.evt | modeM0/AS1A10_123T07_9000004124_28731cztM0_level2_quad_clean.evt |
| Size (bytes) | 1,282,276,800 | 240,220,800 |
| Size | 1.2 GB | 229.1 MB |
| Events in quadrant A | 8,222,812 | 1,555,717 |
| Events in quadrant B | 8,357,157 | 1,589,774 |
| Events in quadrant C | 8,211,417 | 1,512,813 |
| Events in quadrant D | 12,905,237 | 1,456,451 |
| Mode M9 | |||
|---|---|---|---|
| Quadrant | BADHDUFLAG | Total packets | Discarded packets |
| A | 0 | 34 | 0 |
| B | 0 | 34 | 0 |
| C | 0 | 34 | 0 |
| D | 0 | 34 | 0 |
| Mode M0 | |||
|---|---|---|---|
| Quadrant | BADHDUFLAG | Total packets | Discarded packets |
| A | 0 | 35093 | 3 |
| B | 0 | 35429 | 3 |
| C | 0 | 34986 | 3 |
| D | 0 | 49942 | 3 |
| Mode SS | |||
|---|---|---|---|
| Quadrant | BADHDUFLAG | Total packets | Discarded packets |
| A | 0 | 344 | 0 |
| B | 0 | 344 | 0 |
| C | 0 | 344 | 0 |
| D | 0 | 344 | 0 |
| Quadrant | Total seconds | Saturated seconds | Saturation percentage |
|---|---|---|---|
| A | 16835 | 110 | 0.653401% |
| B | 16835 | 148 | 0.879121% |
| C | 16835 | 231 | 1.372141% |
| D | 16836 | 867 | 5.149679% |
Noise dominated data is calculated using 1-second bins in cleaned event files. If a bin has >2000 counts, and if more than 50% of those come from <1% of pixels, then it is considered to be noise-dominated and hence unusable.
| Quadrant | # 1 sec bins | Bins with >0 counts | Bins with >2000 counts | High rate bins dominated by noise | Noise dominated (total time) | Noise dominated (detector-on time) | Marked lightcurve |
|---|---|---|---|---|---|---|---|
| A | 20320 | 16835 | 6 | 6 | 0.03% | 0.04% | 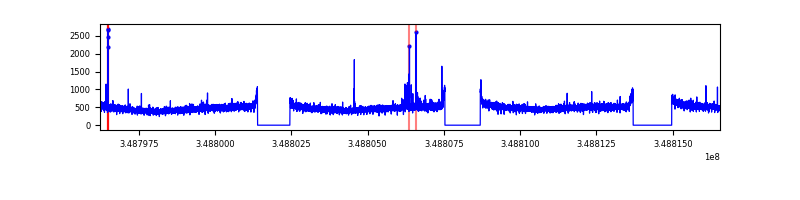 |
| B | 20320 | 16835 | 14 | 14 | 0.07% | 0.08% | 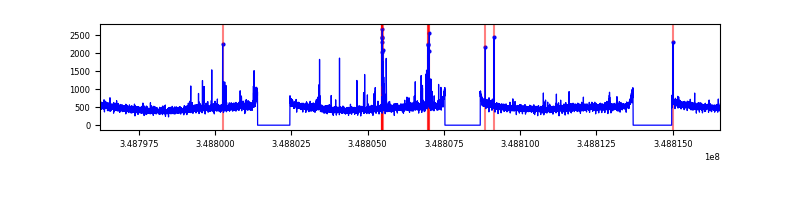 |
| C | 20320 | 16835 | 0 | 0 | 0.00% | 0.00% | 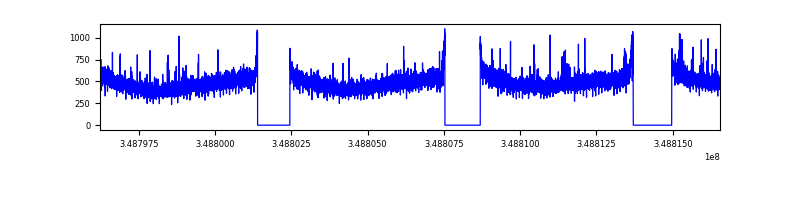 |
| D | 20321 | 16836 | 669 | 669 | 3.29% | 3.97% | 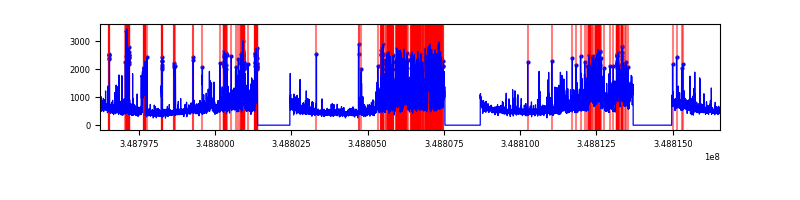 |
Top three noisy pixels from each quadrant. If the there are fewer than three noisy pixels in the level2.evt file, extra rows are filled as -1
| Pixel properties | Quadrant properties | ||||||
|---|---|---|---|---|---|---|---|
| Quadrant | DetID | PixID | Counts | Sigma | Mean | Median | Sigma |
| A | 15 | 174 | 84782 | 199.35 | 2101 | 2061 | 414.9 |
| A | 13 | 254 | 31435 | 70.79 | 2101 | 2061 | 414.9 |
| A | 3 | 137 | 19708 | 42.53 | 2101 | 2061 | 414.9 |
| B | 4 | 80 | 174449 | 445.12 | 2077 | 2026 | 387.4 |
| B | 12 | 111 | 47259 | 116.77 | 2077 | 2026 | 387.4 |
| B | 11 | 111 | 42880 | 105.47 | 2077 | 2026 | 387.4 |
| C | 14 | 238 | 355992 | 771.4 | 1995 | 2012 | 458.9 |
| C | 14 | 254 | 46100 | 96.08 | 1995 | 2012 | 458.9 |
| C | 3 | 233 | 40368 | 83.59 | 1995 | 2012 | 458.9 |
| D | 1 | 52 | 2658777 | 5691.73 | 1982 | 1930 | 466.8 |
| D | 8 | 195 | 2055981 | 4400.36 | 1982 | 1930 | 466.8 |
| D | 5 | 222 | 406194 | 866.05 | 1982 | 1930 | 466.8 |
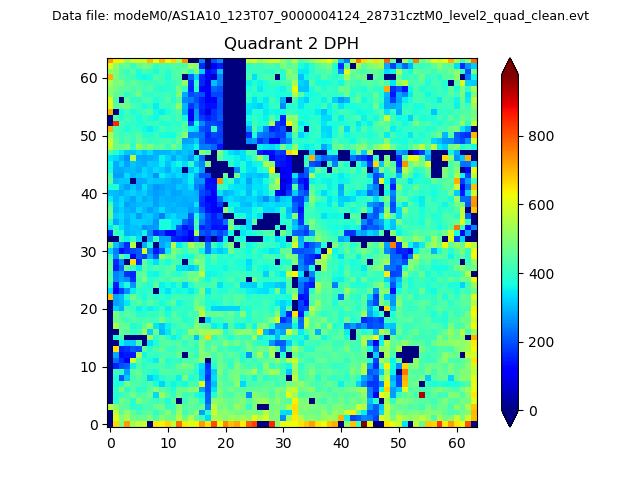
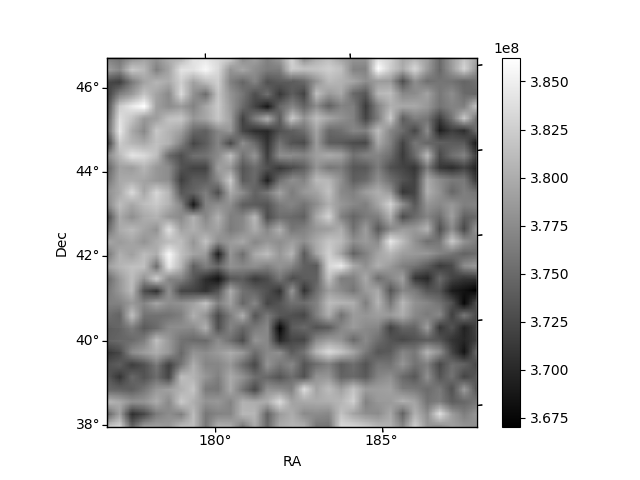
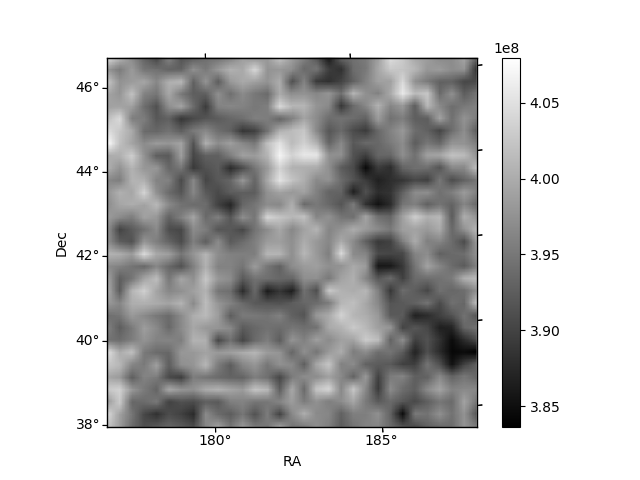
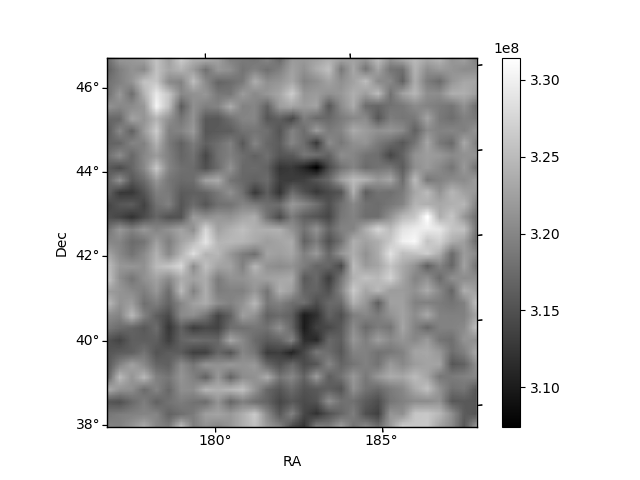
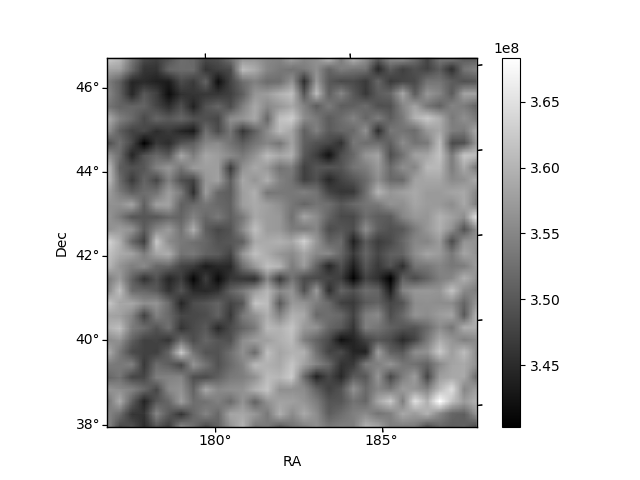
Histogram calculated using DETX and DETY for each event in the final _common_clean file
| Quadrant A | 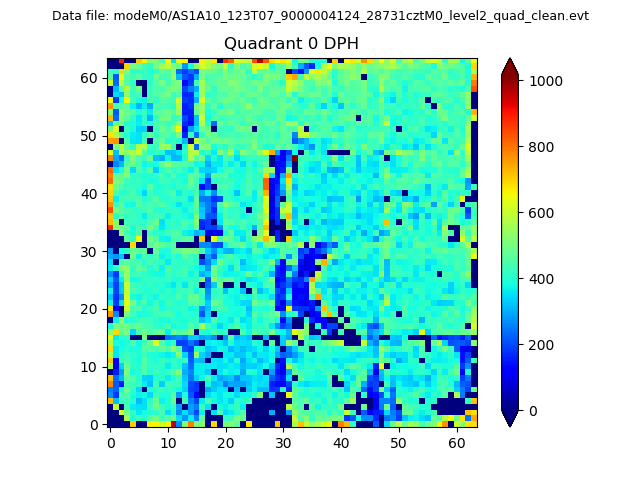 |
 |
Quadrant B |
|---|---|---|---|
| Quadrant D |  |
 |
Quadrant C |
| Plot type | Count rate plots | Images |
|---|---|---|
| Comparison with Poisson distribution Blue bars denote a histogram of data divided into 1 sec bins. Red curve is a Poisson curve with rate = median count rate of data. |
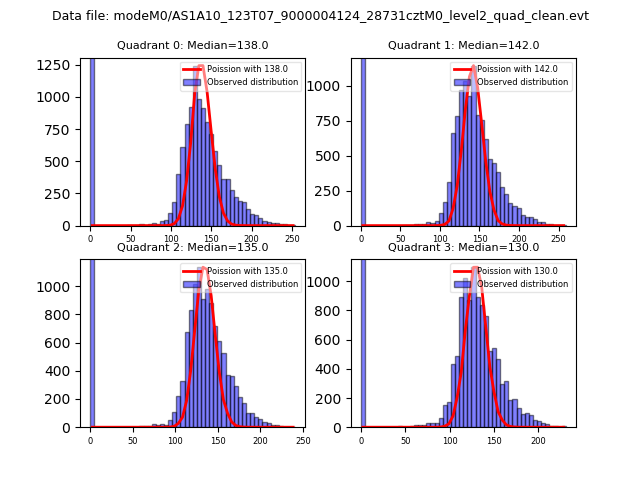 |
 |
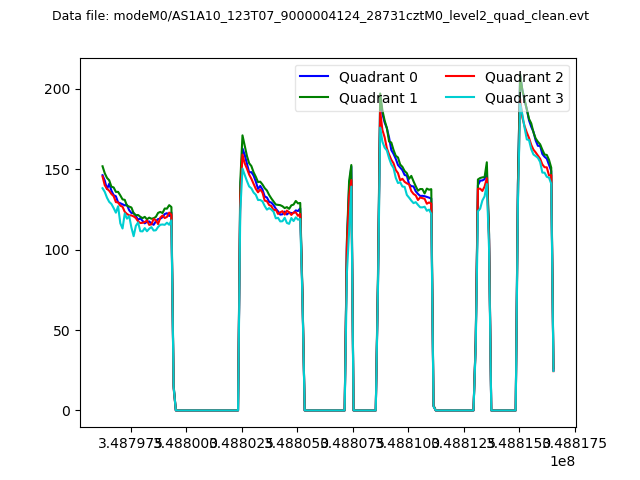
| Quadrant-wise count rates Data is divided into 100 sec bins |
 |
|
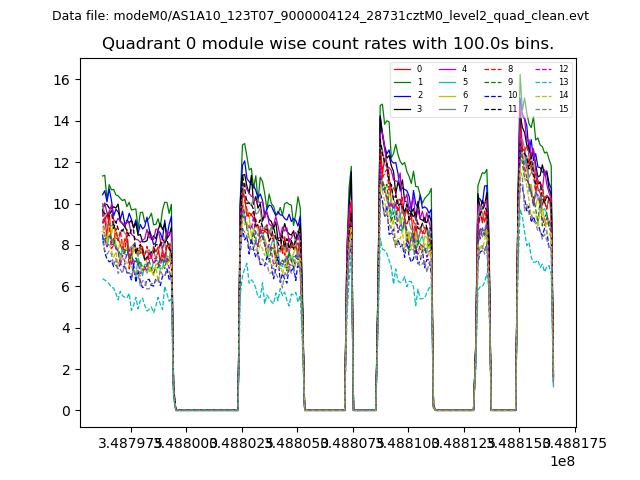
| Module-wise count rates for Quadrant A Data is divided into 100 sec bins |
 |
 |
| Module-wise count rates for Quadrant B Data is divided into 100 sec bins |
 |
 |
| Module-wise count rates for Quadrant C Data is divided into 100 sec bins |
 |
 |
| Module-wise count rates for Quadrant D Data is divided into 100 sec bins |
 |
 |
| Parameter | Plot |
|---|---|
| CZT HV Monitor | 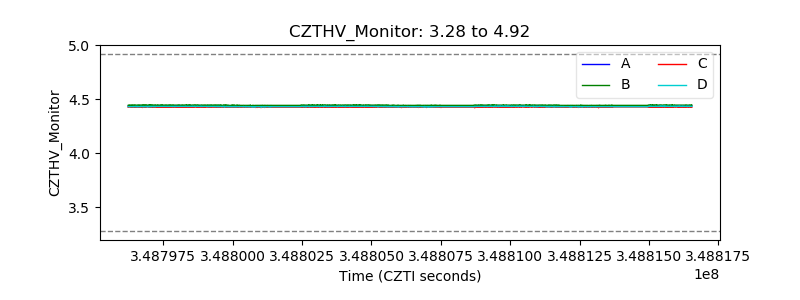 |
| D_VDD | 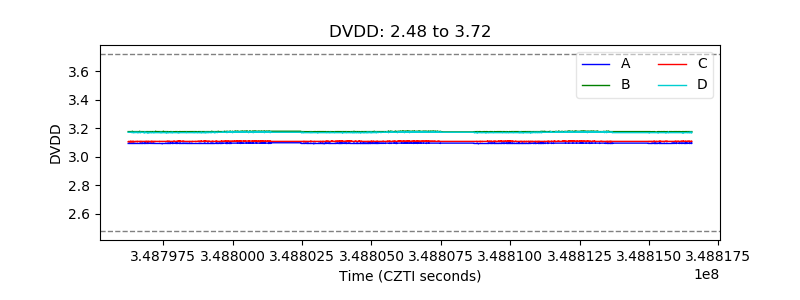 |
| Temperature 1 | 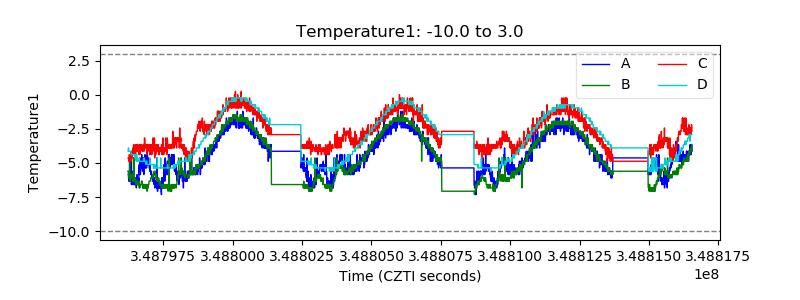 |
| Veto HV Monitor | 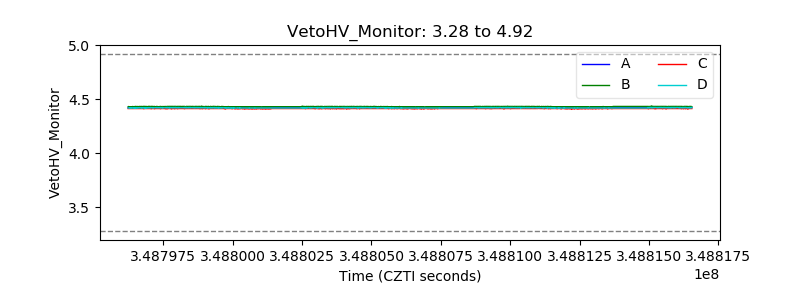 |
| Veto LLD | 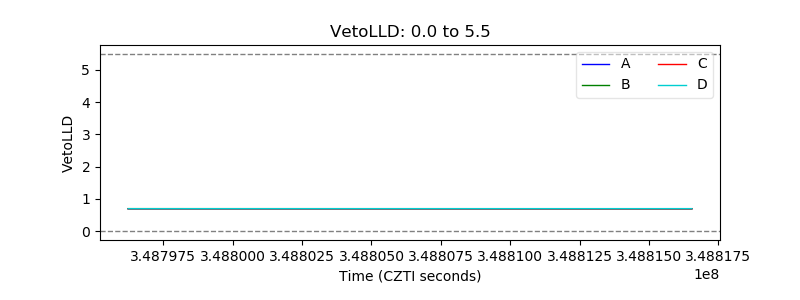 |
| Alpha Counter | 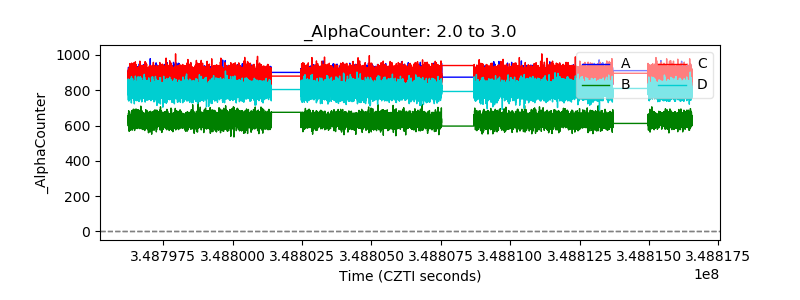 |
| _CPM_Rate | 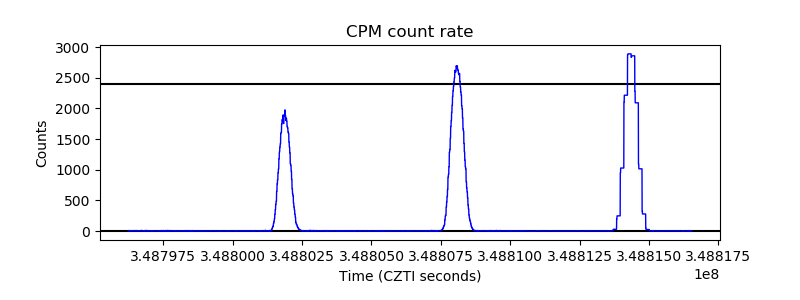 |
| CZT Counter | 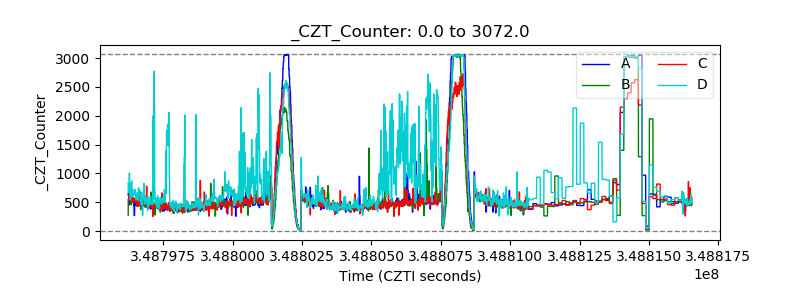 |
| +2.5 Volts monitor |  |
| +5 Volts monitor |  |
| _ROLL_ROT | 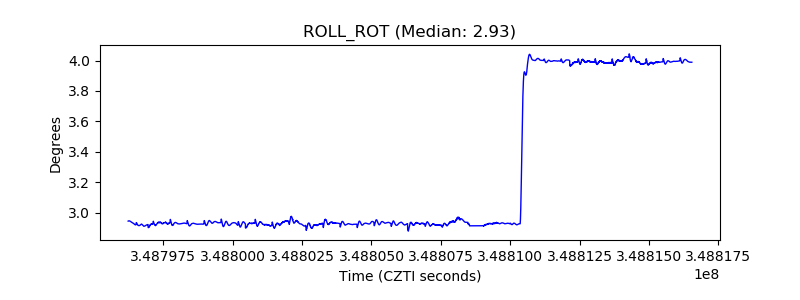 |
| _Roll_DEC | 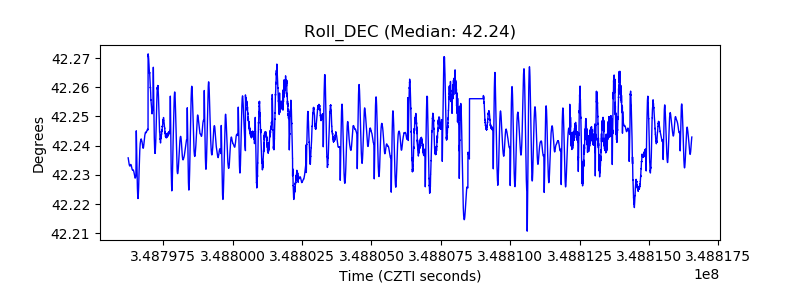 |
| _Roll_RA | 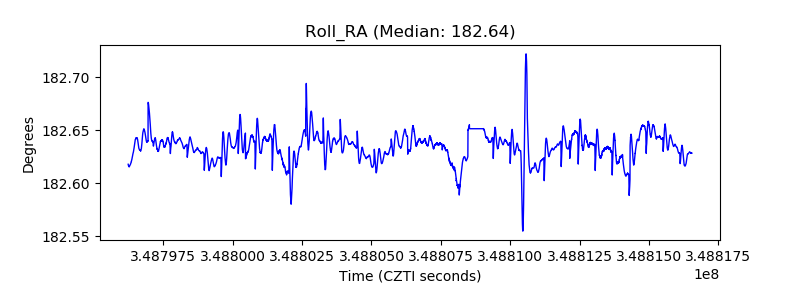 |
| Veto Counter | 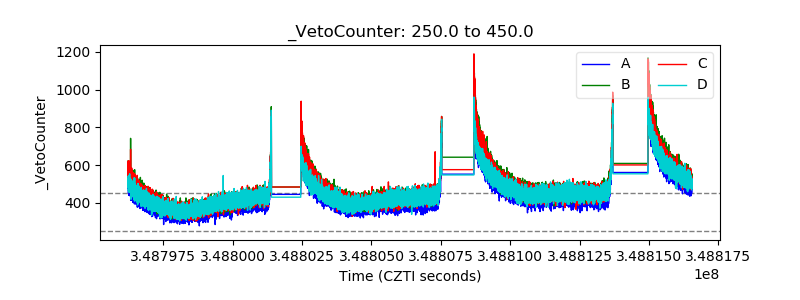 |