| Param | Original file | Final file |
|---|---|---|
| Filename | modeM0/AS1A10_123T07_9000004124_28733cztM0_level2.evt | modeM0/AS1A10_123T07_9000004124_28733cztM0_level2_quad_clean.evt |
| Size (bytes) | 481,317,120 | 93,700,800 |
| Size | 459.0 MB | 89.4 MB |
| Events in quadrant A | 3,141,226 | 626,421 |
| Events in quadrant B | 3,244,505 | 629,658 |
| Events in quadrant C | 3,117,286 | 590,755 |
| Events in quadrant D | 4,679,304 | 584,624 |
| Mode M9 | |||
|---|---|---|---|
| Quadrant | BADHDUFLAG | Total packets | Discarded packets |
| A | 0 | 13 | 0 |
| B | 0 | 13 | 0 |
| C | 0 | 13 | 0 |
| D | 0 | 13 | 0 |
| Mode M0 | |||
|---|---|---|---|
| Quadrant | BADHDUFLAG | Total packets | Discarded packets |
| A | 0 | 12528 | 1 |
| B | 0 | 12908 | 1 |
| C | 0 | 12492 | 1 |
| D | 0 | 18003 | 1 |
| Mode SS | |||
|---|---|---|---|
| Quadrant | BADHDUFLAG | Total packets | Discarded packets |
| A | 0 | 118 | 0 |
| B | 0 | 118 | 0 |
| C | 0 | 118 | 0 |
| D | 0 | 118 | 0 |
| Quadrant | Total seconds | Saturated seconds | Saturation percentage |
|---|---|---|---|
| A | 5813 | 96 | 1.651471% |
| B | 5814 | 133 | 2.287582% |
| C | 5814 | 162 | 2.786378% |
| D | 5814 | 225 | 3.869969% |
Noise dominated data is calculated using 1-second bins in cleaned event files. If a bin has >2000 counts, and if more than 50% of those come from <1% of pixels, then it is considered to be noise-dominated and hence unusable.
| Quadrant | # 1 sec bins | Bins with >0 counts | Bins with >2000 counts | High rate bins dominated by noise | Noise dominated (total time) | Noise dominated (detector-on time) | Marked lightcurve |
|---|---|---|---|---|---|---|---|
| A | 7123 | 5813 | 0 | 0 | 0.00% | 0.00% | 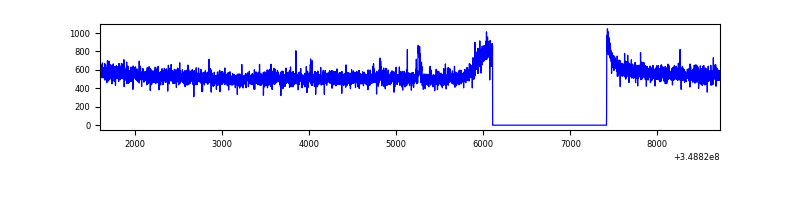 |
| B | 7124 | 5814 | 24 | 24 | 0.34% | 0.41% | 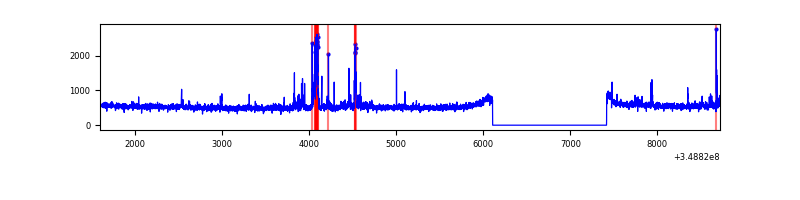 |
| C | 7124 | 5814 | 0 | 0 | 0.00% | 0.00% | 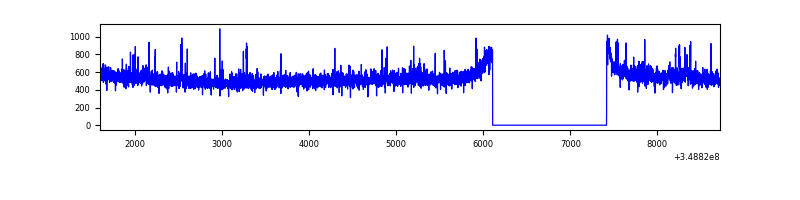 |
| D | 7124 | 5814 | 156 | 156 | 2.19% | 2.68% | 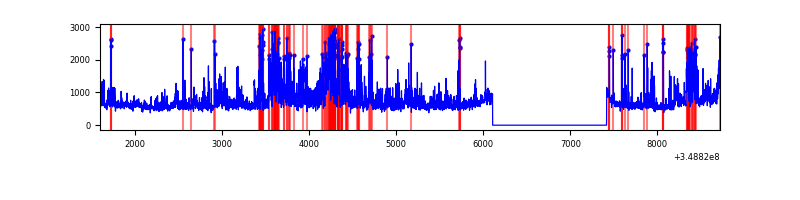 |
Top three noisy pixels from each quadrant. If the there are fewer than three noisy pixels in the level2.evt file, extra rows are filled as -1
| Pixel properties | Quadrant properties | ||||||
|---|---|---|---|---|---|---|---|
| Quadrant | DetID | PixID | Counts | Sigma | Mean | Median | Sigma |
| A | 7 | 192 | 25112 | 153.37 | 805 | 792 | 158.6 |
| A | 13 | 254 | 11903 | 70.07 | 805 | 792 | 158.6 |
| A | 14 | 239 | 8327 | 47.52 | 805 | 792 | 158.6 |
| B | 4 | 80 | 124144 | 854.35 | 779 | 762 | 144.4 |
| B | 15 | 36 | 34246 | 231.86 | 779 | 762 | 144.4 |
| B | 12 | 111 | 17107 | 113.18 | 779 | 762 | 144.4 |
| C | 14 | 238 | 155362 | 901.68 | 748 | 754 | 171.5 |
| C | 14 | 254 | 43963 | 252.0 | 748 | 754 | 171.5 |
| C | 13 | 61 | 5094 | 25.31 | 748 | 754 | 171.5 |
| D | 1 | 52 | 1046393 | 5855.73 | 765 | 745 | 178.6 |
| D | 8 | 195 | 578295 | 3234.33 | 765 | 745 | 178.6 |
| D | 12 | 233 | 126282 | 703.02 | 765 | 745 | 178.6 |
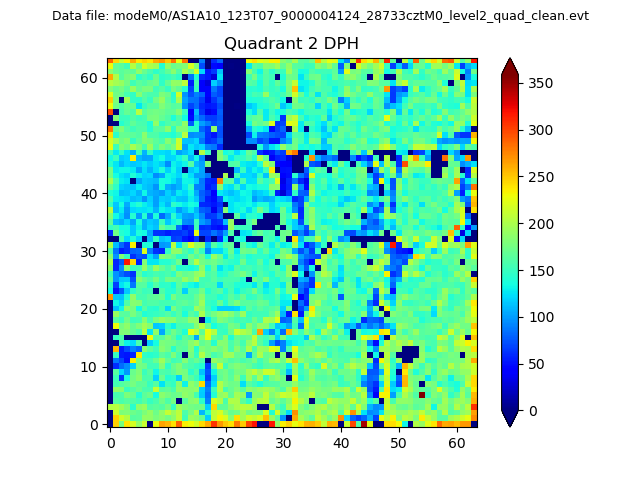
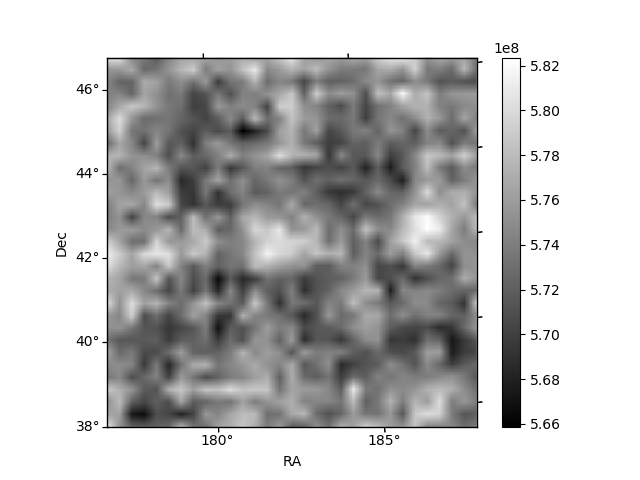
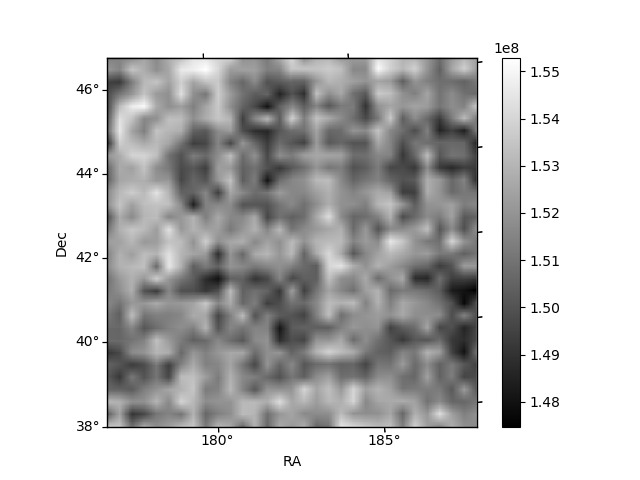
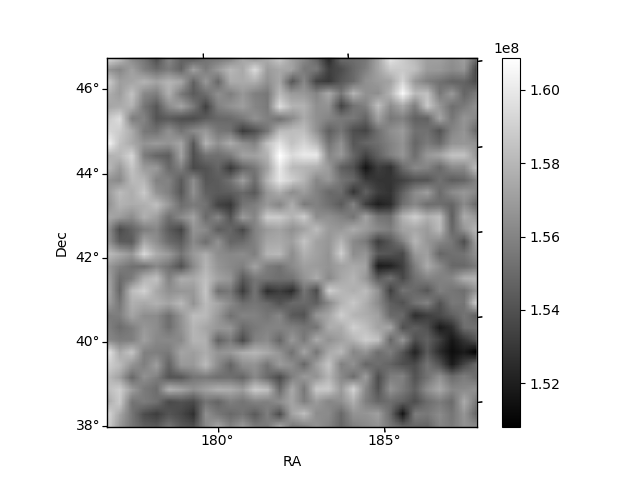
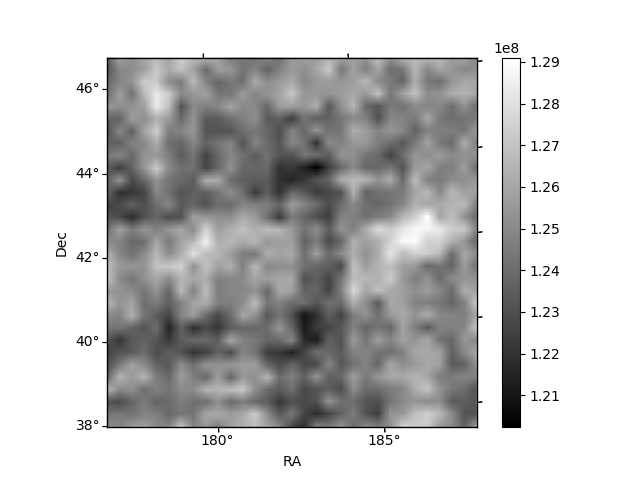
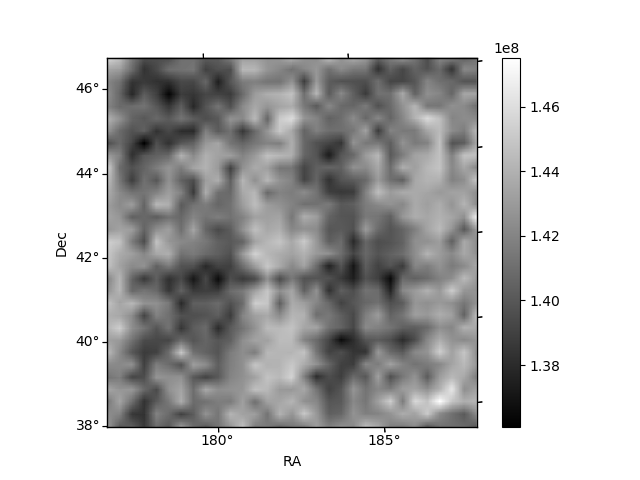
Histogram calculated using DETX and DETY for each event in the final _common_clean file
| Quadrant A | 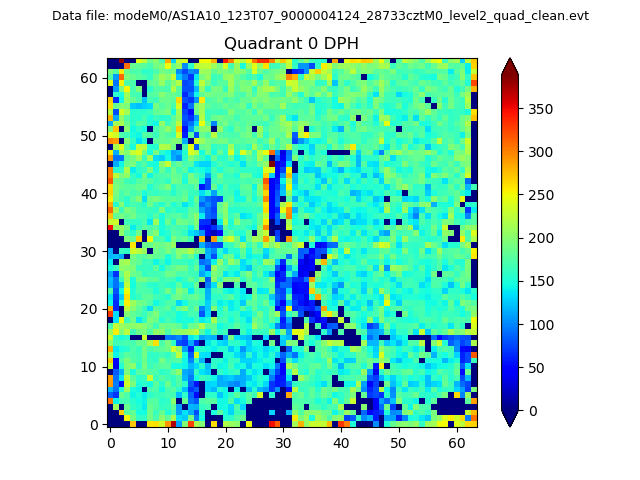 |
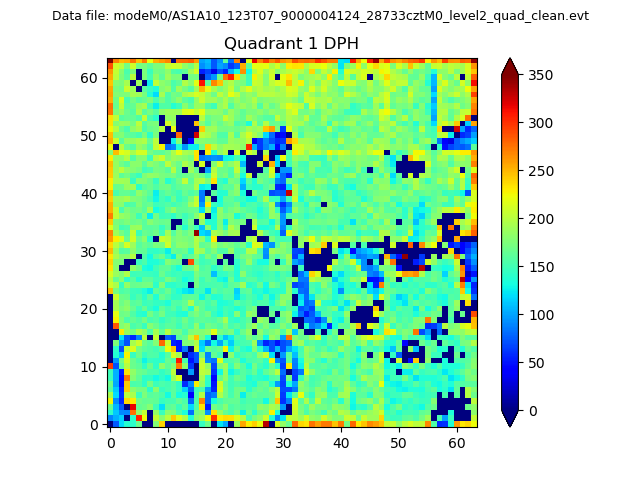 |
Quadrant B |
|---|---|---|---|
| Quadrant D | 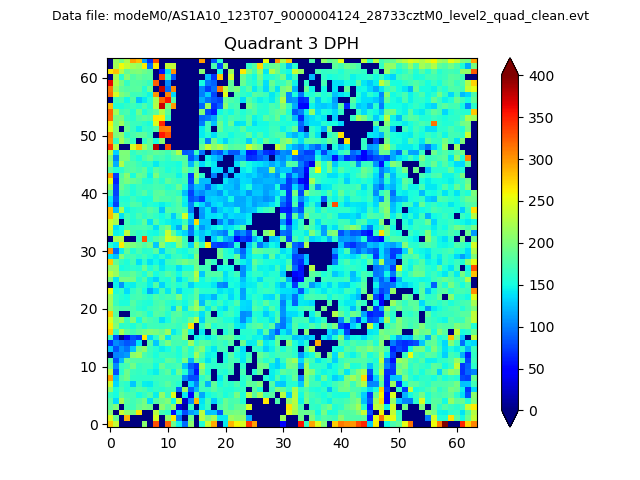 |
 |
Quadrant C |
| Plot type | Count rate plots | Images |
|---|---|---|
| Comparison with Poisson distribution Blue bars denote a histogram of data divided into 1 sec bins. Red curve is a Poisson curve with rate = median count rate of data. |
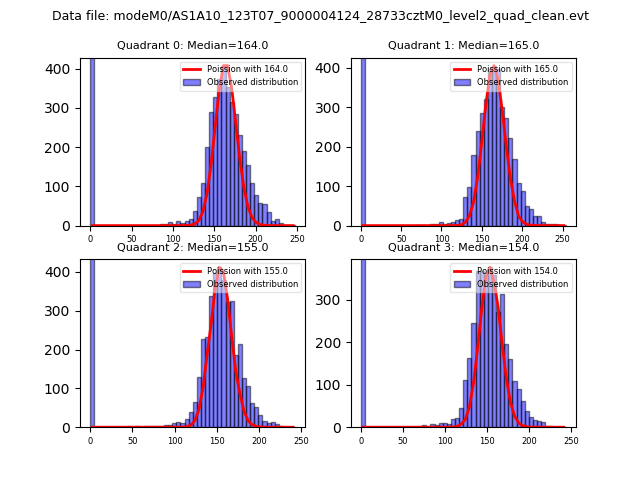 |
 |
| Quadrant-wise count rates Data is divided into 100 sec bins |
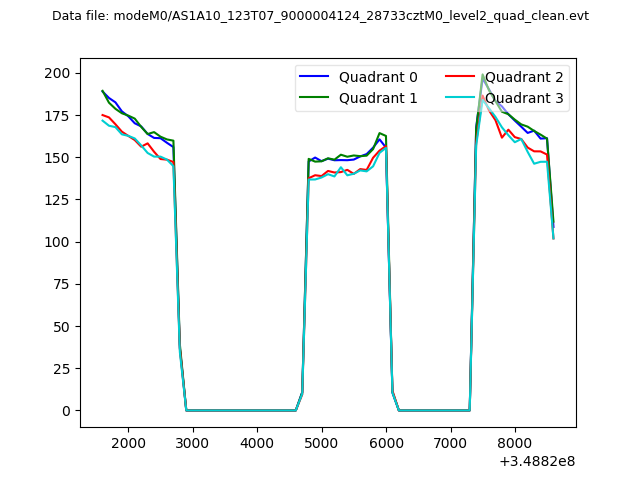 |
|
| Module-wise count rates for Quadrant A Data is divided into 100 sec bins |
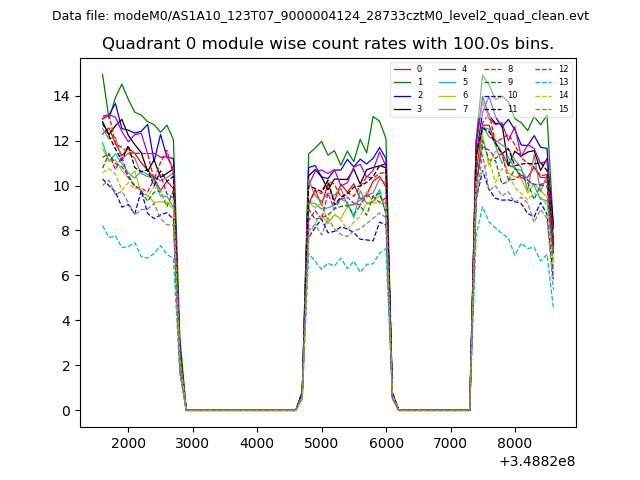 |
 |
| Module-wise count rates for Quadrant B Data is divided into 100 sec bins |
 |
 |
| Module-wise count rates for Quadrant C Data is divided into 100 sec bins |
 |
 |
| Module-wise count rates for Quadrant D Data is divided into 100 sec bins |
 |
 |
| Parameter | Plot |
|---|---|
| CZT HV Monitor | 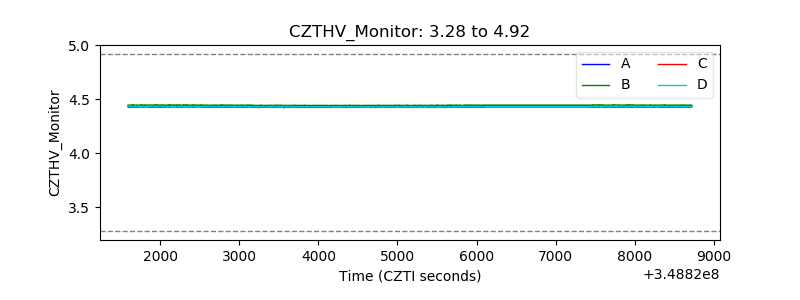 |
| D_VDD | 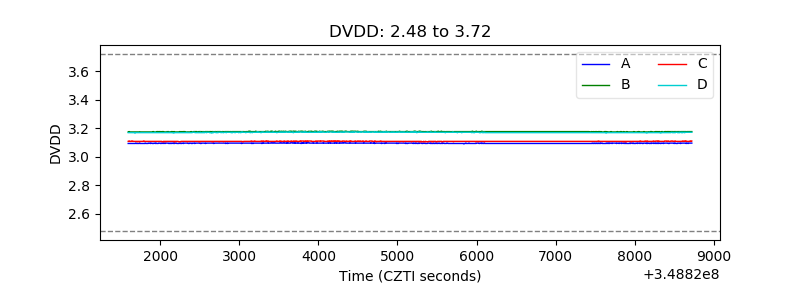 |
| Temperature 1 |  |
| Veto HV Monitor | 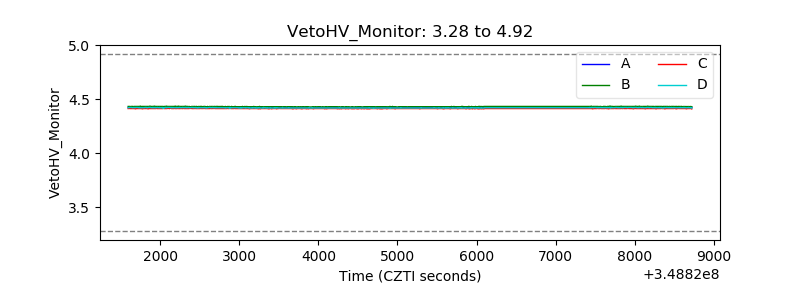 |
| Veto LLD | 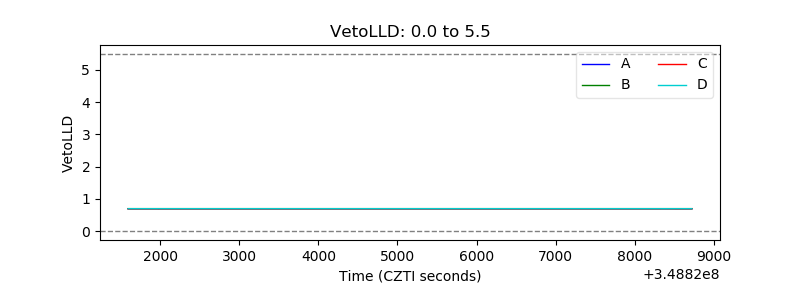 |
| Alpha Counter | 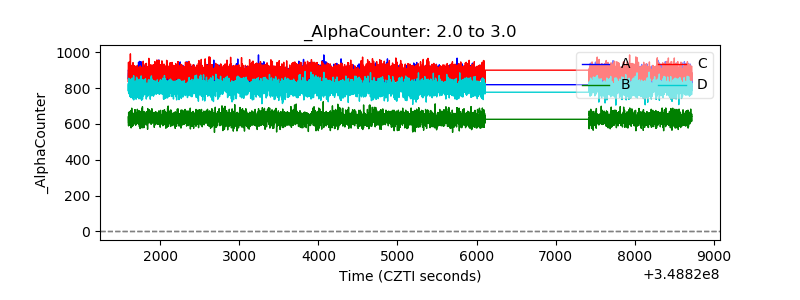 |
| _CPM_Rate | 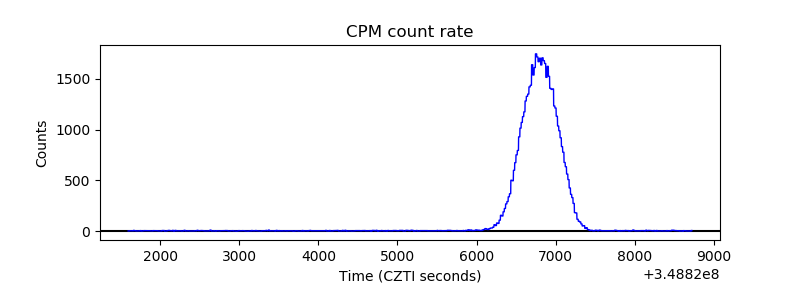 |
| CZT Counter | 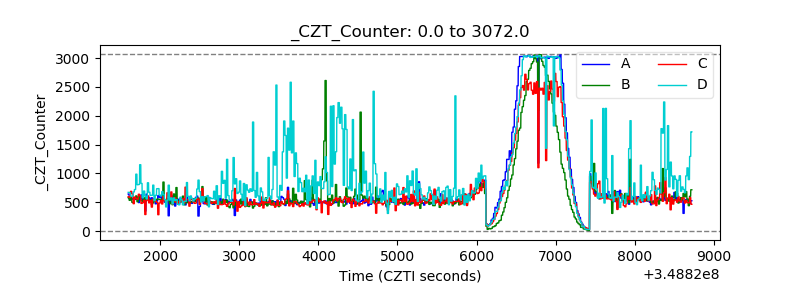 |
| +2.5 Volts monitor |  |
| +5 Volts monitor |  |
| _ROLL_ROT | 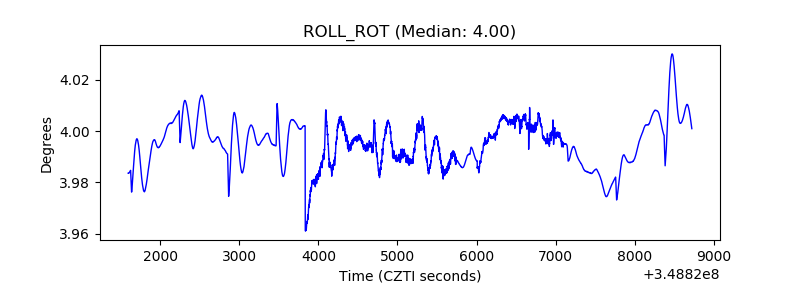 |
| _Roll_DEC | 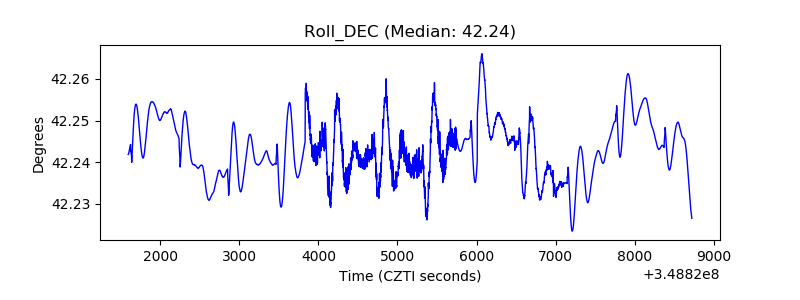 |
| _Roll_RA | 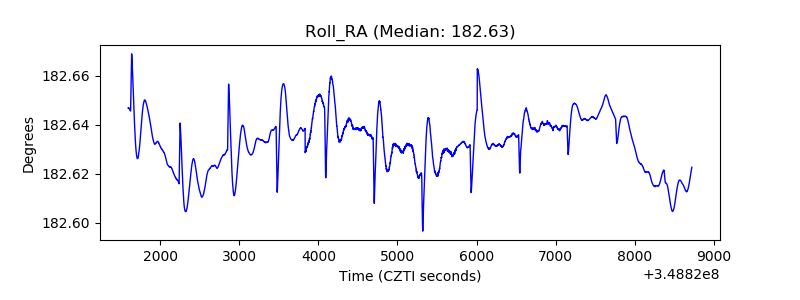 |
| Veto Counter | 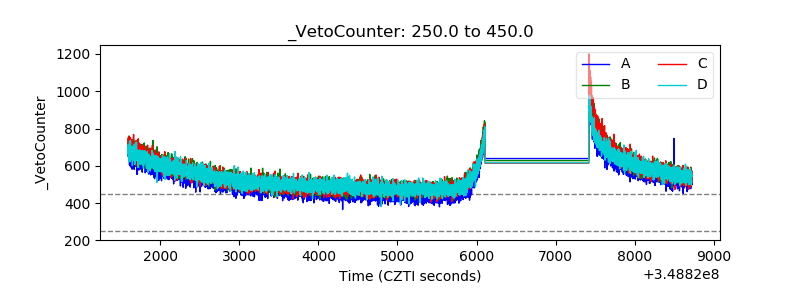 |