| Param | Original file | Final file |
|---|---|---|
| Filename | modeM0/AS1A10_123T07_9000004124_28735cztM0_level2.evt | modeM0/AS1A10_123T07_9000004124_28735cztM0_level2_quad_clean.evt |
| Size (bytes) | 677,511,360 | 77,610,240 |
| Size | 646.1 MB | 74.0 MB |
| Events in quadrant A | 5,863,488 | 469,342 |
| Events in quadrant B | 4,918,084 | 481,236 |
| Events in quadrant C | 3,317,674 | 472,368 |
| Events in quadrant D | 5,969,617 | 463,026 |
| Mode M9 | |||
|---|---|---|---|
| Quadrant | BADHDUFLAG | Total packets | Discarded packets |
| A | 0 | 10 | 0 |
| B | 0 | 10 | 0 |
| C | 0 | 10 | 0 |
| D | 0 | 10 | 0 |
| Mode M0 | |||
|---|---|---|---|
| Quadrant | BADHDUFLAG | Total packets | Discarded packets |
| A | 0 | 21505 | 1 |
| B | 0 | 18836 | 1 |
| C | 0 | 13694 | 1 |
| D | 0 | 22356 | 6 |
| Mode SS | |||
|---|---|---|---|
| Quadrant | BADHDUFLAG | Total packets | Discarded packets |
| A | 0 | 134 | 0 |
| B | 0 | 134 | 0 |
| C | 0 | 134 | 0 |
| D | 0 | 134 | 0 |
| Quadrant | Total seconds | Saturated seconds | Saturation percentage |
|---|---|---|---|
| A | 6656 | 894 | 13.431490% |
| B | 6657 | 463 | 6.955085% |
| C | 6657 | 146 | 2.193180% |
| D | 6656 | 385 | 5.784255% |
Noise dominated data is calculated using 1-second bins in cleaned event files. If a bin has >2000 counts, and if more than 50% of those come from <1% of pixels, then it is considered to be noise-dominated and hence unusable.
| Quadrant | # 1 sec bins | Bins with >0 counts | Bins with >2000 counts | High rate bins dominated by noise | Noise dominated (total time) | Noise dominated (detector-on time) | Marked lightcurve |
|---|---|---|---|---|---|---|---|
| A | 7616 | 6656 | 757 | 757 | 9.94% | 11.37% | 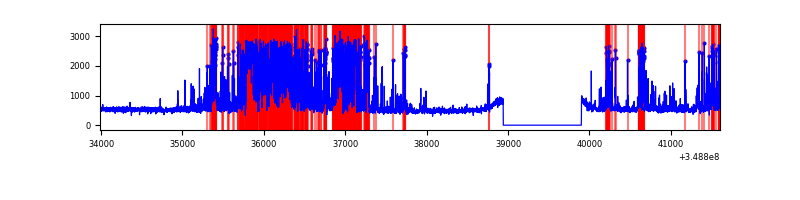 |
| B | 7617 | 6657 | 283 | 283 | 3.72% | 4.25% |  |
| C | 7617 | 6657 | 0 | 0 | 0.00% | 0.00% | 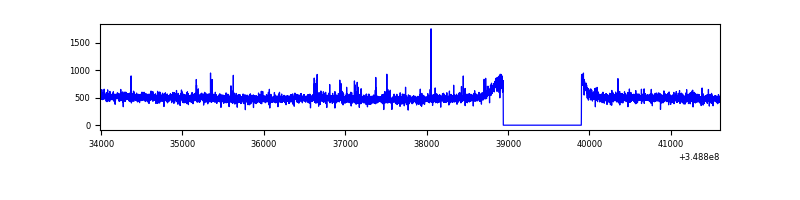 |
| D | 7616 | 6656 | 340 | 340 | 4.46% | 5.11% | 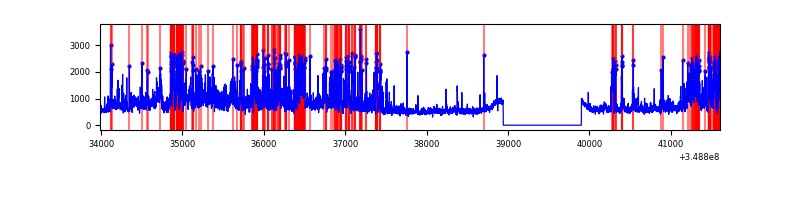 |
Top three noisy pixels from each quadrant. If the there are fewer than three noisy pixels in the level2.evt file, extra rows are filled as -1
| Pixel properties | Quadrant properties | ||||||
|---|---|---|---|---|---|---|---|
| Quadrant | DetID | PixID | Counts | Sigma | Mean | Median | Sigma |
| A | 14 | 239 | 2713101 | 16601.22 | 811 | 792 | 163.4 |
| A | 13 | 254 | 11972 | 68.43 | 811 | 792 | 163.4 |
| A | 5 | 98 | 11220 | 63.83 | 811 | 792 | 163.4 |
| B | 5 | 255 | 1625988 | 10363.76 | 823 | 804 | 156.8 |
| B | 4 | 80 | 21973 | 134.99 | 823 | 804 | 156.8 |
| B | 12 | 111 | 18361 | 111.96 | 823 | 804 | 156.8 |
| C | 14 | 238 | 142730 | 762.04 | 809 | 816 | 186.2 |
| C | 14 | 254 | 14660 | 74.34 | 809 | 816 | 186.2 |
| C | 13 | 61 | 5584 | 25.6 | 809 | 816 | 186.2 |
| D | 8 | 195 | 1468084 | 7568.29 | 816 | 795 | 193.9 |
| D | 1 | 52 | 906104 | 4669.59 | 816 | 795 | 193.9 |
| D | 12 | 233 | 351190 | 1807.34 | 816 | 795 | 193.9 |
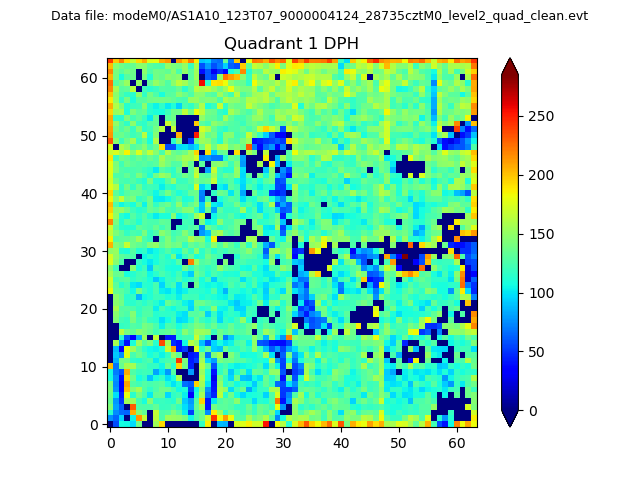
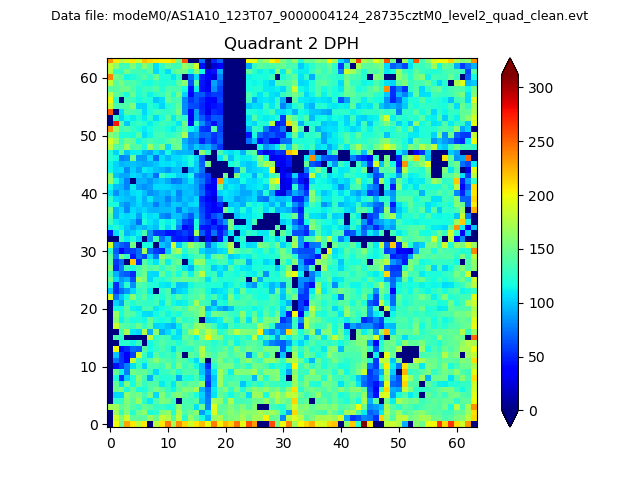
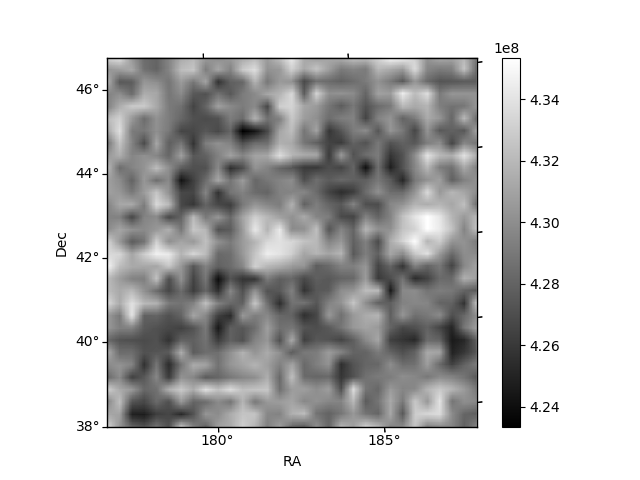
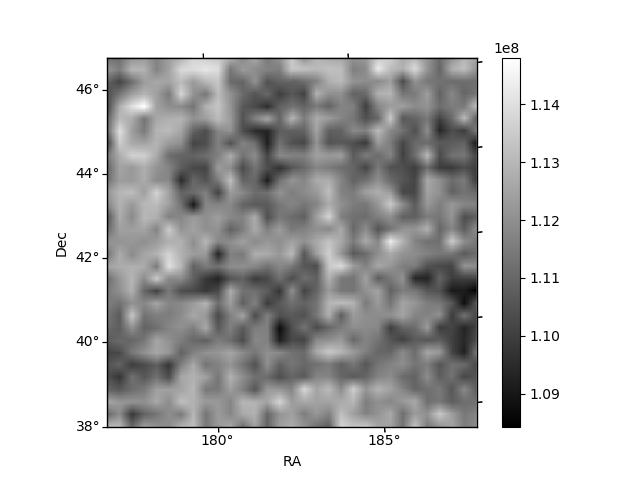
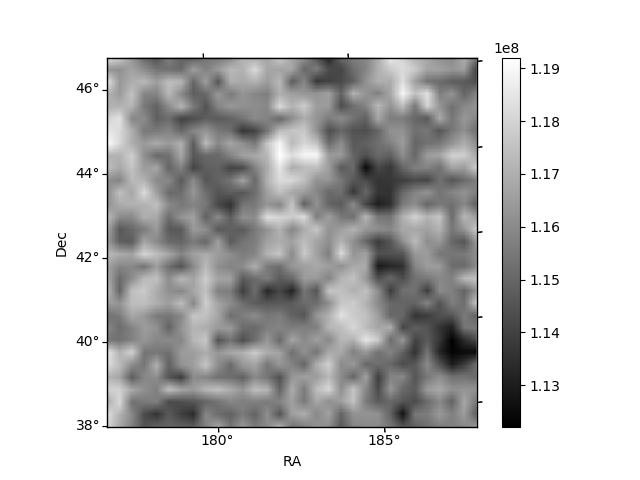
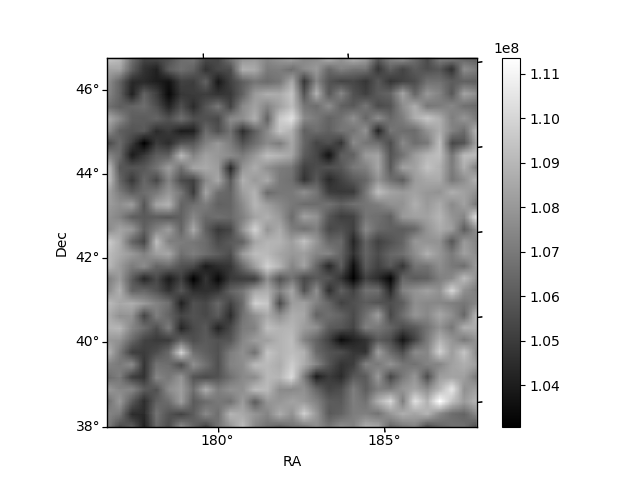
Histogram calculated using DETX and DETY for each event in the final _common_clean file
| Quadrant A | 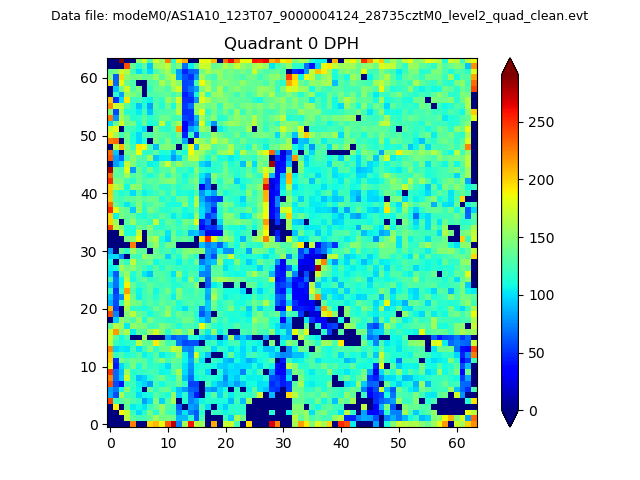 |
 |
Quadrant B |
|---|---|---|---|
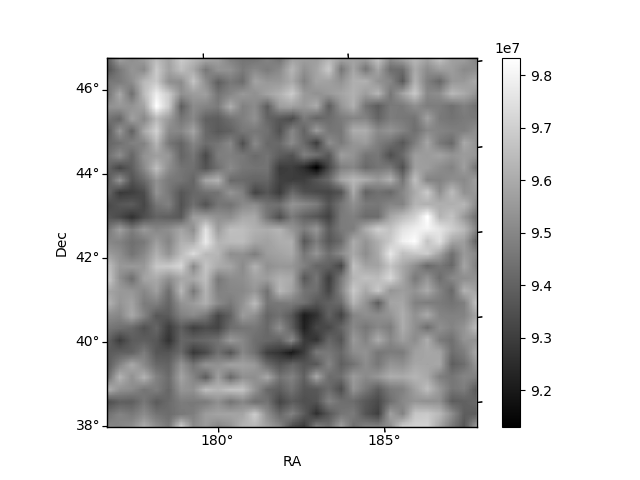
| Quadrant D | 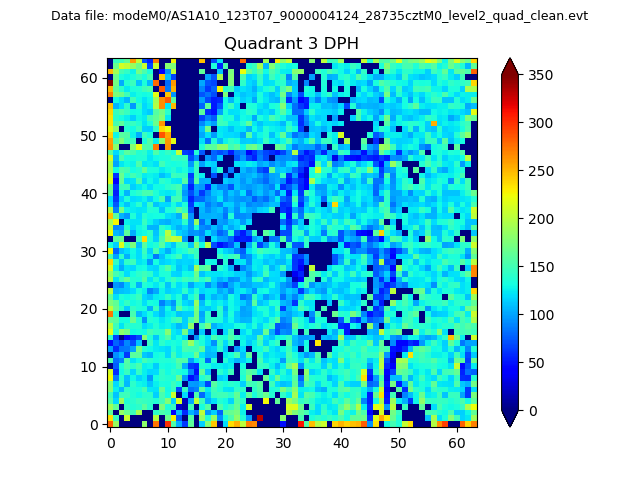 |
 |
Quadrant C |
| Plot type | Count rate plots | Images |
|---|---|---|
| Comparison with Poisson distribution Blue bars denote a histogram of data divided into 1 sec bins. Red curve is a Poisson curve with rate = median count rate of data. |
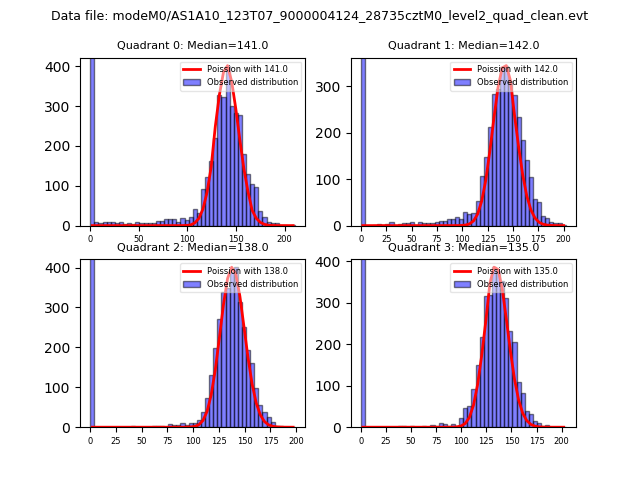 |
 |
| Quadrant-wise count rates Data is divided into 100 sec bins |
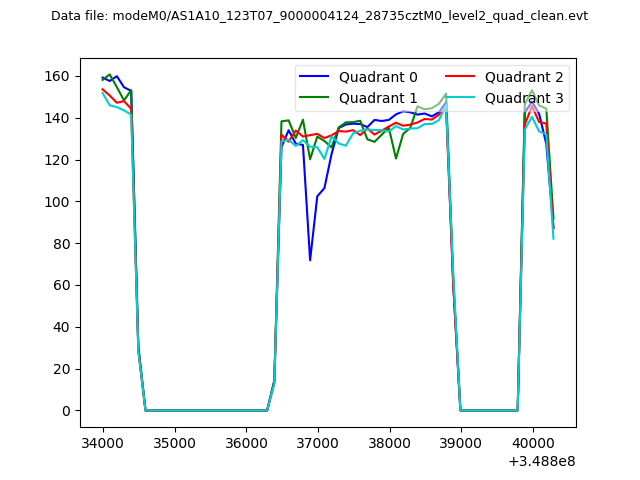 |
|
| Module-wise count rates for Quadrant A Data is divided into 100 sec bins |
 |
 |
| Module-wise count rates for Quadrant B Data is divided into 100 sec bins |
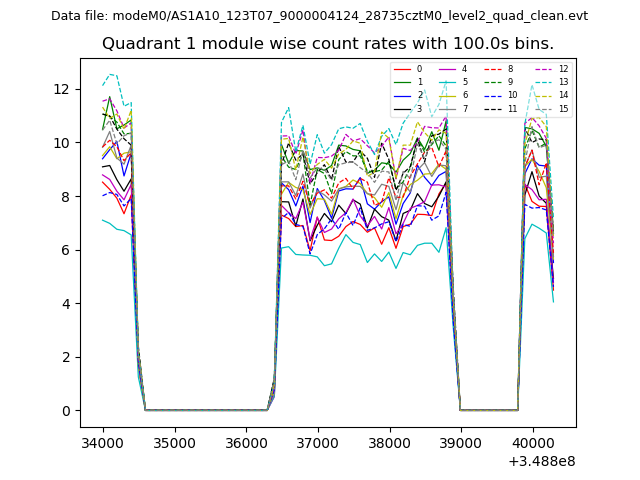 |
 |
| Module-wise count rates for Quadrant C Data is divided into 100 sec bins |
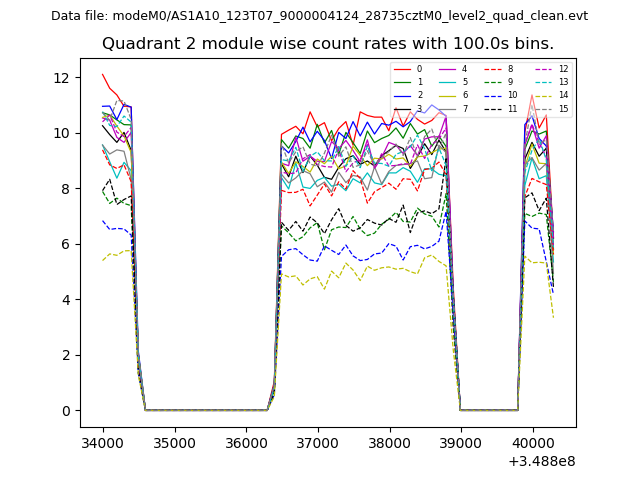 |
 |
| Module-wise count rates for Quadrant D Data is divided into 100 sec bins |
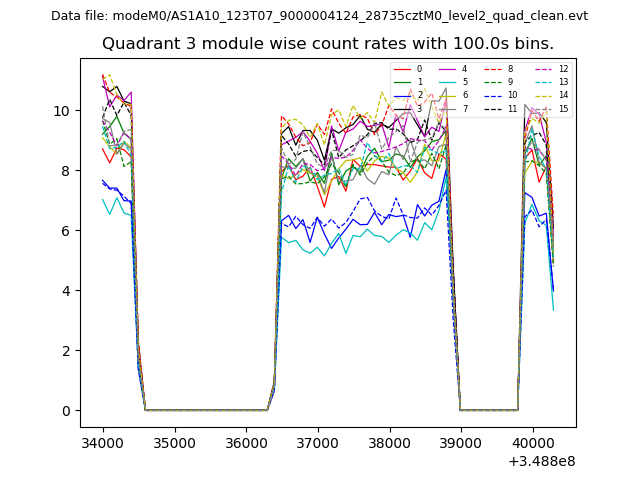 |
 |
| Parameter | Plot |
|---|---|
| CZT HV Monitor | 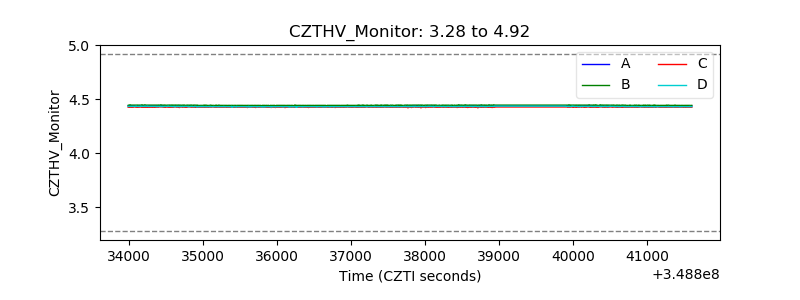 |
| D_VDD |  |
| Temperature 1 | 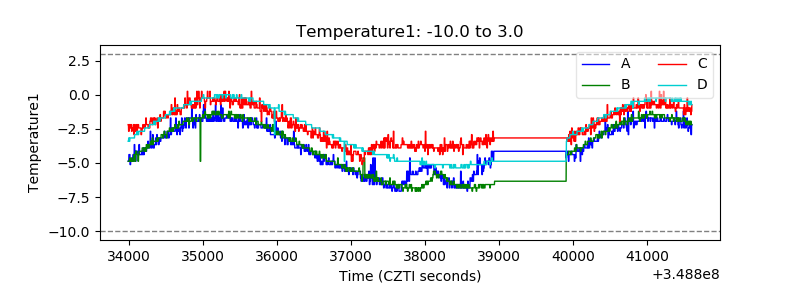 |
| Veto HV Monitor | 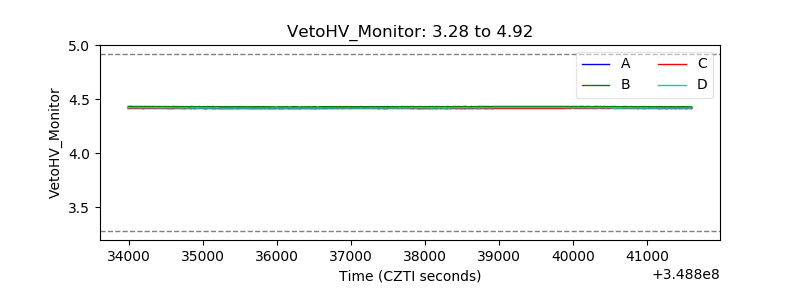 |
| Veto LLD |  |
| Alpha Counter | 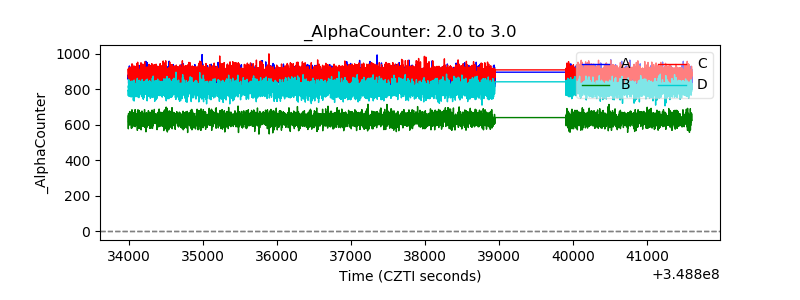 |
| _CPM_Rate | 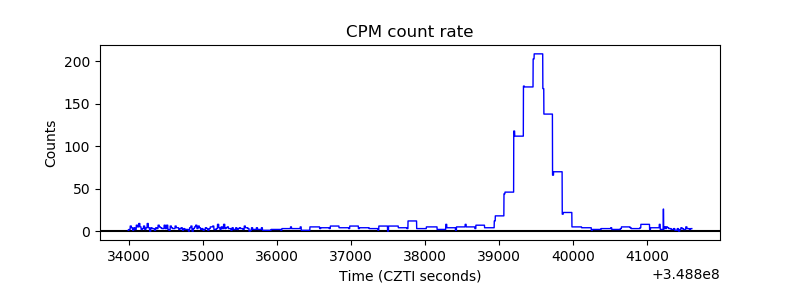 |
| CZT Counter | 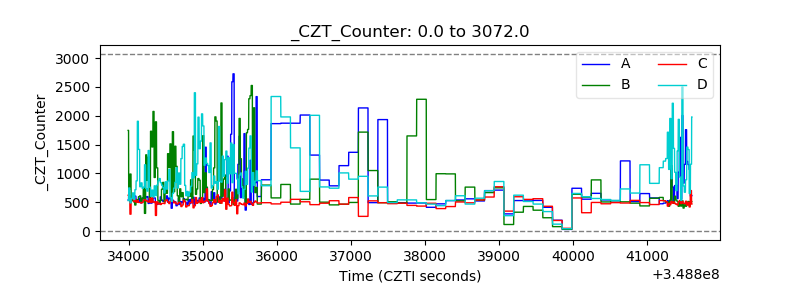 |
| +2.5 Volts monitor |  |
| +5 Volts monitor | 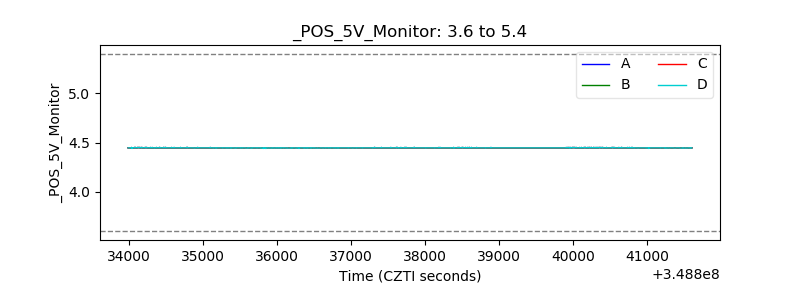 |
| _ROLL_ROT | 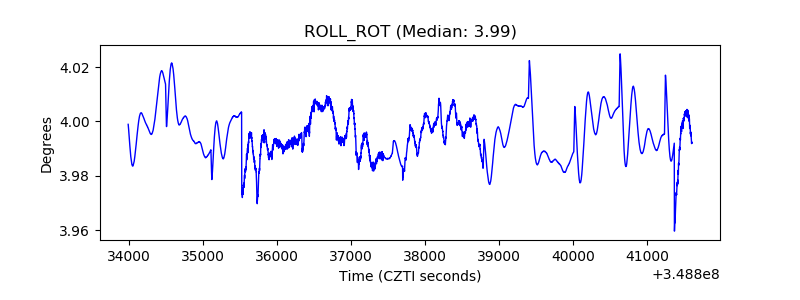 |
| _Roll_DEC | 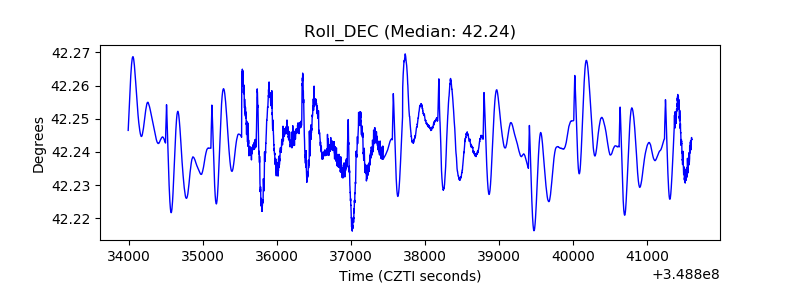 |
| _Roll_RA | 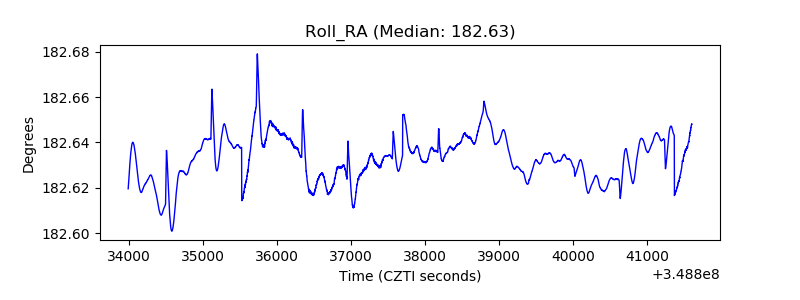 |
| Veto Counter | 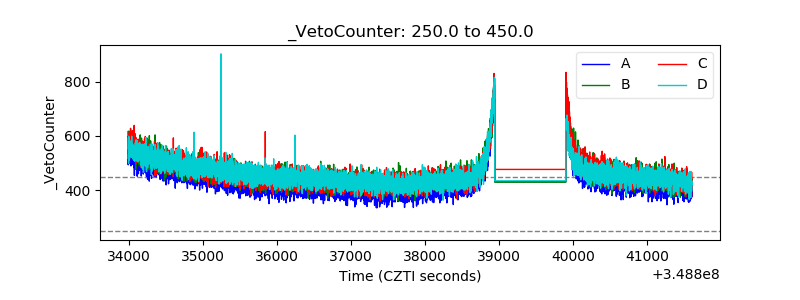 |