| Param | Original file | Final file |
|---|---|---|
| Filename | modeM0/AS1A10_123T07_9000004124_28737cztM0_level2.evt | modeM0/AS1A10_123T07_9000004124_28737cztM0_level2_quad_clean.evt |
| Size (bytes) | 655,971,840 | 81,017,280 |
| Size | 625.6 MB | 77.3 MB |
| Events in quadrant A | 5,043,760 | 498,979 |
| Events in quadrant B | 3,592,690 | 503,880 |
| Events in quadrant C | 4,857,683 | 482,443 |
| Events in quadrant D | 5,893,234 | 475,381 |
| Mode M9 | |||
|---|---|---|---|
| Quadrant | BADHDUFLAG | Total packets | Discarded packets |
| A | 0 | 1 | 0 |
| B | 0 | 1 | 0 |
| C | 0 | 1 | 0 |
| D | 0 | 1 | 0 |
| Mode M0 | |||
|---|---|---|---|
| Quadrant | BADHDUFLAG | Total packets | Discarded packets |
| A | 0 | 19733 | 2 |
| B | 0 | 15225 | 2 |
| C | 0 | 19518 | 2 |
| D | 0 | 22394 | 2 |
| Mode SS | |||
|---|---|---|---|
| Quadrant | BADHDUFLAG | Total packets | Discarded packets |
| A | 0 | 144 | 0 |
| B | 0 | 144 | 0 |
| C | 0 | 144 | 0 |
| D | 0 | 144 | 0 |
| Quadrant | Total seconds | Saturated seconds | Saturation percentage |
|---|---|---|---|
| A | 7071 | 671 | 9.489464% |
| B | 7072 | 197 | 2.785633% |
| C | 7072 | 512 | 7.239819% |
| D | 7071 | 555 | 7.848961% |
Noise dominated data is calculated using 1-second bins in cleaned event files. If a bin has >2000 counts, and if more than 50% of those come from <1% of pixels, then it is considered to be noise-dominated and hence unusable.
| Quadrant | # 1 sec bins | Bins with >0 counts | Bins with >2000 counts | High rate bins dominated by noise | Noise dominated (total time) | Noise dominated (detector-on time) | Marked lightcurve |
|---|---|---|---|---|---|---|---|
| A | 7216 | 7072 | 417 | 417 | 5.78% | 5.90% | 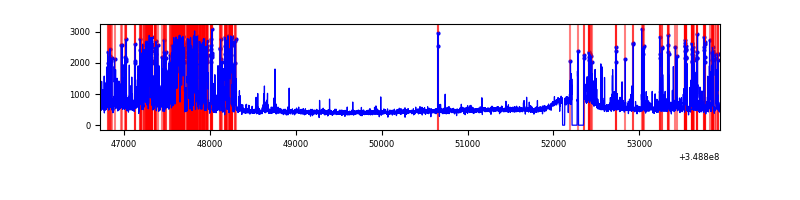 |
| B | 7217 | 7072 | 4 | 4 | 0.06% | 0.06% | 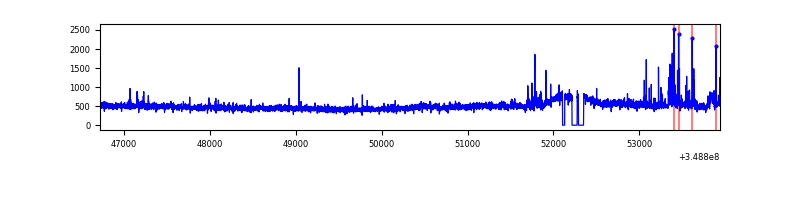 |
| C | 7217 | 7072 | 2 | 2 | 0.03% | 0.03% | 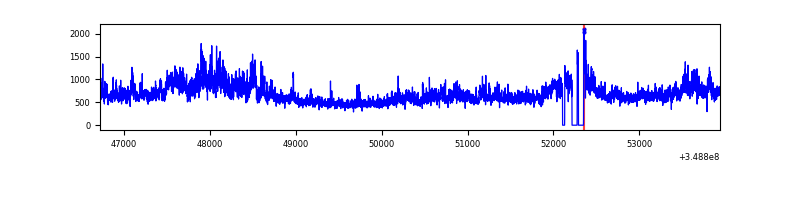 |
| D | 7216 | 7072 | 385 | 385 | 5.34% | 5.44% |  |
Top three noisy pixels from each quadrant. If the there are fewer than three noisy pixels in the level2.evt file, extra rows are filled as -1
| Pixel properties | Quadrant properties | ||||||
|---|---|---|---|---|---|---|---|
| Quadrant | DetID | PixID | Counts | Sigma | Mean | Median | Sigma |
| A | 14 | 239 | 1752641 | 10174.91 | 850 | 831 | 172.2 |
| A | 13 | 254 | 14106 | 77.1 | 850 | 831 | 172.2 |
| A | 3 | 137 | 8216 | 42.89 | 850 | 831 | 172.2 |
| B | 5 | 255 | 104603 | 627.21 | 863 | 841 | 165.4 |
| B | 0 | 229 | 37725 | 222.95 | 863 | 841 | 165.4 |
| B | 4 | 80 | 32045 | 188.62 | 863 | 841 | 165.4 |
| C | 3 | 233 | 1389883 | 7265.04 | 818 | 819 | 191.2 |
| C | 14 | 238 | 191391 | 996.72 | 818 | 819 | 191.2 |
| C | 14 | 254 | 89847 | 465.63 | 818 | 819 | 191.2 |
| D | 1 | 52 | 1092046 | 5357.92 | 839 | 813 | 203.7 |
| D | 8 | 195 | 926458 | 4544.89 | 839 | 813 | 203.7 |
| D | 12 | 233 | 647345 | 3174.45 | 839 | 813 | 203.7 |
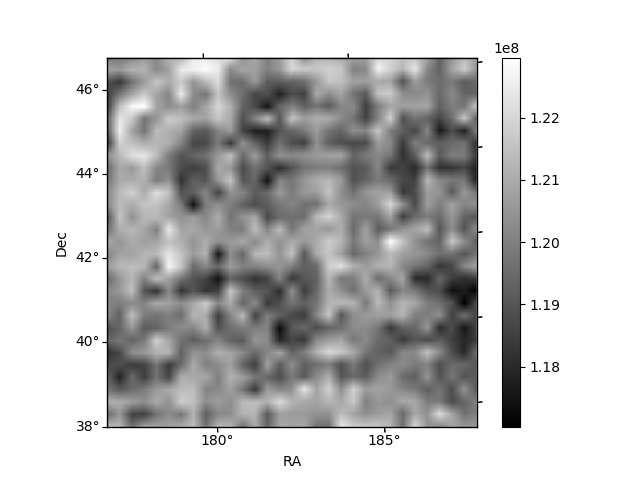
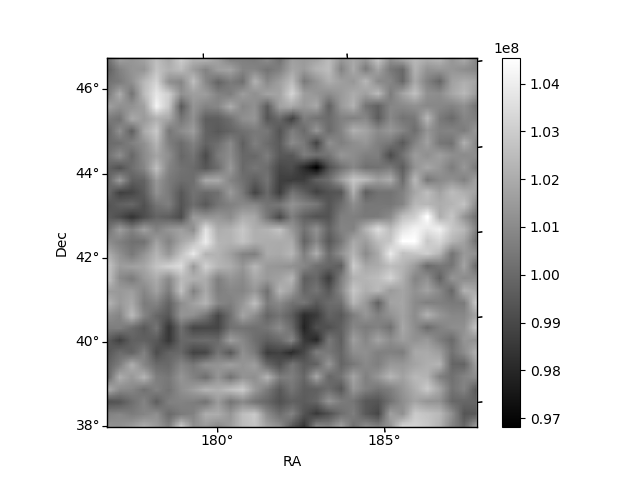
Histogram calculated using DETX and DETY for each event in the final _common_clean file
| Quadrant A | 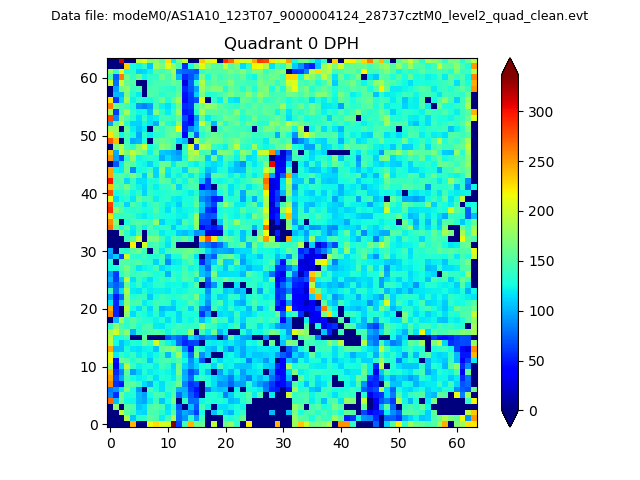 |
 |
Quadrant B |
|---|---|---|---|
| Quadrant D |  |
 |
Quadrant C |
| Plot type | Count rate plots | Images |
|---|---|---|
| Comparison with Poisson distribution Blue bars denote a histogram of data divided into 1 sec bins. Red curve is a Poisson curve with rate = median count rate of data. |
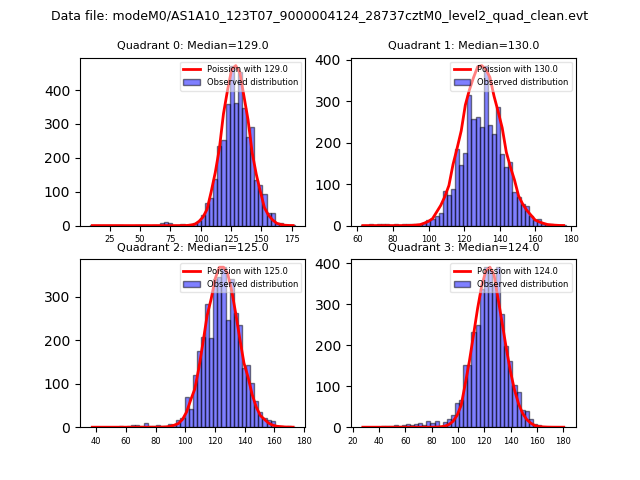 |
 |
| Quadrant-wise count rates Data is divided into 100 sec bins |
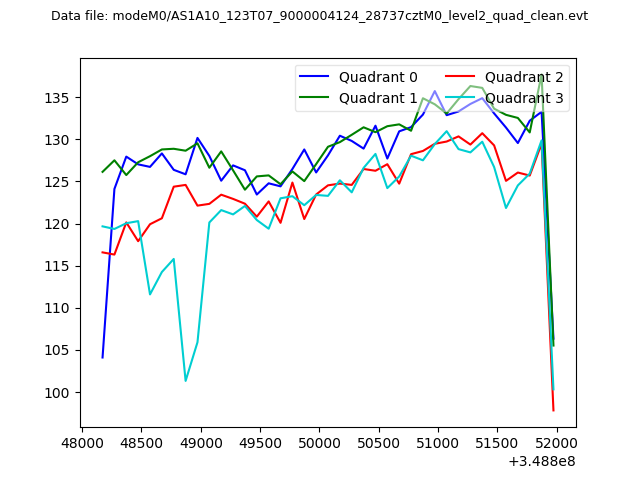 |
|
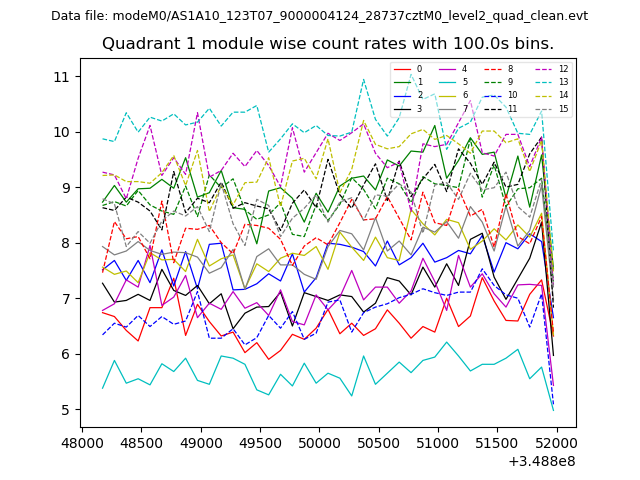
| Module-wise count rates for Quadrant A Data is divided into 100 sec bins |
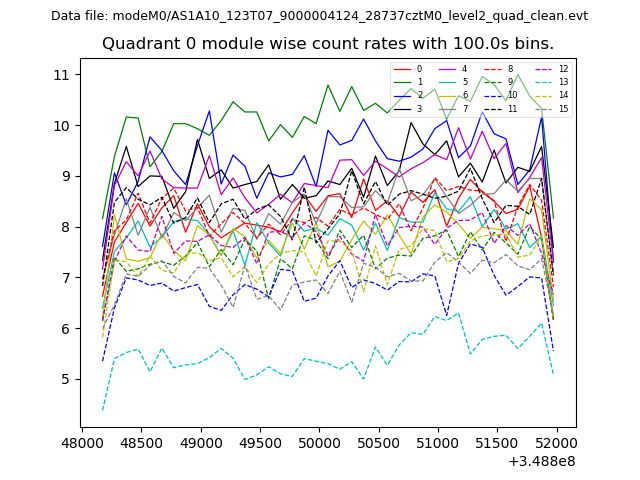 |
 |
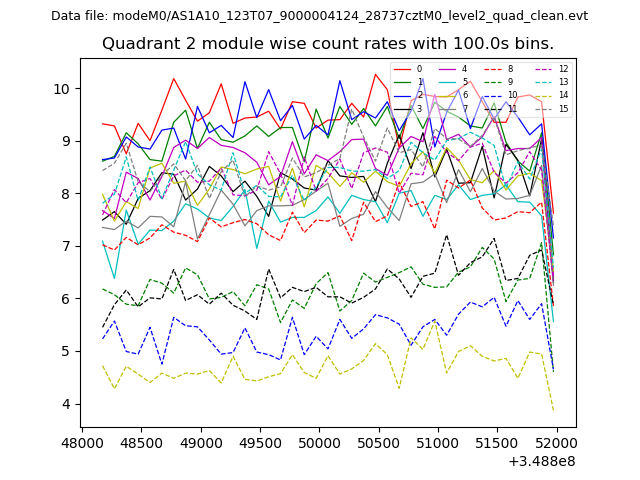
| Module-wise count rates for Quadrant B Data is divided into 100 sec bins |
 |
 |
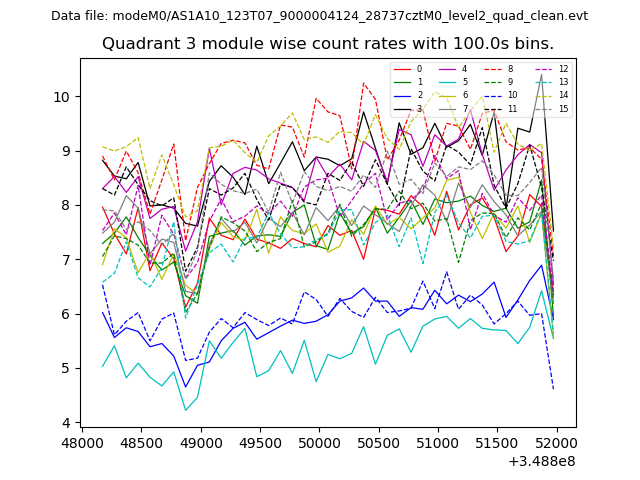
| Module-wise count rates for Quadrant C Data is divided into 100 sec bins |
 |
 |
| Module-wise count rates for Quadrant D Data is divided into 100 sec bins |
 |
 |
| Parameter | Plot |
|---|---|
| CZT HV Monitor | 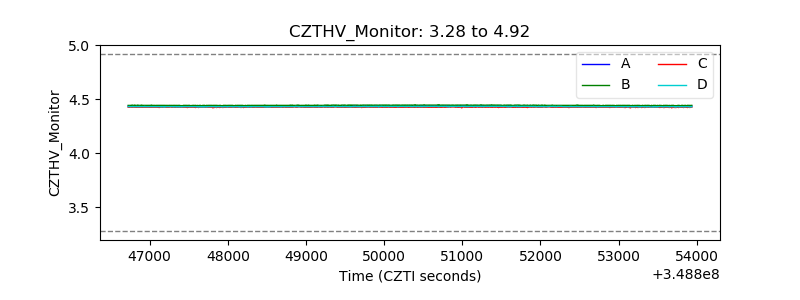 |
| D_VDD | 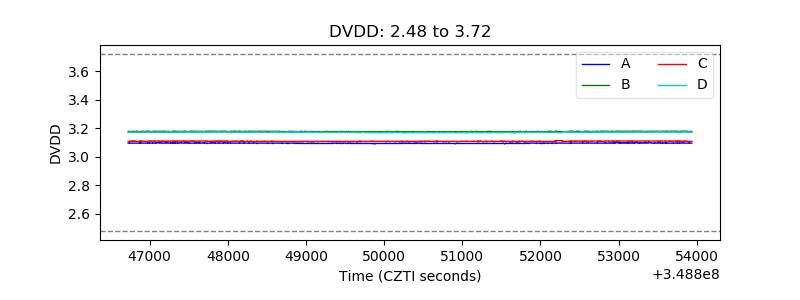 |
| Temperature 1 |  |
| Veto HV Monitor | 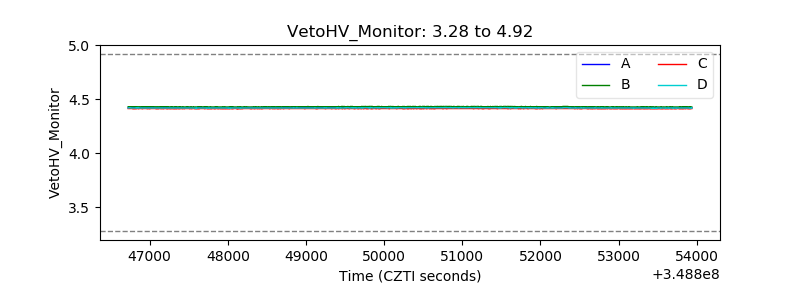 |
| Veto LLD | 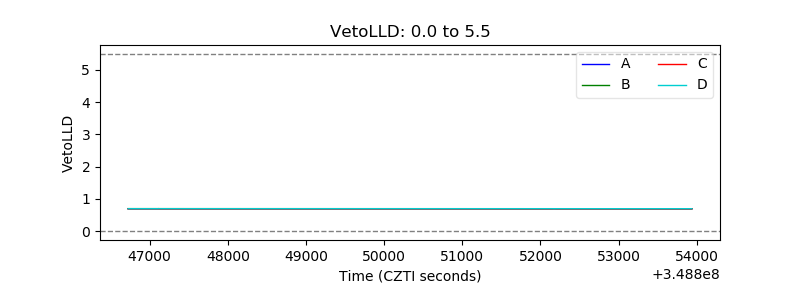 |
| Alpha Counter | 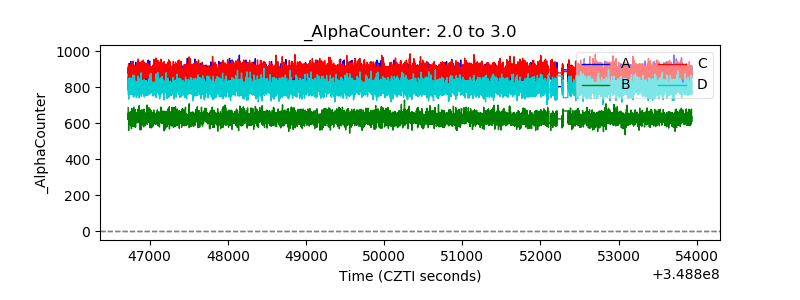 |
| _CPM_Rate | 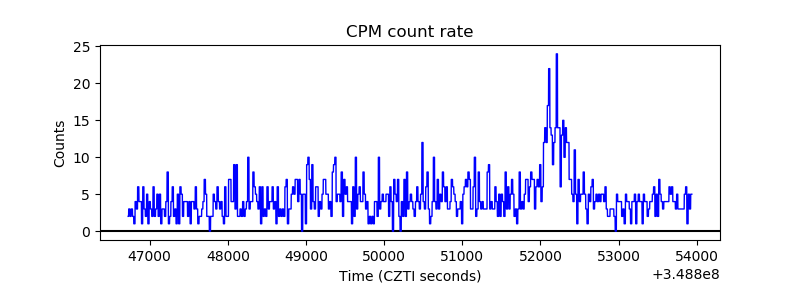 |
| CZT Counter |  |
| +2.5 Volts monitor |  |
| +5 Volts monitor |  |
| _ROLL_ROT | 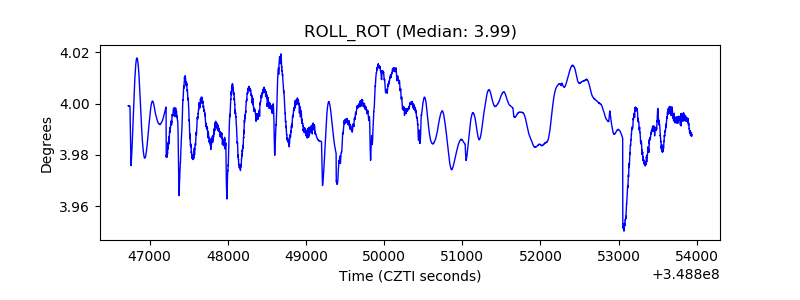 |
| _Roll_DEC | 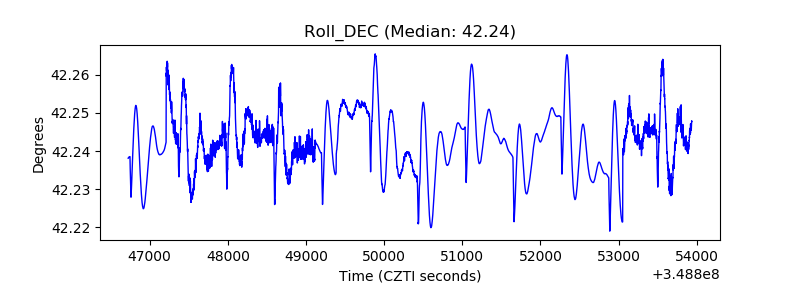 |
| _Roll_RA |  |
| Veto Counter | 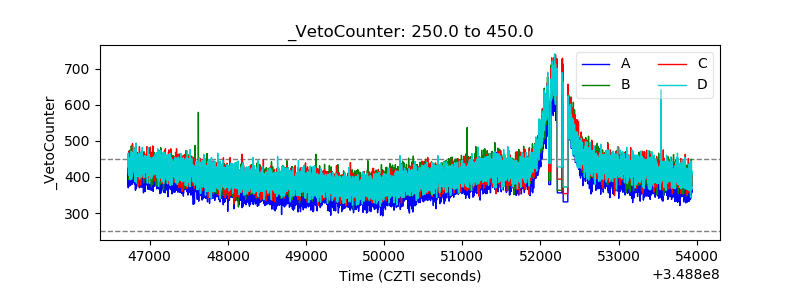 |