| Param | Original file | Final file |
|---|---|---|
| Filename | modeM0/AS1A10_123T07_9000004124_28738cztM0_level2.evt | modeM0/AS1A10_123T07_9000004124_28738cztM0_level2_quad_clean.evt |
| Size (bytes) | 718,162,560 | 88,778,880 |
| Size | 684.9 MB | 84.7 MB |
| Events in quadrant A | 4,682,587 | 544,284 |
| Events in quadrant B | 4,693,946 | 547,954 |
| Events in quadrant C | 5,188,910 | 526,247 |
| Events in quadrant D | 6,651,462 | 522,289 |
| Mode M9 | |||
|---|---|---|---|
| Quadrant | BADHDUFLAG | Total packets | Discarded packets |
| A | 0 | 3 | 0 |
| B | 0 | 3 | 0 |
| C | 0 | 3 | 0 |
| D | 0 | 3 | 0 |
| Mode M0 | |||
|---|---|---|---|
| Quadrant | BADHDUFLAG | Total packets | Discarded packets |
| A | 0 | 19115 | 3 |
| B | 0 | 19117 | 3 |
| C | 0 | 20976 | 5 |
| D | 0 | 25165 | 3 |
| Mode SS | |||
|---|---|---|---|
| Quadrant | BADHDUFLAG | Total packets | Discarded packets |
| A | 0 | 164 | 0 |
| B | 0 | 164 | 0 |
| C | 0 | 164 | 0 |
| D | 0 | 164 | 0 |
| Quadrant | Total seconds | Saturated seconds | Saturation percentage |
|---|---|---|---|
| A | 7869 | 461 | 5.858432% |
| B | 7870 | 404 | 5.133418% |
| C | 7869 | 529 | 6.722582% |
| D | 7869 | 579 | 7.357987% |
Noise dominated data is calculated using 1-second bins in cleaned event files. If a bin has >2000 counts, and if more than 50% of those come from <1% of pixels, then it is considered to be noise-dominated and hence unusable.
| Quadrant | # 1 sec bins | Bins with >0 counts | Bins with >2000 counts | High rate bins dominated by noise | Noise dominated (total time) | Noise dominated (detector-on time) | Marked lightcurve |
|---|---|---|---|---|---|---|---|
| A | 8269 | 7870 | 171 | 171 | 2.07% | 2.17% | 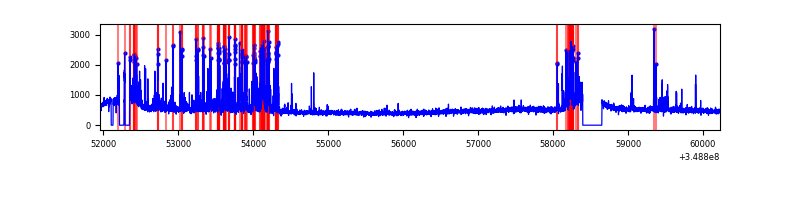 |
| B | 8270 | 7870 | 80 | 80 | 0.97% | 1.02% | 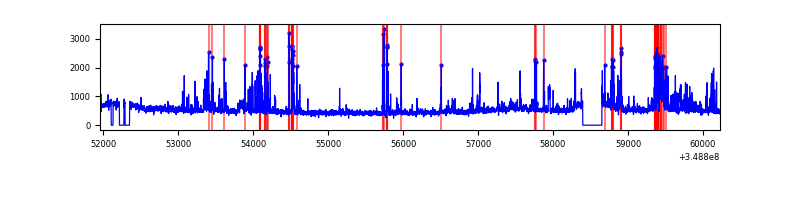 |
| C | 8269 | 7869 | 3 | 3 | 0.04% | 0.04% | 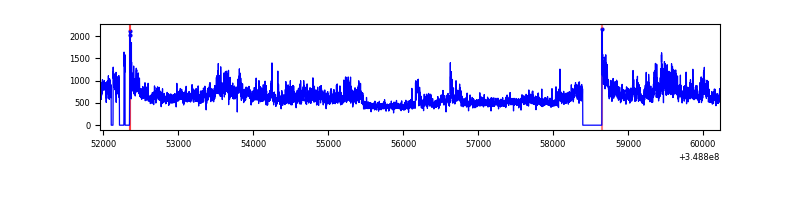 |
| D | 8269 | 7871 | 277 | 277 | 3.35% | 3.52% | 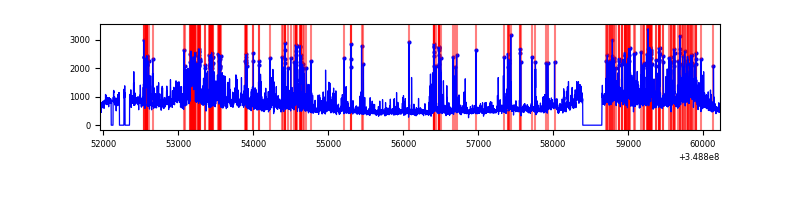 |
Top three noisy pixels from each quadrant. If the there are fewer than three noisy pixels in the level2.evt file, extra rows are filled as -1
| Pixel properties | Quadrant properties | ||||||
|---|---|---|---|---|---|---|---|
| Quadrant | DetID | PixID | Counts | Sigma | Mean | Median | Sigma |
| A | 14 | 239 | 916865 | 4627.43 | 973 | 950 | 197.9 |
| A | 13 | 254 | 16144 | 76.76 | 973 | 950 | 197.9 |
| A | 3 | 137 | 9779 | 44.61 | 973 | 950 | 197.9 |
| B | 5 | 255 | 476483 | 2563.56 | 968 | 943 | 185.5 |
| B | 10 | 245 | 291754 | 1567.72 | 968 | 943 | 185.5 |
| B | 4 | 80 | 50675 | 268.1 | 968 | 943 | 185.5 |
| C | 3 | 233 | 1348933 | 6249.77 | 924 | 928 | 215.7 |
| C | 14 | 238 | 181324 | 836.37 | 924 | 928 | 215.7 |
| C | 14 | 254 | 50962 | 231.97 | 924 | 928 | 215.7 |
| D | 8 | 195 | 1423758 | 6272.65 | 946 | 918 | 226.8 |
| D | 1 | 52 | 969173 | 4268.59 | 946 | 918 | 226.8 |
| D | 12 | 233 | 290437 | 1276.36 | 946 | 918 | 226.8 |
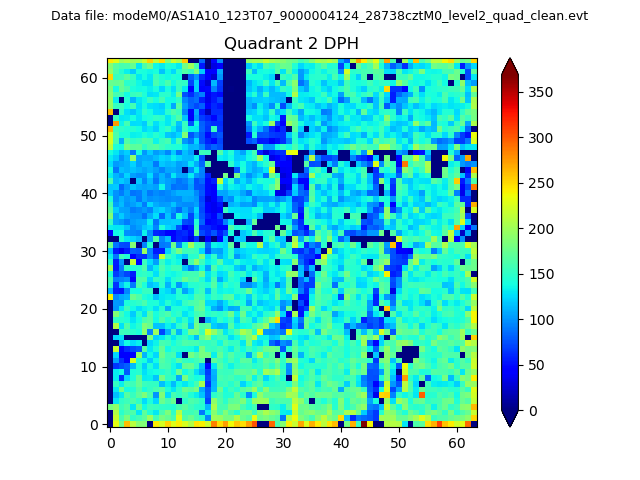
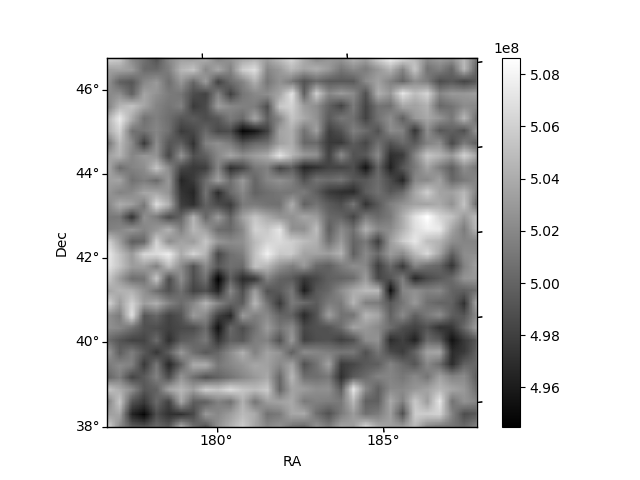
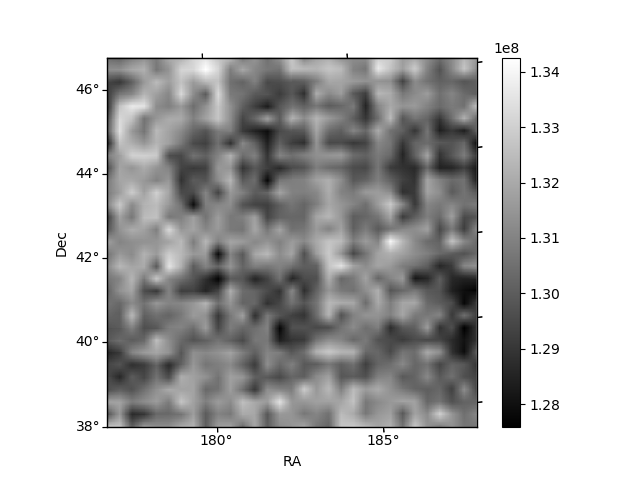
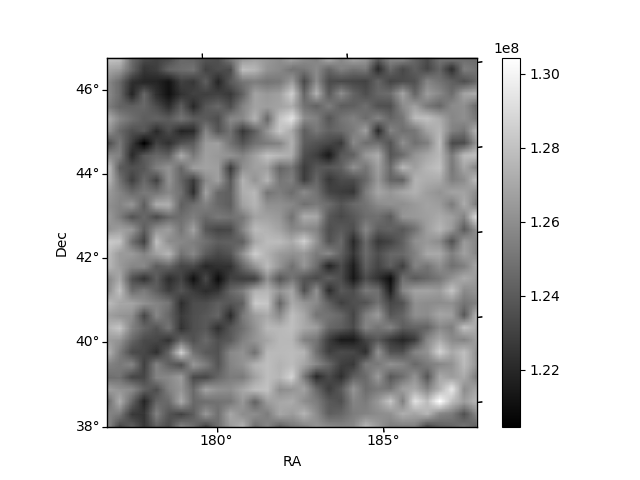
Histogram calculated using DETX and DETY for each event in the final _common_clean file
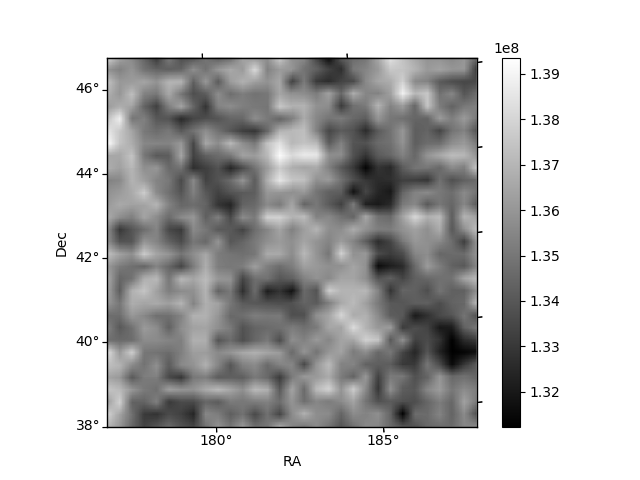
| Quadrant A | 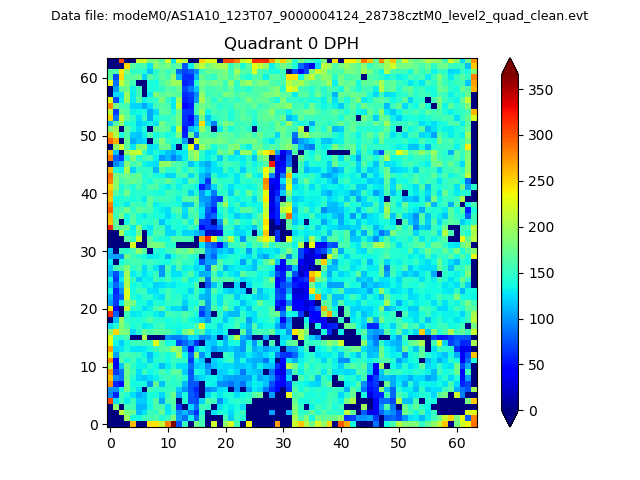 |
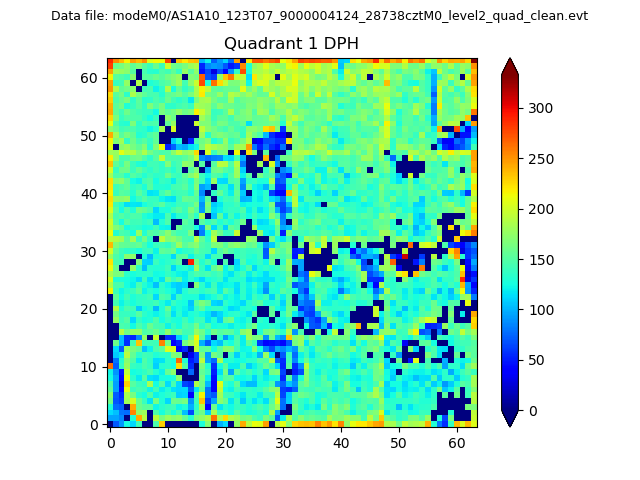 |
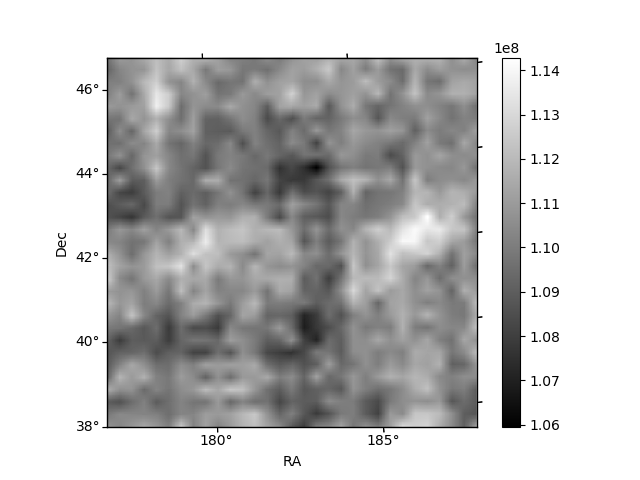
Quadrant B |
|---|---|---|---|
| Quadrant D | 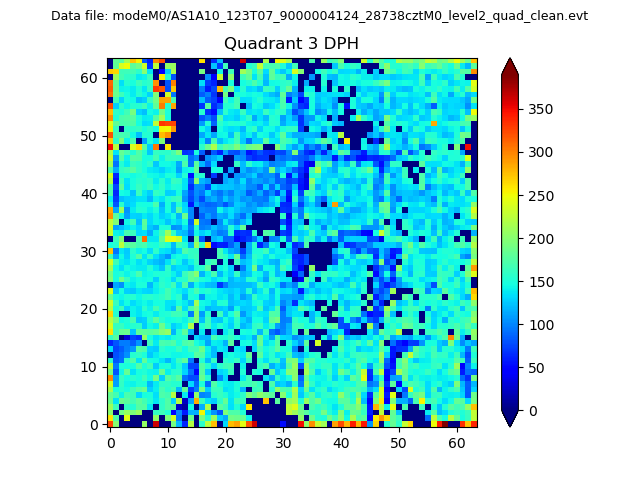 |
 |
Quadrant C |
| Plot type | Count rate plots | Images |
|---|---|---|
| Comparison with Poisson distribution Blue bars denote a histogram of data divided into 1 sec bins. Red curve is a Poisson curve with rate = median count rate of data. |
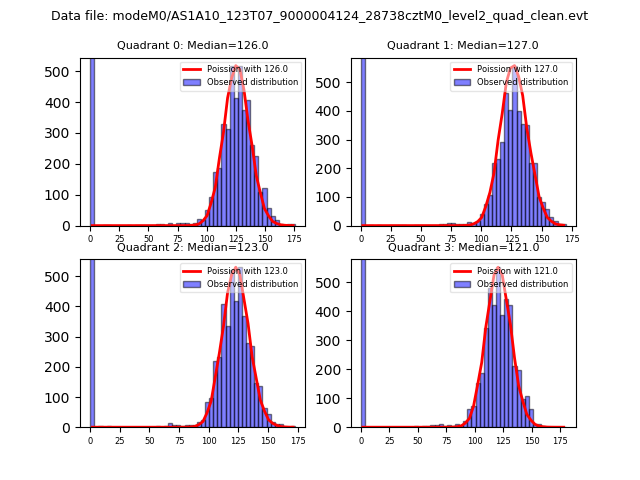 |
 |
| Quadrant-wise count rates Data is divided into 100 sec bins |
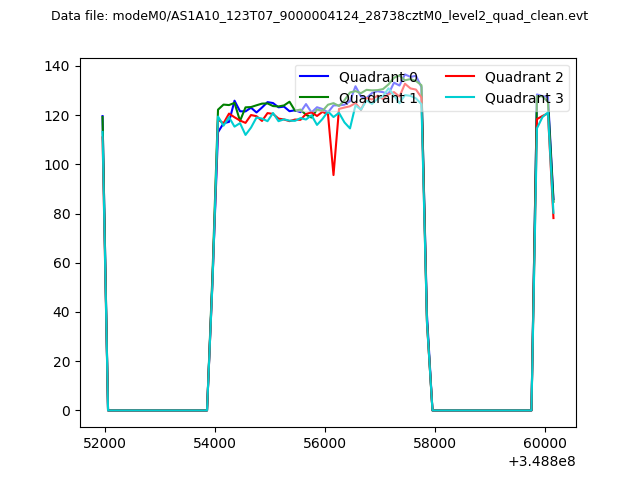 |
|
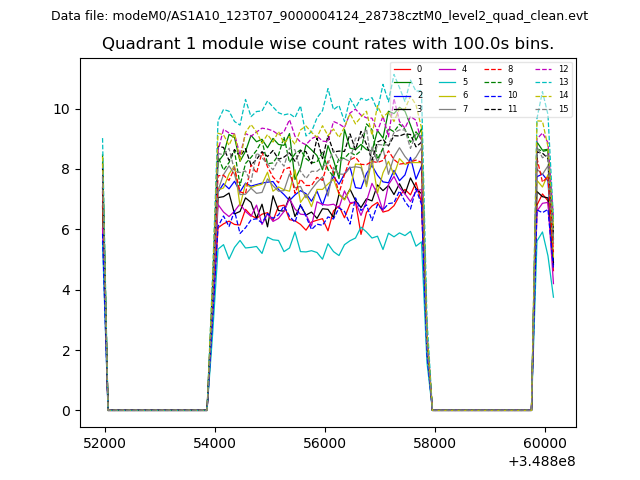
| Module-wise count rates for Quadrant A Data is divided into 100 sec bins |
 |
 |
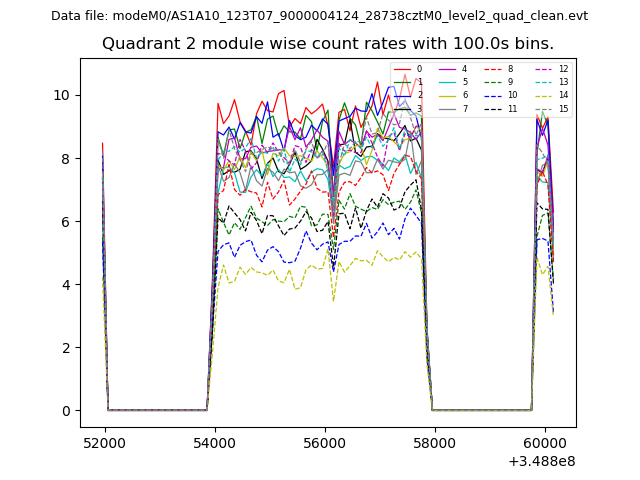
| Module-wise count rates for Quadrant B Data is divided into 100 sec bins |
 |
 |
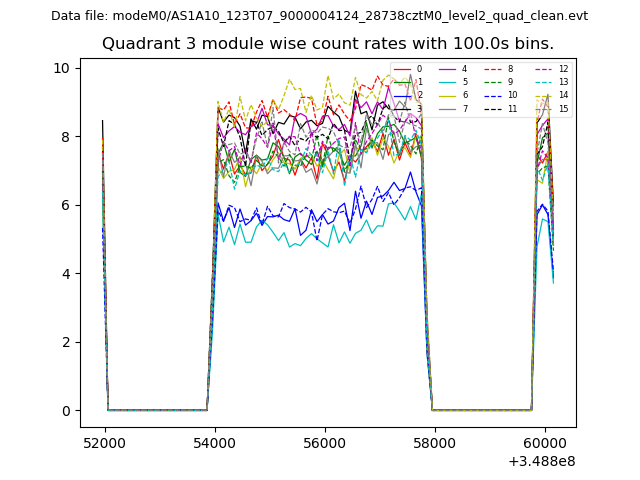
| Module-wise count rates for Quadrant C Data is divided into 100 sec bins |
 |
 |
| Module-wise count rates for Quadrant D Data is divided into 100 sec bins |
 |
 |
| Parameter | Plot |
|---|---|
| CZT HV Monitor | 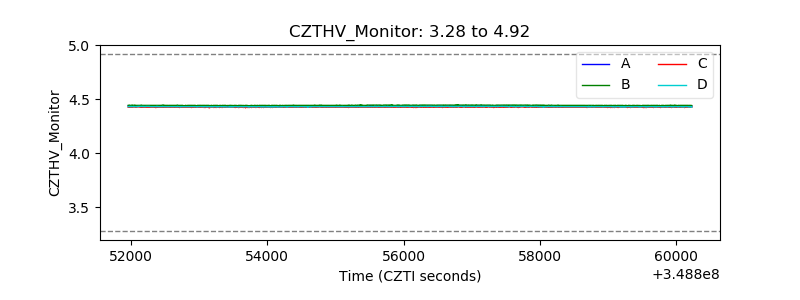 |
| D_VDD |  |
| Temperature 1 |  |
| Veto HV Monitor | 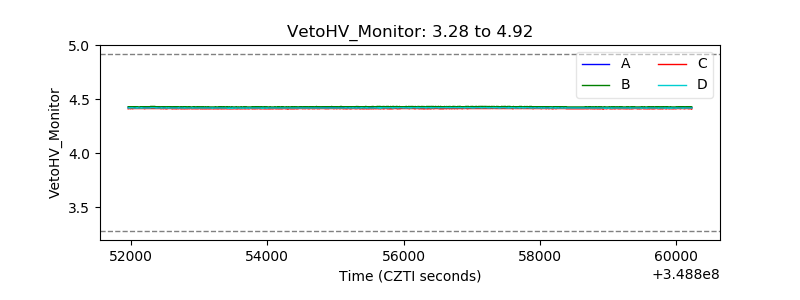 |
| Veto LLD | 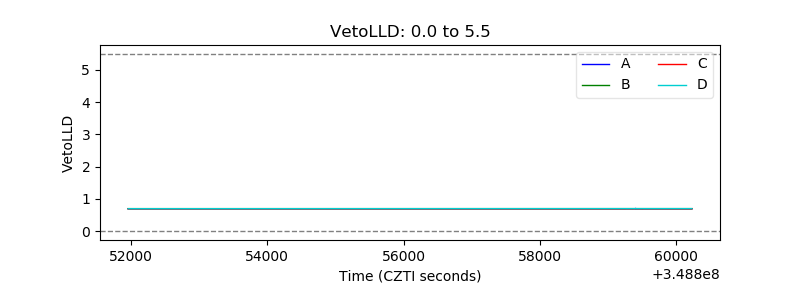 |
| Alpha Counter | 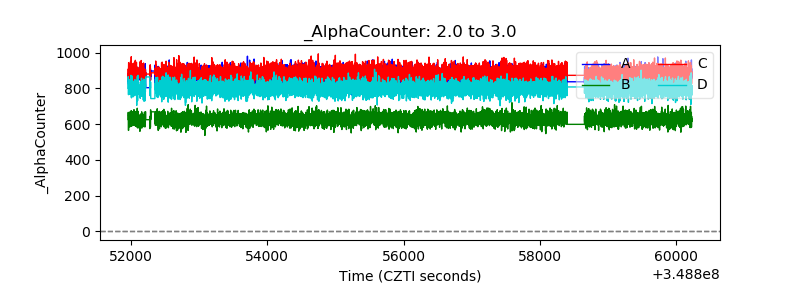 |
| _CPM_Rate | 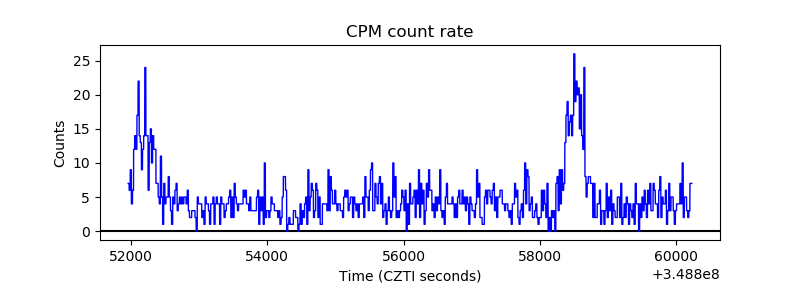 |
| CZT Counter | 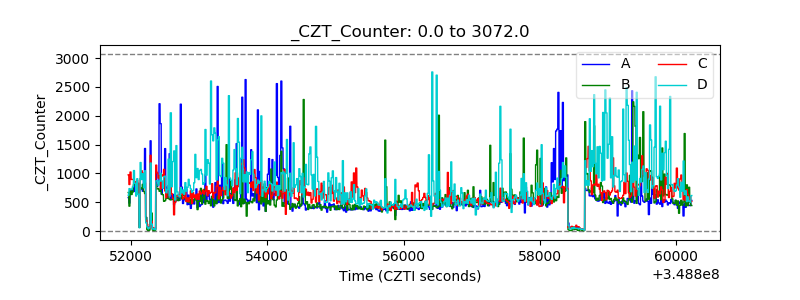 |
| +2.5 Volts monitor |  |
| +5 Volts monitor | 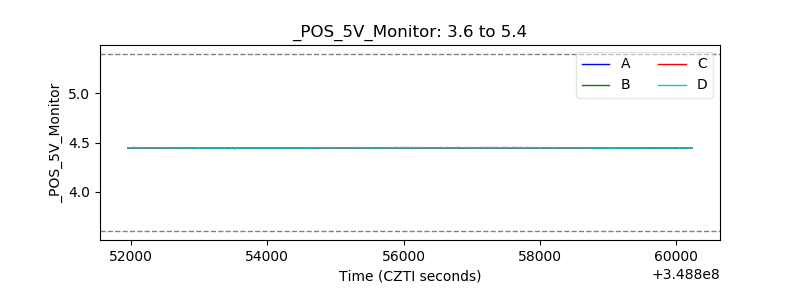 |
| _ROLL_ROT | 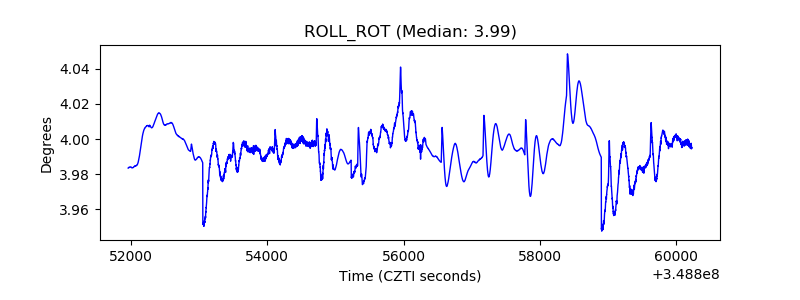 |
| _Roll_DEC | 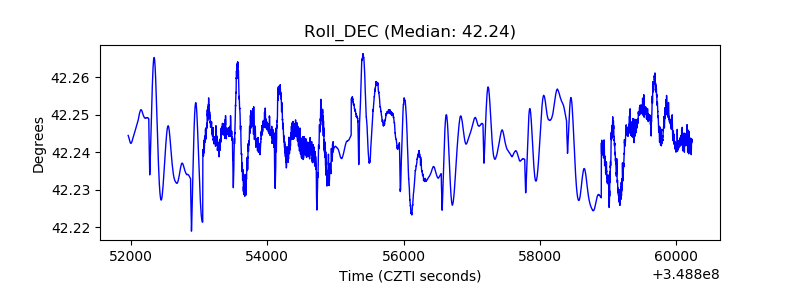 |
| _Roll_RA | 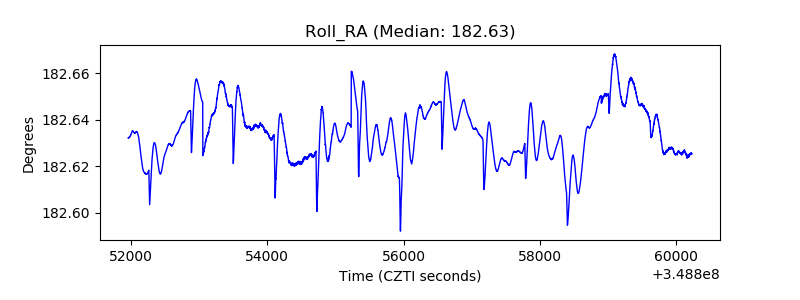 |
| Veto Counter | 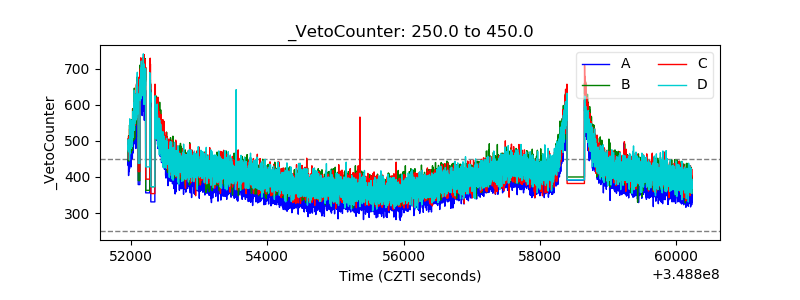 |