| Param | Original file | Final file |
|---|---|---|
| Filename | modeM0/AS1A10_123T07_9000004124_28741cztM0_level2.evt | modeM0/AS1A10_123T07_9000004124_28741cztM0_level2_quad_clean.evt |
| Size (bytes) | 208,880,640 | 18,555,840 |
| Size | 199.2 MB | 17.7 MB |
| Events in quadrant A | 1,056,350 | 106,154 |
| Events in quadrant B | 1,591,666 | 104,902 |
| Events in quadrant C | 1,547,095 | 99,973 |
| Events in quadrant D | 1,989,254 | 100,745 |
| Mode M9 | |||
|---|---|---|---|
| Quadrant | BADHDUFLAG | Total packets | Discarded packets |
| A | 1 | 140392155454248 | 46 |
| B | 1 | -1 | -1 |
| C | 1 | -1 | -1 |
| D | 1 | -1 | -1 |
| Mode M0 | |||
|---|---|---|---|
| Quadrant | BADHDUFLAG | Total packets | Discarded packets |
| A | 0 | 4406 | 1 |
| B | 0 | 6084 | 1 |
| C | 0 | 6084 | 1 |
| D | 0 | 7321 | 1 |
| Mode SS | |||
|---|---|---|---|
| Quadrant | BADHDUFLAG | Total packets | Discarded packets |
| A | 0 | 42 | 0 |
| B | 0 | 42 | 0 |
| C | 0 | 42 | 0 |
| D | 0 | 42 | 0 |
| Quadrant | Total seconds | Saturated seconds | Saturation percentage |
|---|---|---|---|
| A | 2055 | 19 | 0.924574% |
| B | 2055 | 120 | 5.839416% |
| C | 2055 | 108 | 5.255474% |
| D | 2055 | 167 | 8.126521% |
Noise dominated data is calculated using 1-second bins in cleaned event files. If a bin has >2000 counts, and if more than 50% of those come from <1% of pixels, then it is considered to be noise-dominated and hence unusable.
| Quadrant | # 1 sec bins | Bins with >0 counts | Bins with >2000 counts | High rate bins dominated by noise | Noise dominated (total time) | Noise dominated (detector-on time) | Marked lightcurve |
|---|---|---|---|---|---|---|---|
| A | 2055 | 2055 | 2 | 2 | 0.10% | 0.10% | 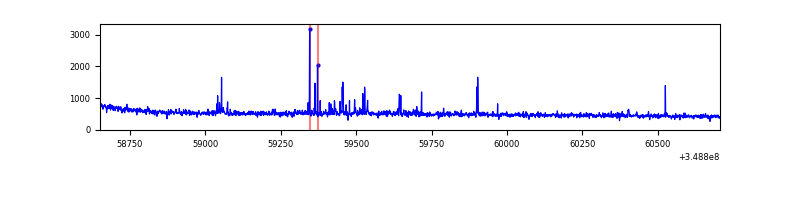 |
| B | 2055 | 2055 | 46 | 46 | 2.24% | 2.24% | 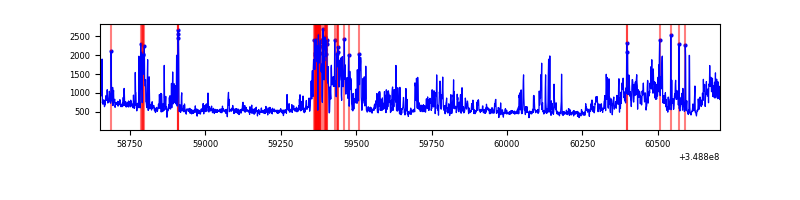 |
| C | 2055 | 2055 | 1 | 1 | 0.05% | 0.05% | 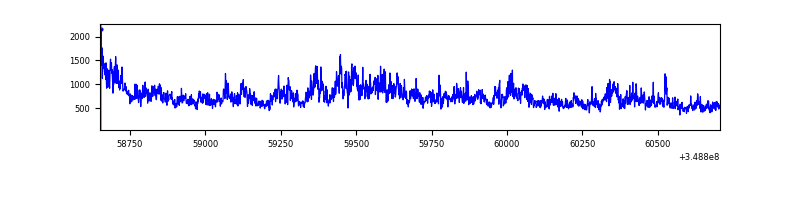 |
| D | 2055 | 2055 | 103 | 103 | 5.01% | 5.01% | 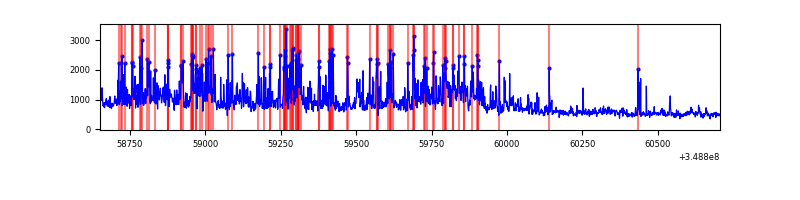 |
Top three noisy pixels from each quadrant. If the there are fewer than three noisy pixels in the level2.evt file, extra rows are filled as -1
| Pixel properties | Quadrant properties | ||||||
|---|---|---|---|---|---|---|---|
| Quadrant | DetID | PixID | Counts | Sigma | Mean | Median | Sigma |
| A | 14 | 239 | 39556 | 718.01 | 260 | 254 | 54.7 |
| A | 15 | 174 | 8585 | 152.2 | 260 | 254 | 54.7 |
| A | 13 | 254 | 4476 | 77.13 | 260 | 254 | 54.7 |
| B | 10 | 245 | 414063 | 8155.85 | 256 | 249 | 50.7 |
| B | 5 | 255 | 141644 | 2786.75 | 256 | 249 | 50.7 |
| B | 0 | 230 | 10253 | 197.17 | 256 | 249 | 50.7 |
| C | 3 | 233 | 522333 | 8789.73 | 247 | 248 | 59.4 |
| C | 14 | 238 | 45558 | 762.83 | 247 | 248 | 59.4 |
| C | 14 | 254 | 8643 | 141.34 | 247 | 248 | 59.4 |
| D | 8 | 195 | 440333 | 7119.54 | 250 | 242 | 61.8 |
| D | 1 | 52 | 365159 | 5903.42 | 250 | 242 | 61.8 |
| D | 12 | 79 | 170862 | 2760.19 | 250 | 242 | 61.8 |
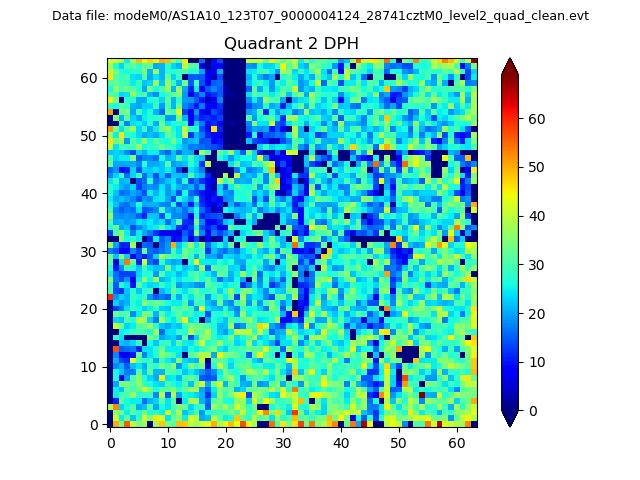
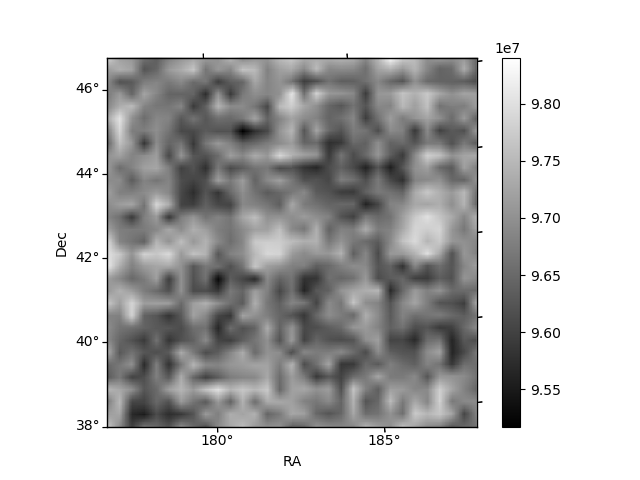
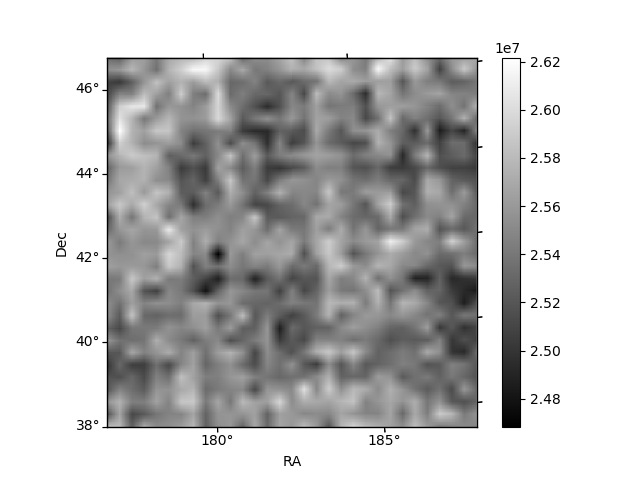
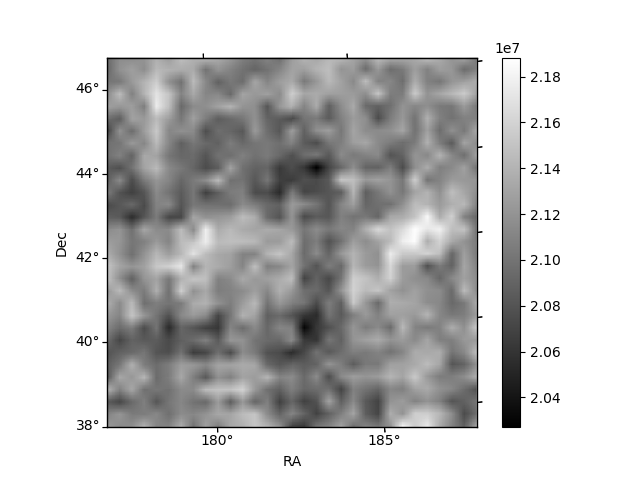
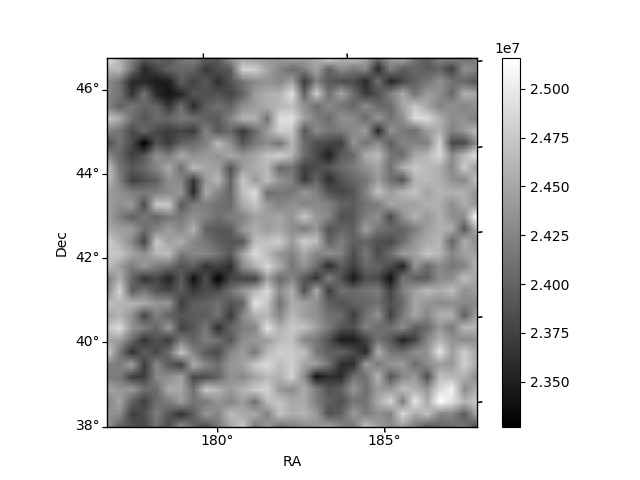
Histogram calculated using DETX and DETY for each event in the final _common_clean file
| Quadrant A | 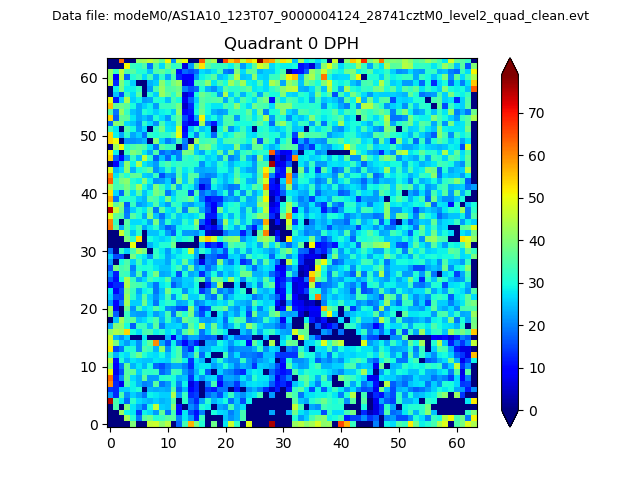 |
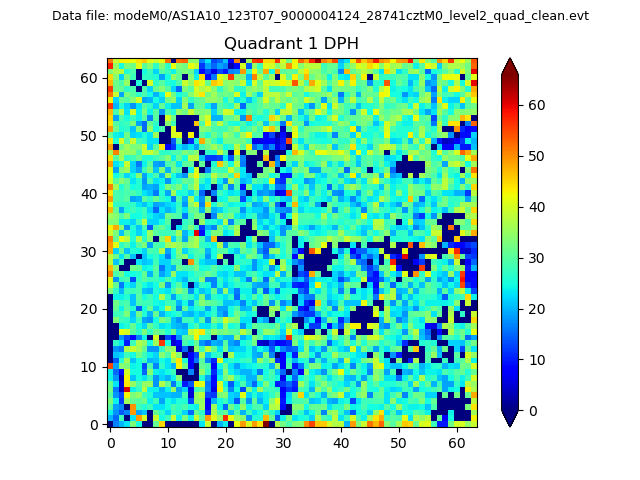 |
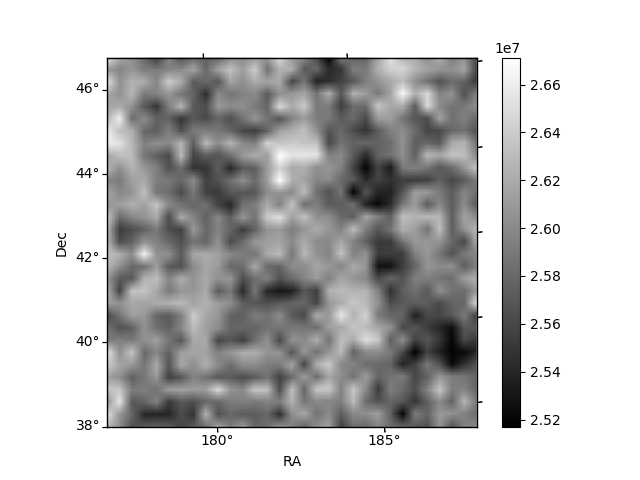
Quadrant B |
|---|---|---|---|
| Quadrant D | 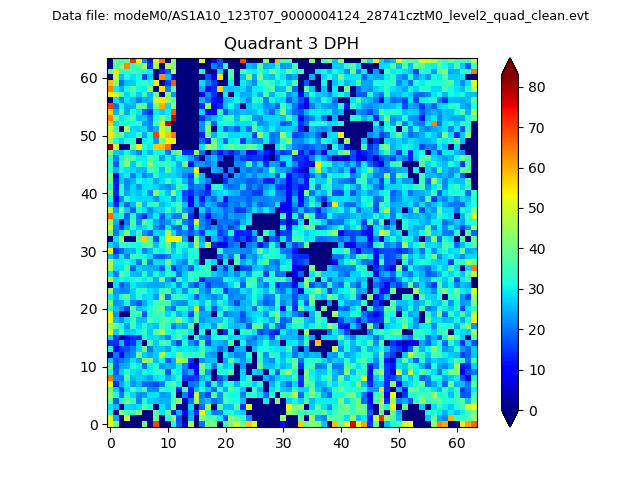 |
 |
Quadrant C |
| Plot type | Count rate plots | Images |
|---|---|---|
| Comparison with Poisson distribution Blue bars denote a histogram of data divided into 1 sec bins. Red curve is a Poisson curve with rate = median count rate of data. |
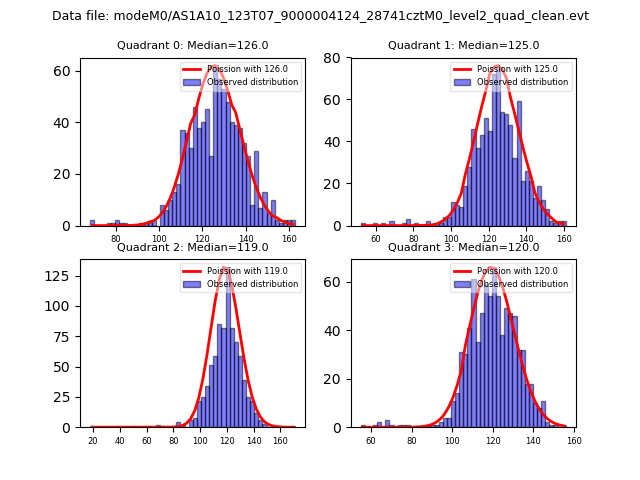 |
 |
| Quadrant-wise count rates Data is divided into 100 sec bins |
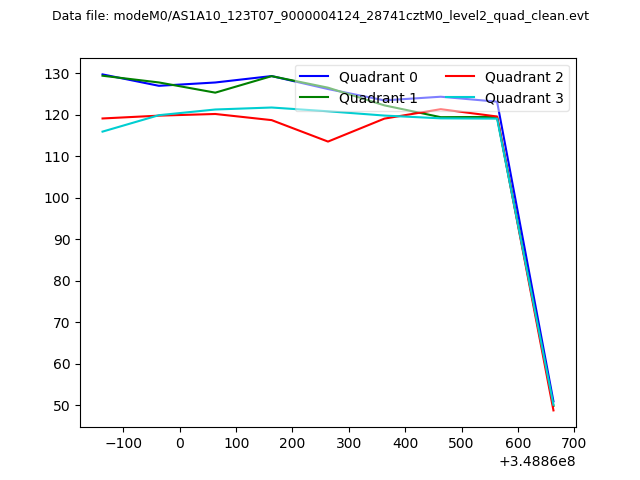 |
|
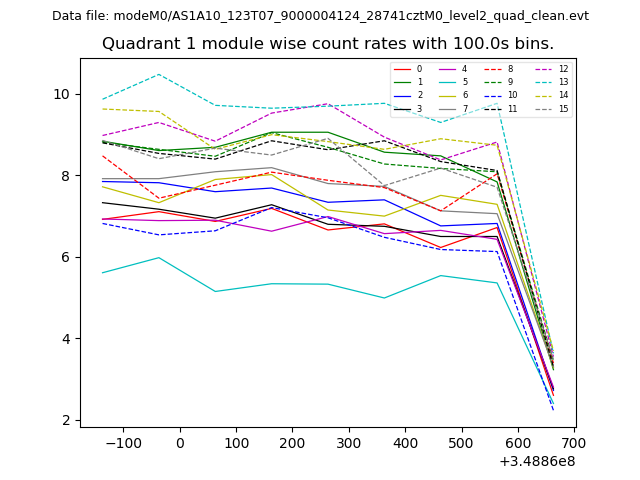
| Module-wise count rates for Quadrant A Data is divided into 100 sec bins |
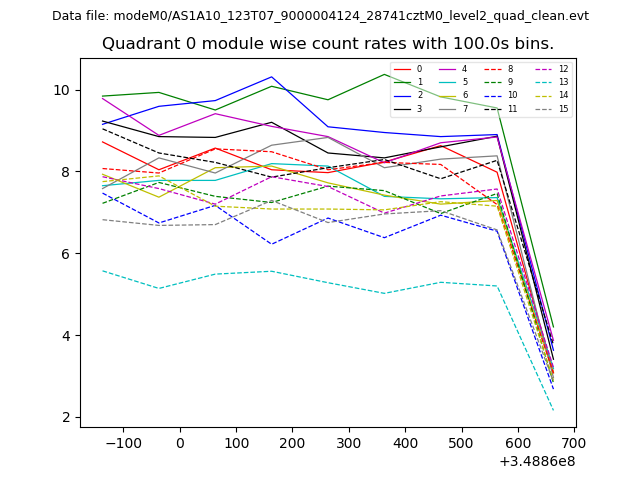 |
 |
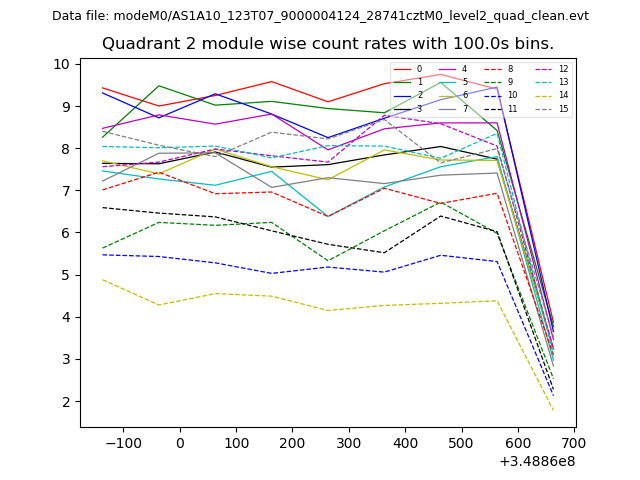
| Module-wise count rates for Quadrant B Data is divided into 100 sec bins |
 |
 |
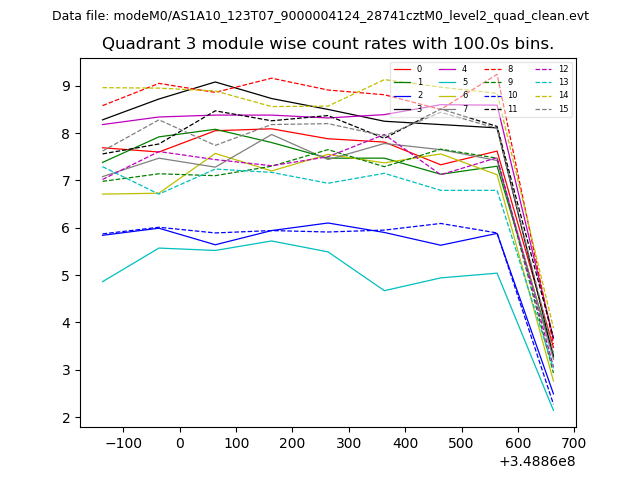
| Module-wise count rates for Quadrant C Data is divided into 100 sec bins |
 |
 |
| Module-wise count rates for Quadrant D Data is divided into 100 sec bins |
 |
 |
| Parameter | Plot |
|---|---|
| CZT HV Monitor | 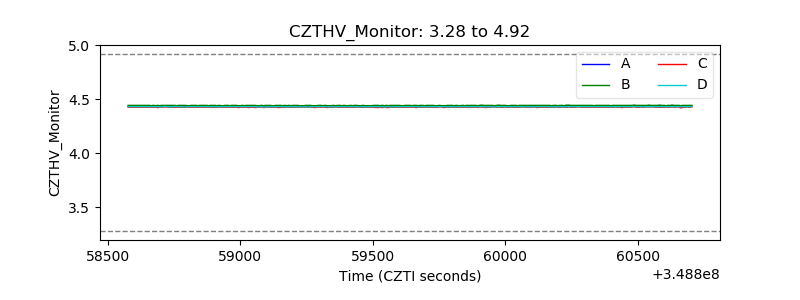 |
| D_VDD | 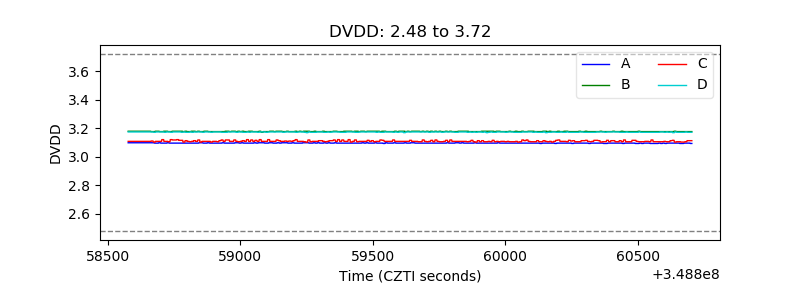 |
| Temperature 1 | 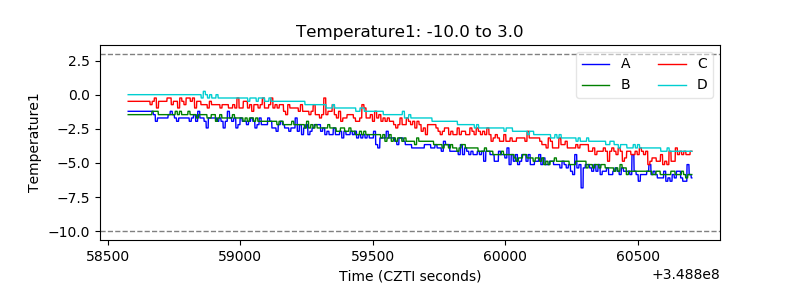 |
| Veto HV Monitor | 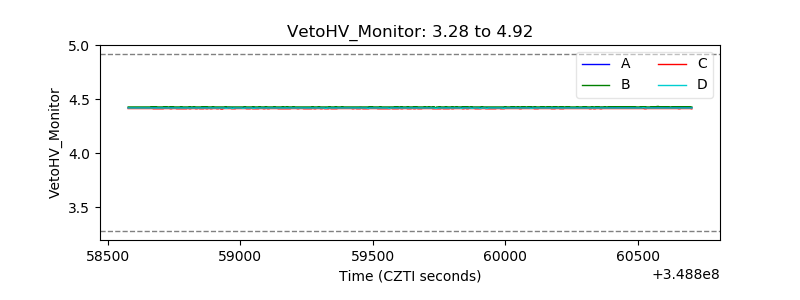 |
| Veto LLD | 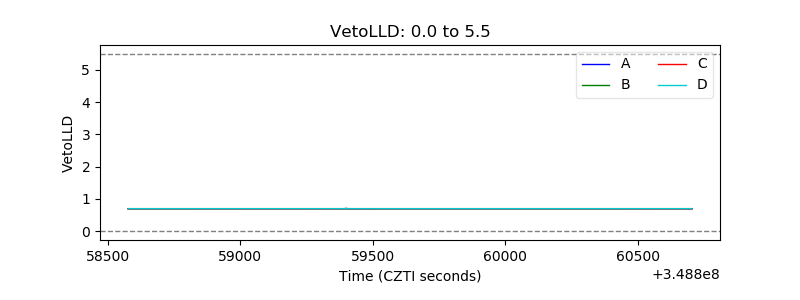 |
| Alpha Counter | 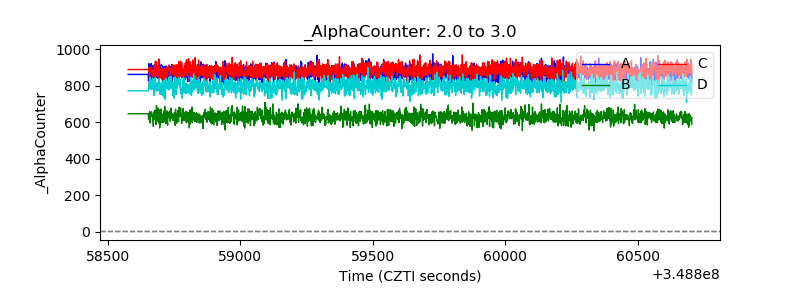 |
| _CPM_Rate | 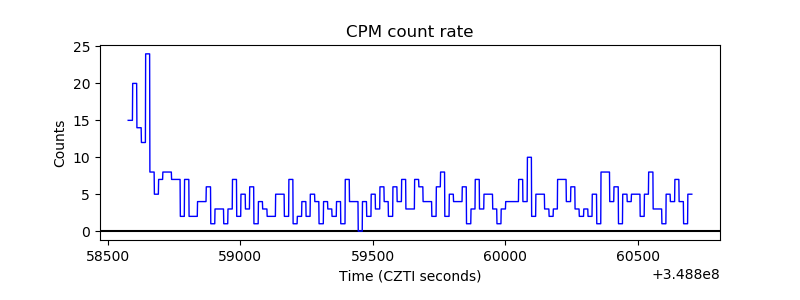 |
| CZT Counter | 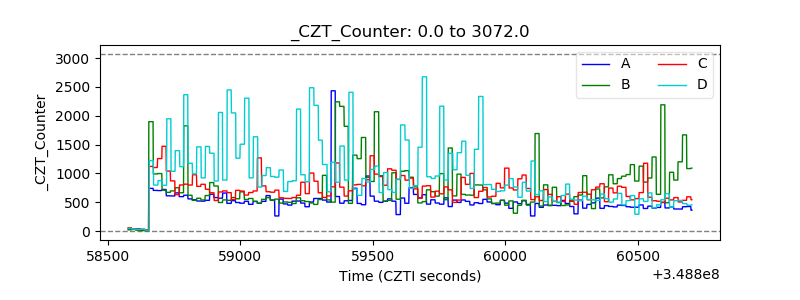 |
| +2.5 Volts monitor |  |
| +5 Volts monitor |  |
| _ROLL_ROT | 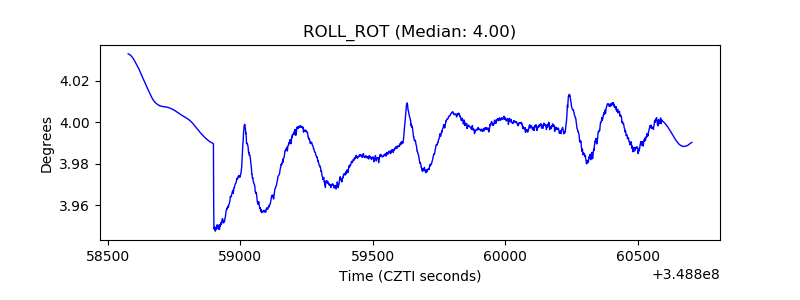 |
| _Roll_DEC | 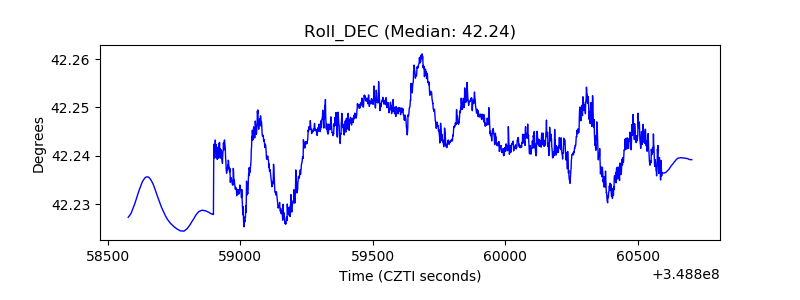 |
| _Roll_RA | 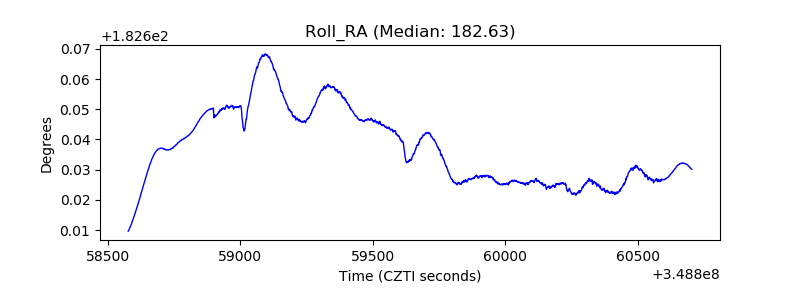 |
| Veto Counter | 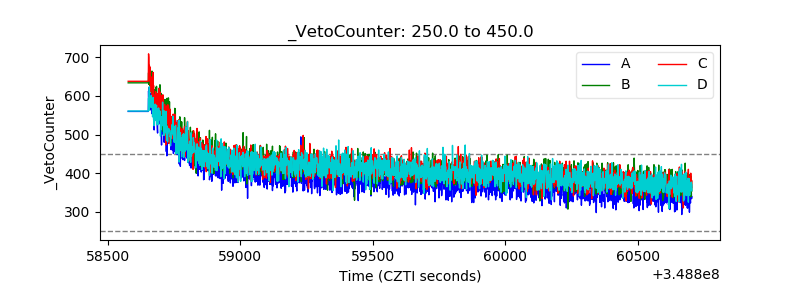 |