| Param | Original file | Final file |
|---|---|---|
| Filename | modeM0/AS1A10_123T08_9000004126_28741cztM0_level2.evt | modeM0/AS1A10_123T08_9000004126_28741cztM0_level2_quad_clean.evt |
| Size (bytes) | 786,559,680 | 134,703,360 |
| Size | 750.1 MB | 128.5 MB |
| Events in quadrant A | 4,561,043 | 869,829 |
| Events in quadrant B | 4,871,407 | 878,861 |
| Events in quadrant C | 6,893,895 | 842,783 |
| Events in quadrant D | 6,858,481 | 836,027 |
| Mode M0 | |||
|---|---|---|---|
| Quadrant | BADHDUFLAG | Total packets | Discarded packets |
| A | 0 | 20013 | 2 |
| B | 0 | 20665 | 2 |
| C | 0 | 26980 | 2 |
| D | 0 | 26954 | 2 |
| Mode SS | |||
|---|---|---|---|
| Quadrant | BADHDUFLAG | Total packets | Discarded packets |
| A | 0 | 192 | 0 |
| B | 0 | 192 | 0 |
| C | 0 | 192 | 0 |
| D | 0 | 192 | 0 |
| Mode M9 | |||
|---|---|---|---|
| Quadrant | BADHDUFLAG | Total packets | Discarded packets |
| A | 0 | 11 | 0 |
| B | 0 | 11 | 0 |
| C | 0 | 11 | 0 |
| D | 0 | 11 | 0 |
| Quadrant | Total seconds | Saturated seconds | Saturation percentage |
|---|---|---|---|
| A | 9406 | 163 | 1.732936% |
| B | 9406 | 144 | 1.530938% |
| C | 9406 | 538 | 5.719753% |
| D | 9406 | 695 | 7.388901% |
Noise dominated data is calculated using 1-second bins in cleaned event files. If a bin has >2000 counts, and if more than 50% of those come from <1% of pixels, then it is considered to be noise-dominated and hence unusable.
| Quadrant | # 1 sec bins | Bins with >0 counts | Bins with >2000 counts | High rate bins dominated by noise | Noise dominated (total time) | Noise dominated (detector-on time) | Marked lightcurve |
|---|---|---|---|---|---|---|---|
| A | 10451 | 9407 | 71 | 71 | 0.68% | 0.75% | 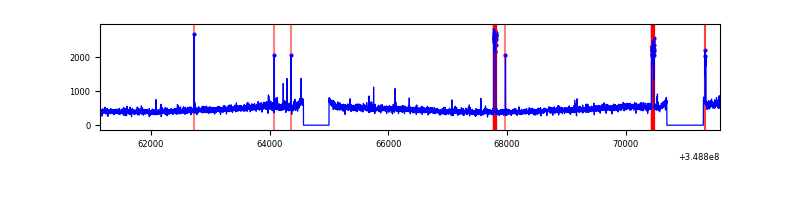 |
| B | 10451 | 9406 | 33 | 33 | 0.32% | 0.35% | 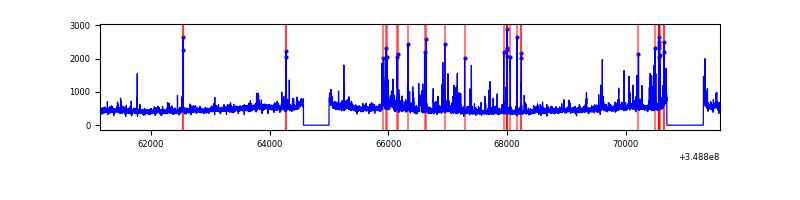 |
| C | 10451 | 9406 | 23 | 23 | 0.22% | 0.24% | 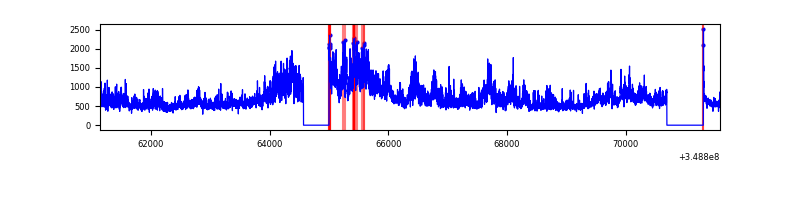 |
| D | 10451 | 9407 | 514 | 514 | 4.92% | 5.46% | 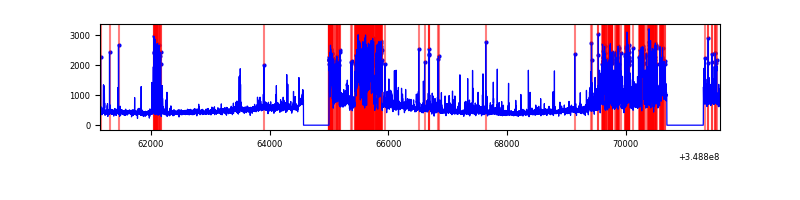 |
Top three noisy pixels from each quadrant. If the there are fewer than three noisy pixels in the level2.evt file, extra rows are filled as -1
| Pixel properties | Quadrant properties | ||||||
|---|---|---|---|---|---|---|---|
| Quadrant | DetID | PixID | Counts | Sigma | Mean | Median | Sigma |
| A | 6 | 16 | 194134 | 859.52 | 1114 | 1090 | 224.6 |
| A | 14 | 239 | 34510 | 148.8 | 1114 | 1090 | 224.6 |
| A | 15 | 174 | 22319 | 94.52 | 1114 | 1090 | 224.6 |
| B | 5 | 255 | 274338 | 1299.86 | 1102 | 1072 | 210.2 |
| B | 10 | 245 | 180440 | 853.21 | 1102 | 1072 | 210.2 |
| B | 12 | 111 | 26098 | 119.04 | 1102 | 1072 | 210.2 |
| C | 3 | 233 | 2503077 | 10355.72 | 1048 | 1053 | 241.6 |
| C | 14 | 238 | 220482 | 908.2 | 1048 | 1053 | 241.6 |
| C | 14 | 254 | 77577 | 316.73 | 1048 | 1053 | 241.6 |
| D | 8 | 195 | 1588256 | 6401.18 | 1049 | 1021 | 248.0 |
| D | 1 | 52 | 960589 | 3869.85 | 1049 | 1021 | 248.0 |
| D | 12 | 233 | 159773 | 640.23 | 1049 | 1021 | 248.0 |
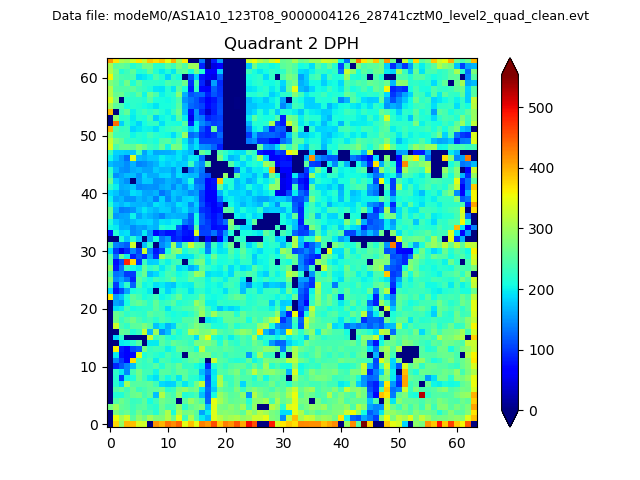
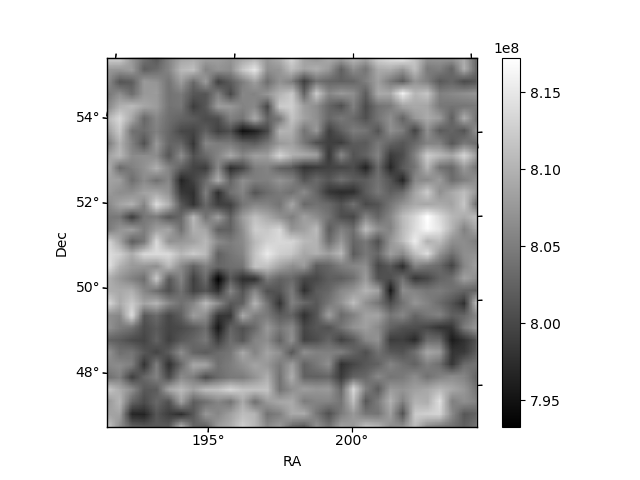
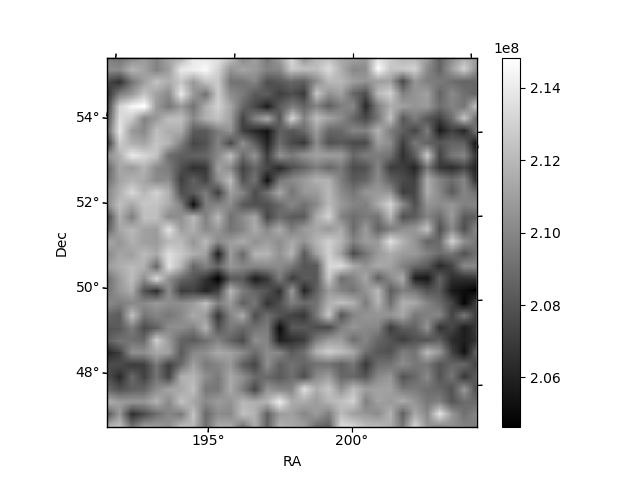
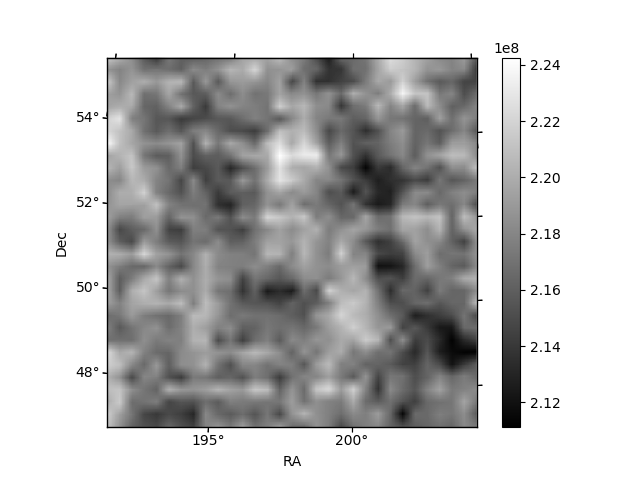
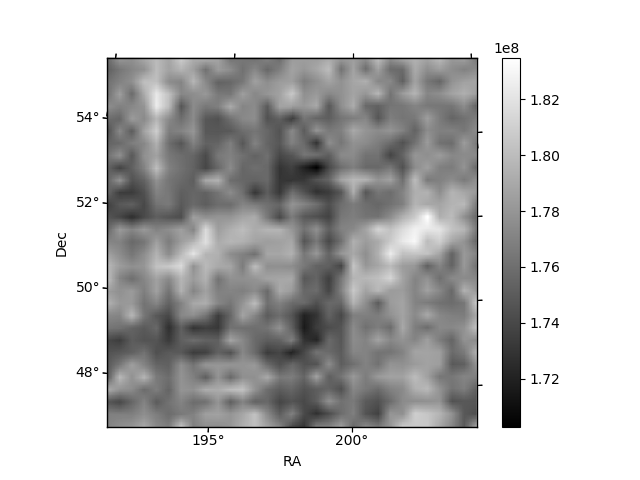
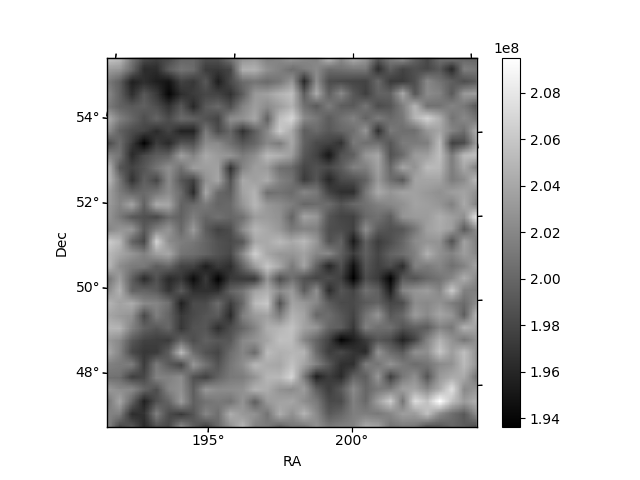
Histogram calculated using DETX and DETY for each event in the final _common_clean file
| Quadrant A | 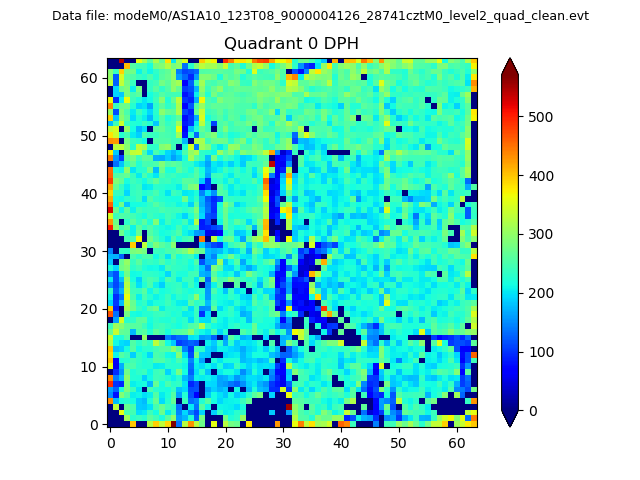 |
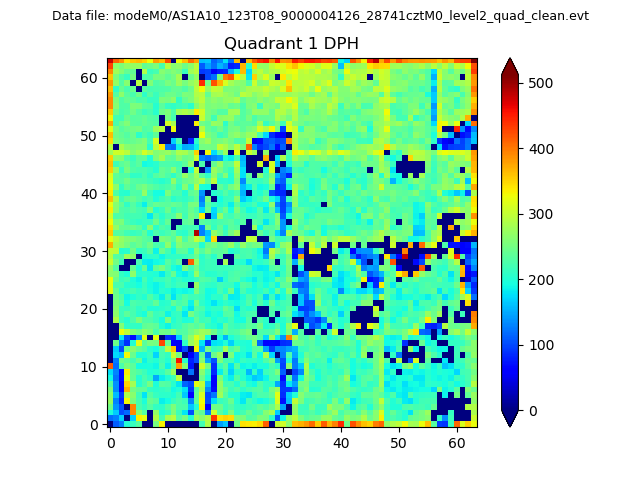 |
Quadrant B |
|---|---|---|---|
| Quadrant D | 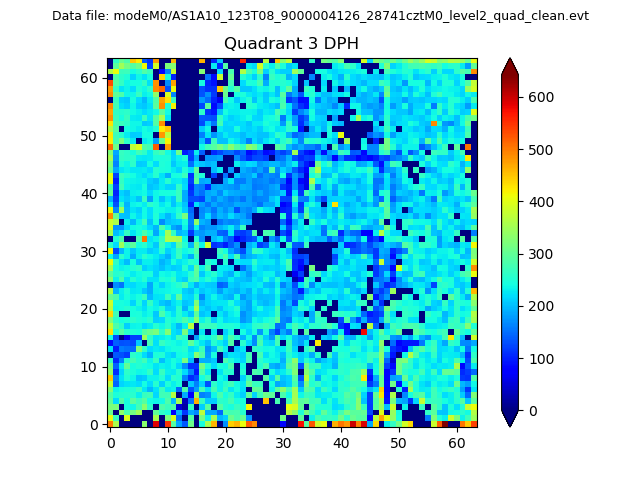 |
 |
Quadrant C |
| Plot type | Count rate plots | Images |
|---|---|---|
| Comparison with Poisson distribution Blue bars denote a histogram of data divided into 1 sec bins. Red curve is a Poisson curve with rate = median count rate of data. |
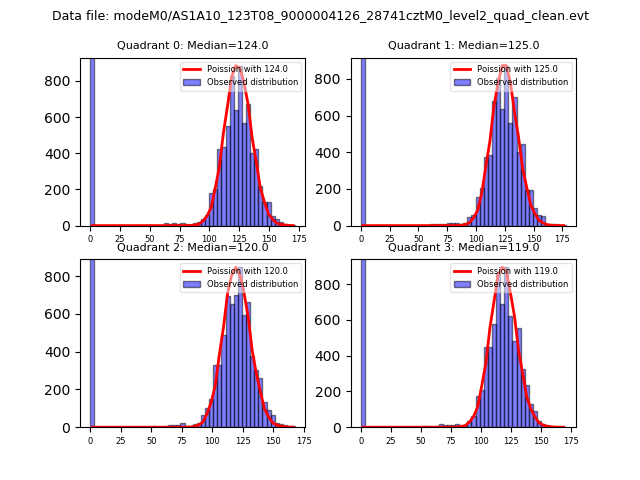 |
 |
| Quadrant-wise count rates Data is divided into 100 sec bins |
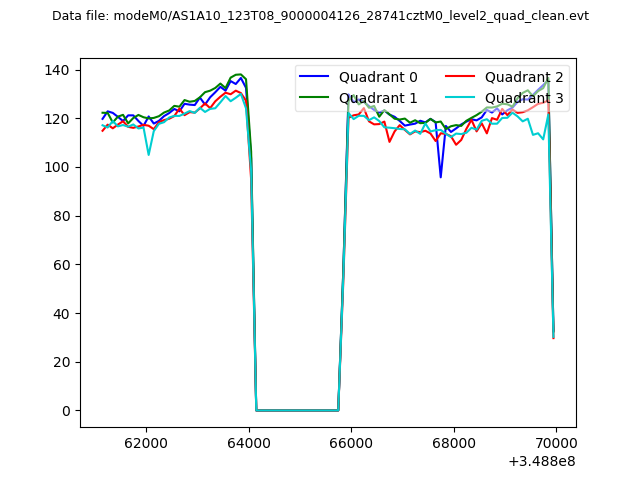 |
|
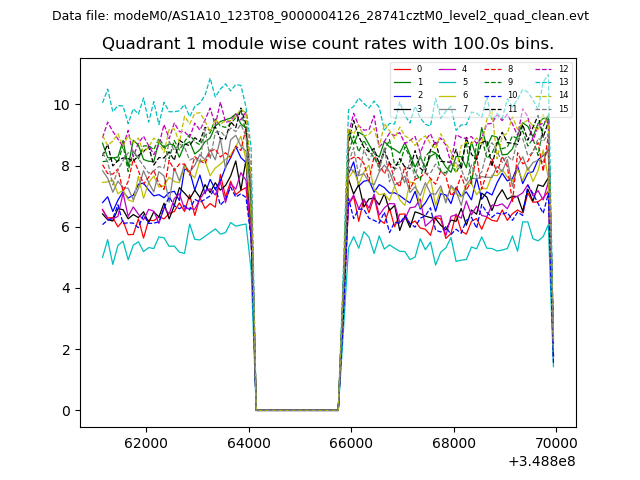
| Module-wise count rates for Quadrant A Data is divided into 100 sec bins |
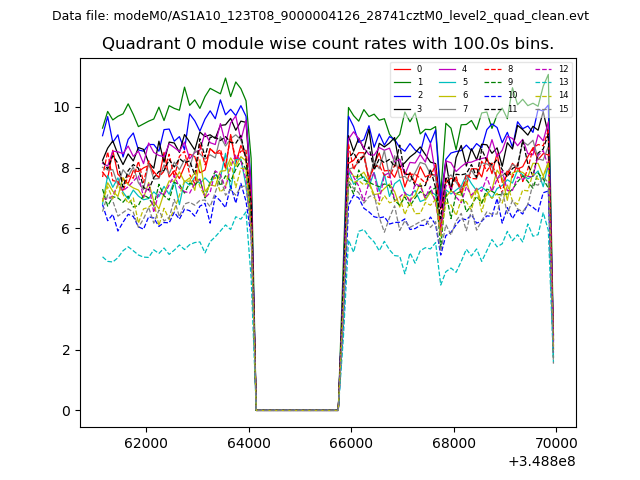 |
 |
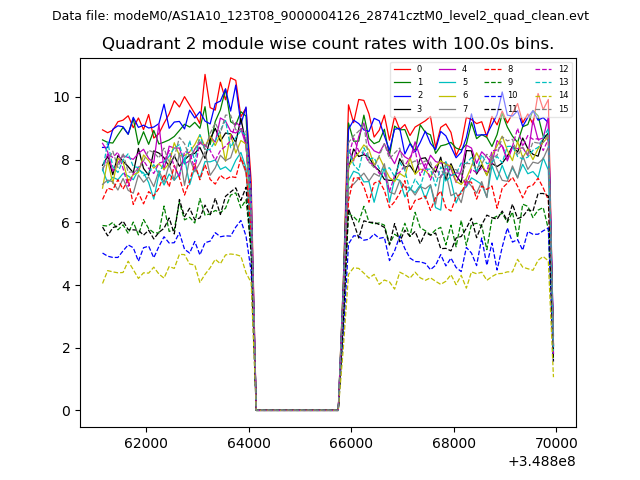
| Module-wise count rates for Quadrant B Data is divided into 100 sec bins |
 |
 |
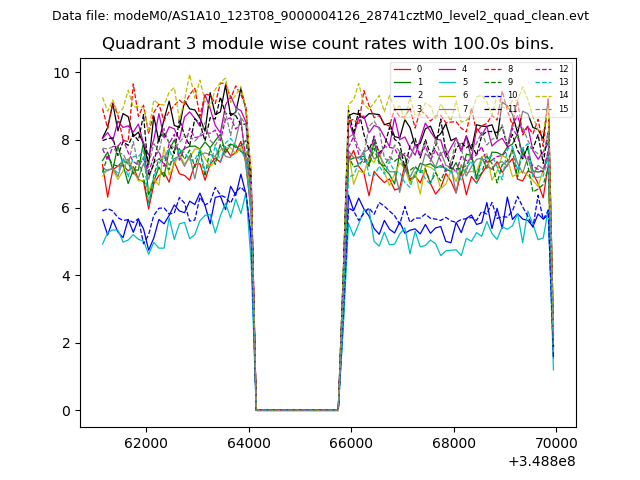
| Module-wise count rates for Quadrant C Data is divided into 100 sec bins |
 |
 |
| Module-wise count rates for Quadrant D Data is divided into 100 sec bins |
 |
 |
| Parameter | Plot |
|---|---|
| CZT HV Monitor | 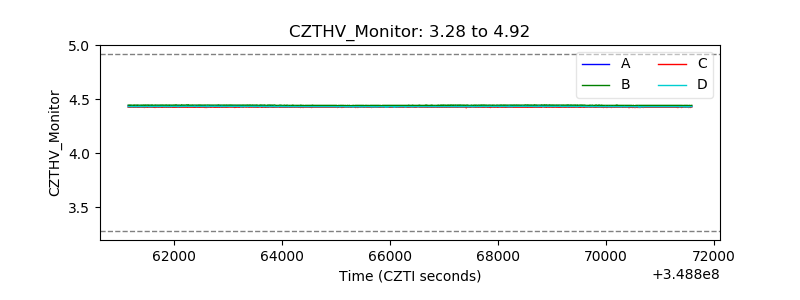 |
| D_VDD | 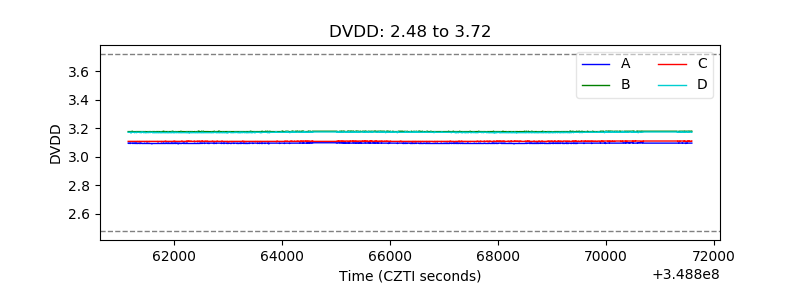 |
| Temperature 1 | 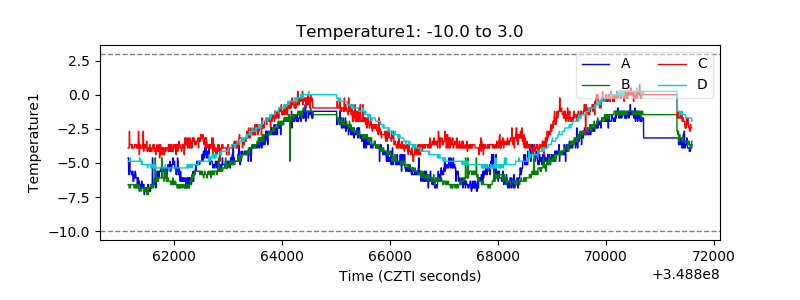 |
| Veto HV Monitor | 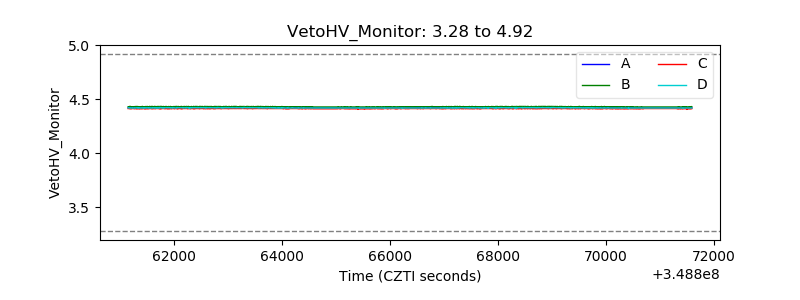 |
| Veto LLD | 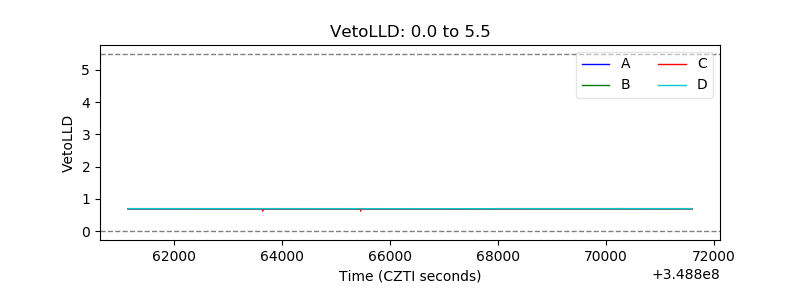 |
| Alpha Counter | 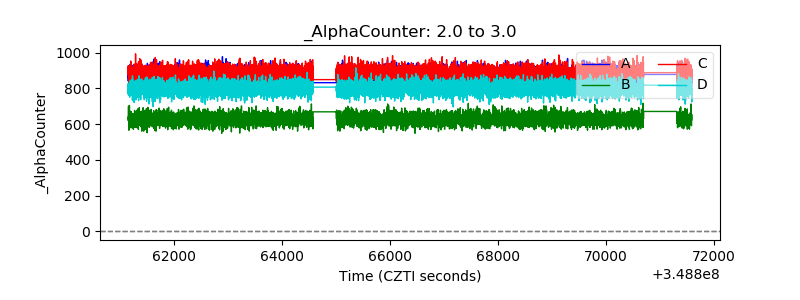 |
| _CPM_Rate | 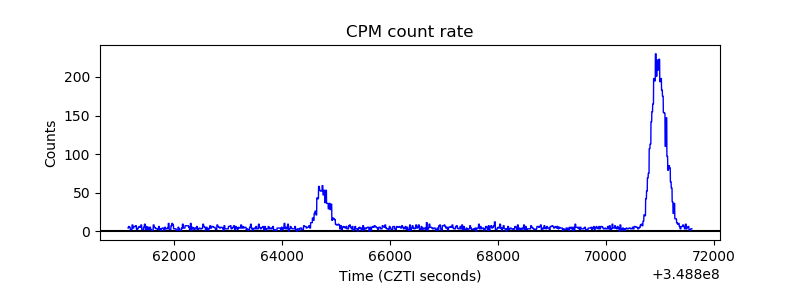 |
| CZT Counter | 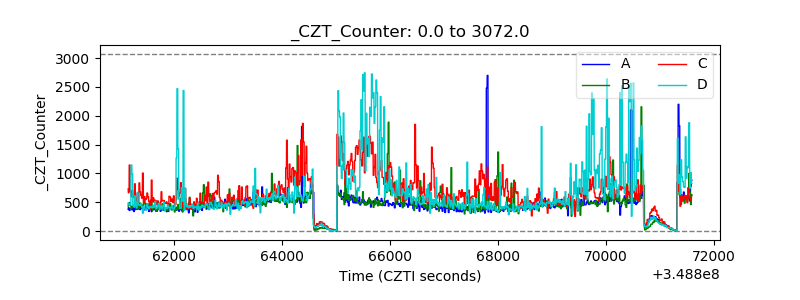 |
| +2.5 Volts monitor |  |
| +5 Volts monitor | 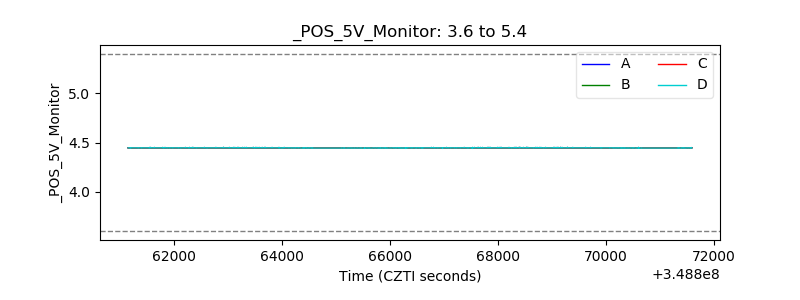 |
| _ROLL_ROT | 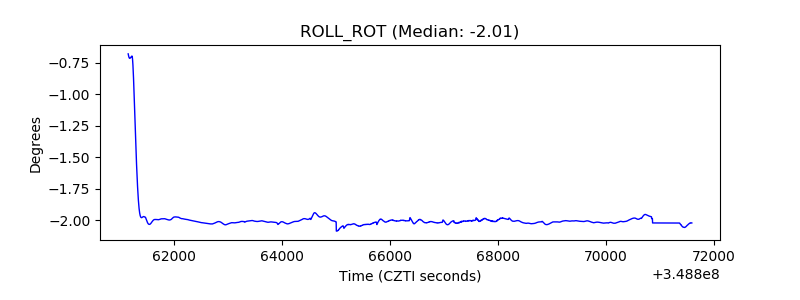 |
| _Roll_DEC | 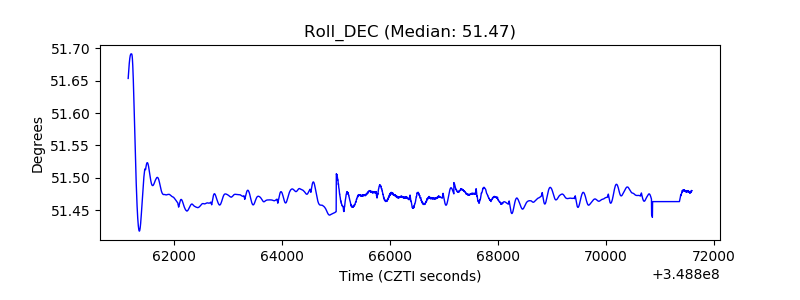 |
| _Roll_RA | 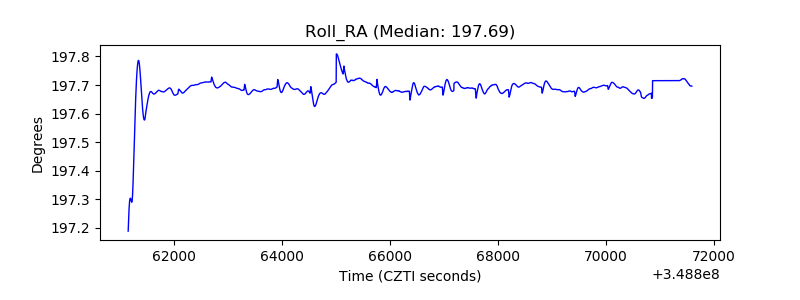 |
| Veto Counter | 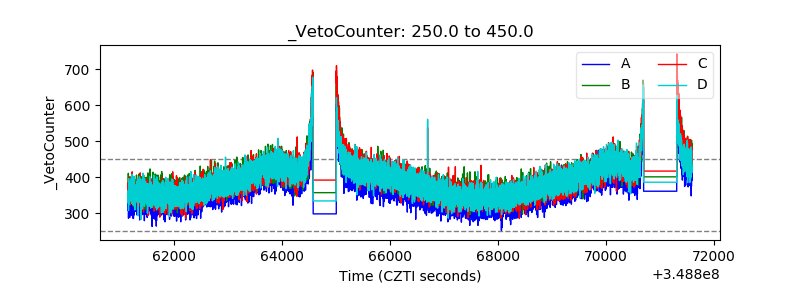 |