| Param | Original file | Final file |
|---|---|---|
| Filename | modeM0/AS1A10_123T08_9000004126_28742cztM0_level2.evt | modeM0/AS1A10_123T08_9000004126_28742cztM0_level2_quad_clean.evt |
| Size (bytes) | 1,007,501,760 | 186,612,480 |
| Size | 960.8 MB | 178.0 MB |
| Events in quadrant A | 5,879,260 | 1,215,052 |
| Events in quadrant B | 6,587,109 | 1,234,427 |
| Events in quadrant C | 8,176,452 | 1,180,909 |
| Events in quadrant D | 9,021,238 | 1,153,596 |
| Mode M0 | |||
|---|---|---|---|
| Quadrant | BADHDUFLAG | Total packets | Discarded packets |
| A | 0 | 26096 | 3 |
| B | 0 | 27942 | 3 |
| C | 0 | 32902 | 3 |
| D | 0 | 35484 | 3 |
| Mode SS | |||
|---|---|---|---|
| Quadrant | BADHDUFLAG | Total packets | Discarded packets |
| A | 0 | 256 | 0 |
| B | 0 | 256 | 0 |
| C | 0 | 256 | 0 |
| D | 0 | 256 | 0 |
| Mode M9 | |||
|---|---|---|---|
| Quadrant | BADHDUFLAG | Total packets | Discarded packets |
| A | 0 | 24 | 0 |
| B | 0 | 24 | 0 |
| C | 0 | 24 | 0 |
| D | 0 | 24 | 0 |
| Quadrant | Total seconds | Saturated seconds | Saturation percentage |
|---|---|---|---|
| A | 12562 | 88 | 0.700525% |
| B | 12562 | 247 | 1.966247% |
| C | 12561 | 394 | 3.136693% |
| D | 12561 | 413 | 3.287955% |
Noise dominated data is calculated using 1-second bins in cleaned event files. If a bin has >2000 counts, and if more than 50% of those come from <1% of pixels, then it is considered to be noise-dominated and hence unusable.
| Quadrant | # 1 sec bins | Bins with >0 counts | Bins with >2000 counts | High rate bins dominated by noise | Noise dominated (total time) | Noise dominated (detector-on time) | Marked lightcurve |
|---|---|---|---|---|---|---|---|
| A | 14937 | 12564 | 9 | 9 | 0.06% | 0.07% | 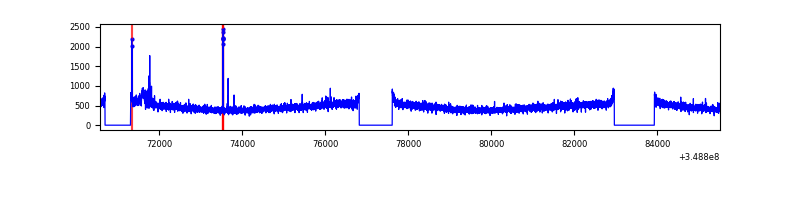 |
| B | 14937 | 12562 | 56 | 56 | 0.37% | 0.45% | 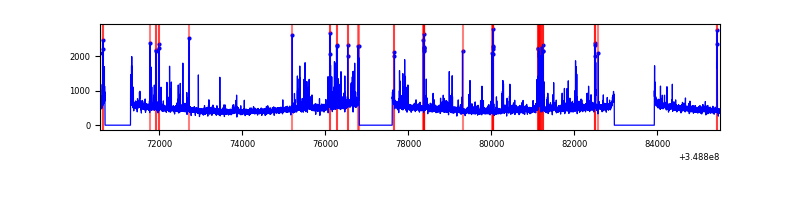 |
| C | 14936 | 12561 | 9 | 9 | 0.06% | 0.07% | 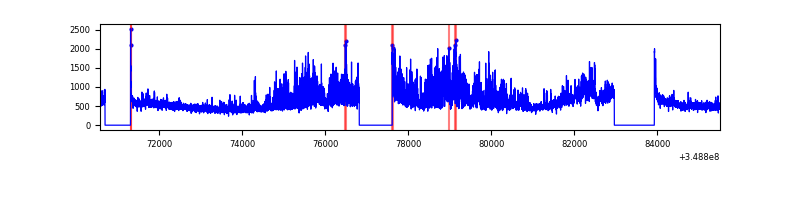 |
| D | 14936 | 12562 | 270 | 270 | 1.81% | 2.15% | 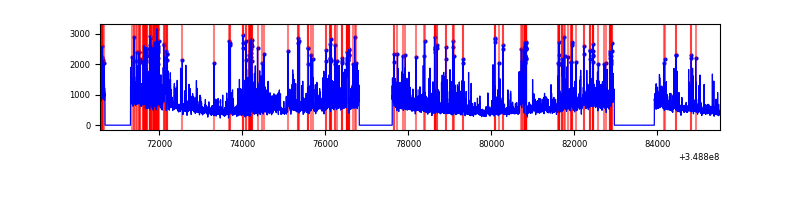 |
Top three noisy pixels from each quadrant. If the there are fewer than three noisy pixels in the level2.evt file, extra rows are filled as -1
| Pixel properties | Quadrant properties | ||||||
|---|---|---|---|---|---|---|---|
| Quadrant | DetID | PixID | Counts | Sigma | Mean | Median | Sigma |
| A | 15 | 174 | 59719 | 196.83 | 1490 | 1458 | 296.0 |
| A | 6 | 16 | 57511 | 189.37 | 1490 | 1458 | 296.0 |
| A | 13 | 254 | 25400 | 80.88 | 1490 | 1458 | 296.0 |
| B | 5 | 255 | 400825 | 1423.13 | 1482 | 1444 | 280.6 |
| B | 4 | 80 | 228855 | 810.34 | 1482 | 1444 | 280.6 |
| B | 10 | 245 | 75309 | 263.21 | 1482 | 1444 | 280.6 |
| C | 3 | 233 | 2298029 | 6965.96 | 1424 | 1431 | 329.7 |
| C | 14 | 238 | 256315 | 773.1 | 1424 | 1431 | 329.7 |
| C | 14 | 254 | 45431 | 133.46 | 1424 | 1431 | 329.7 |
| D | 8 | 195 | 1907996 | 5561.3 | 1431 | 1391 | 342.8 |
| D | 1 | 52 | 1495156 | 4357.1 | 1431 | 1391 | 342.8 |
| D | 12 | 233 | 55637 | 158.23 | 1431 | 1391 | 342.8 |
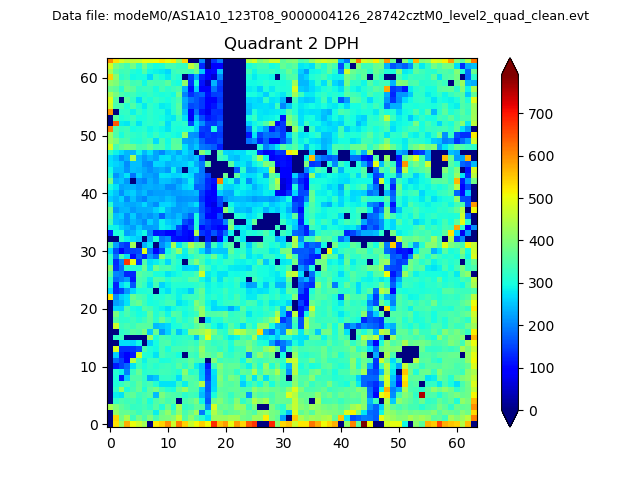
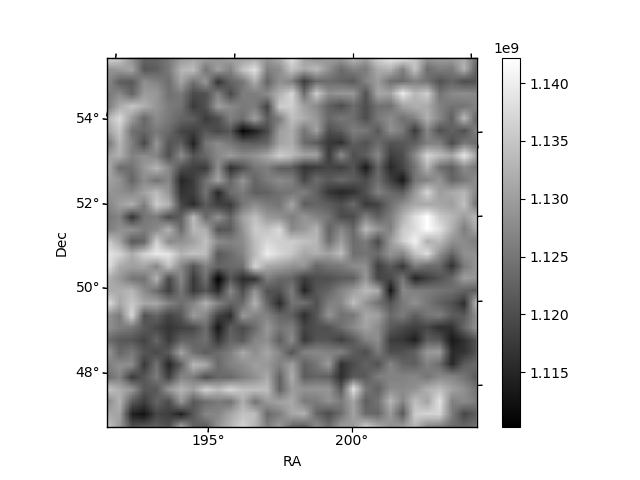
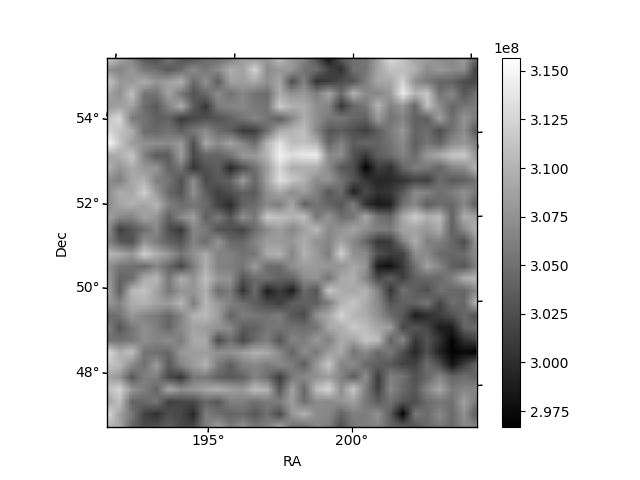
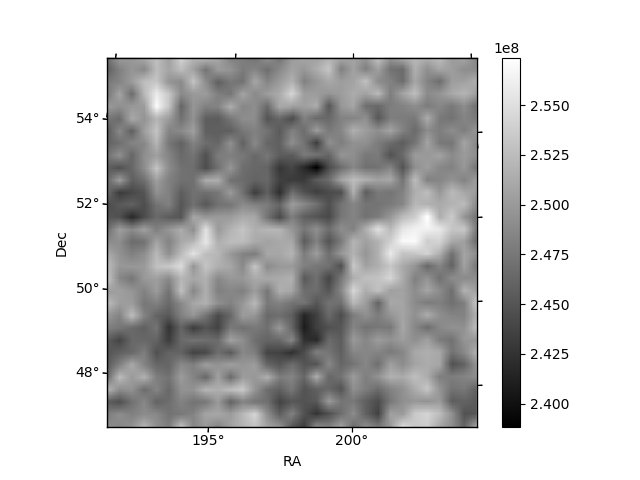
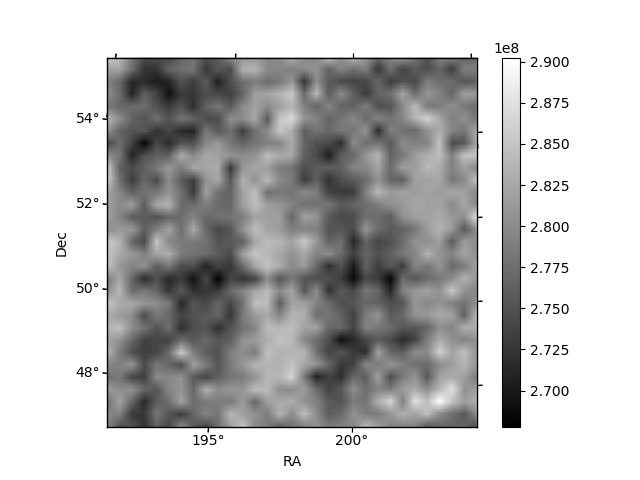
Histogram calculated using DETX and DETY for each event in the final _common_clean file
| Quadrant A | 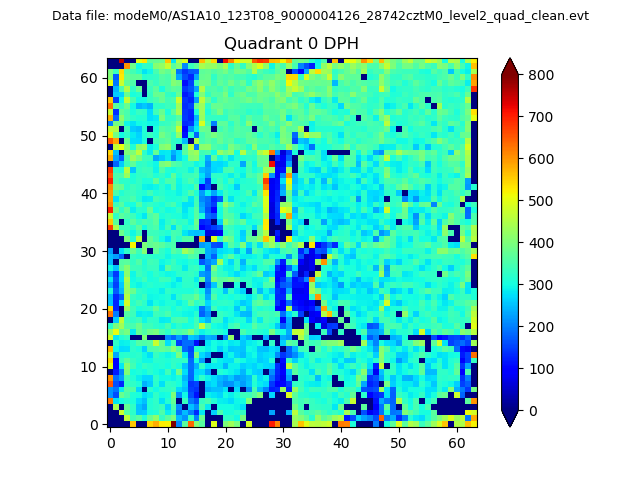 |
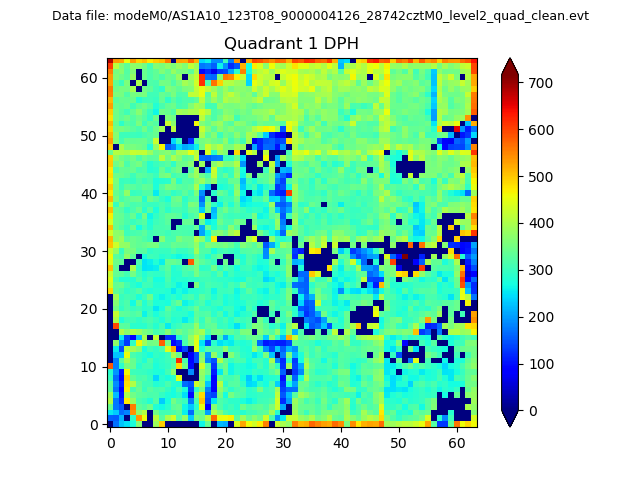 |
Quadrant B |
|---|---|---|---|
| Quadrant D | 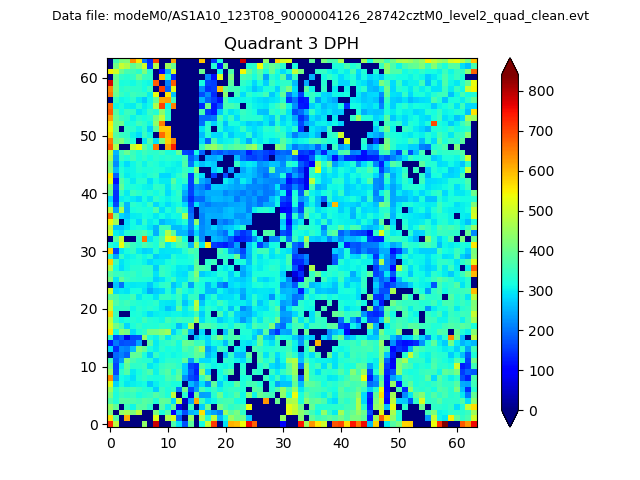 |
 |
Quadrant C |
| Plot type | Count rate plots | Images |
|---|---|---|
| Comparison with Poisson distribution Blue bars denote a histogram of data divided into 1 sec bins. Red curve is a Poisson curve with rate = median count rate of data. |
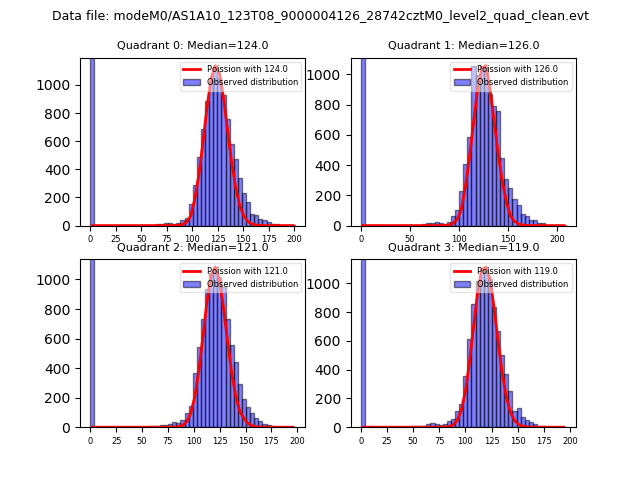 |
 |
| Quadrant-wise count rates Data is divided into 100 sec bins |
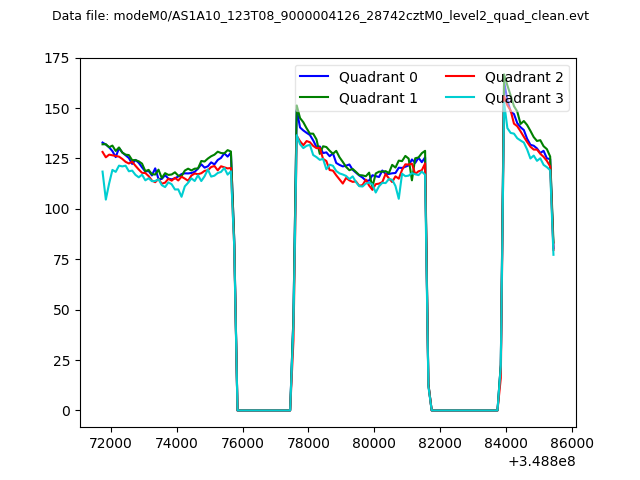 |
|
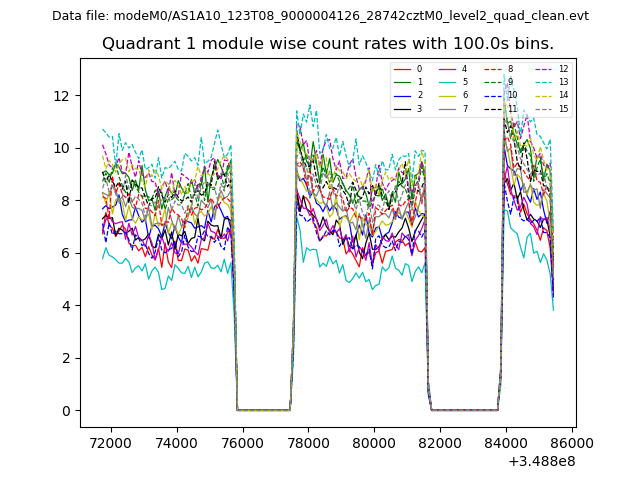
| Module-wise count rates for Quadrant A Data is divided into 100 sec bins |
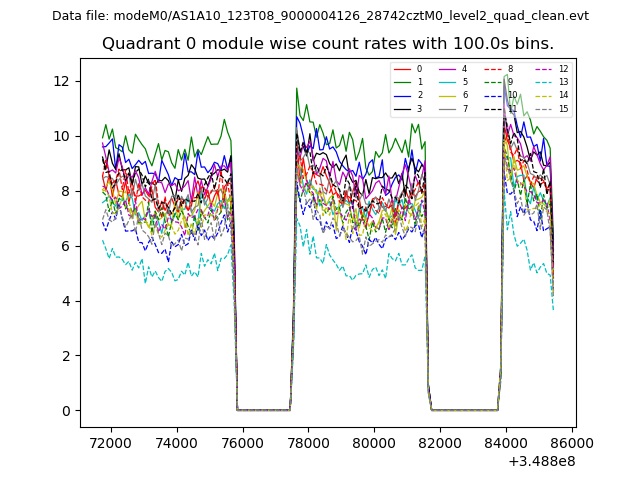 |
 |
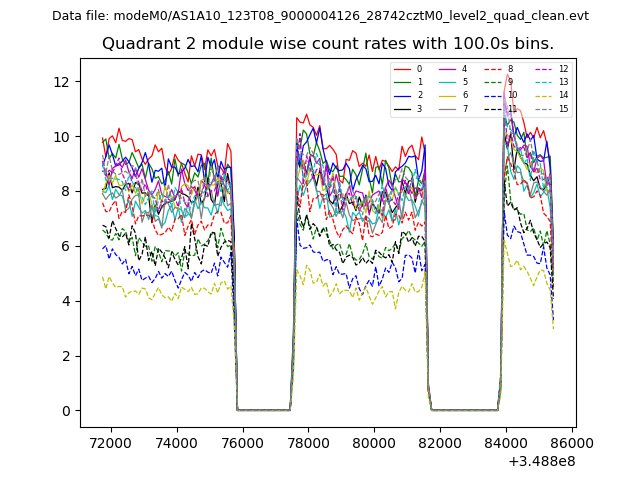
| Module-wise count rates for Quadrant B Data is divided into 100 sec bins |
 |
 |
| Module-wise count rates for Quadrant C Data is divided into 100 sec bins |
 |
 |
| Module-wise count rates for Quadrant D Data is divided into 100 sec bins |
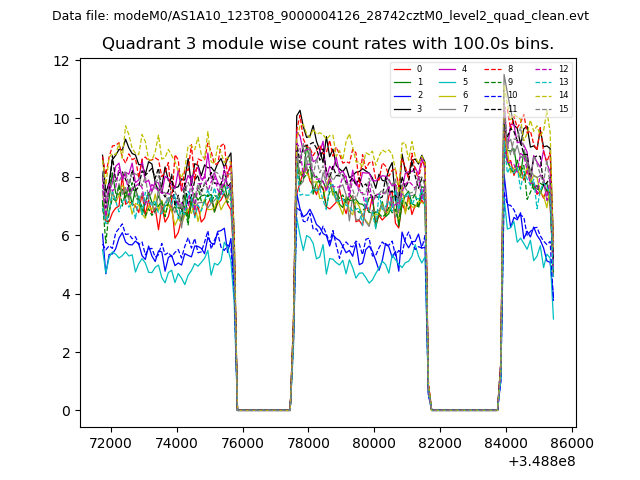 |
 |
| Parameter | Plot |
|---|---|
| CZT HV Monitor | 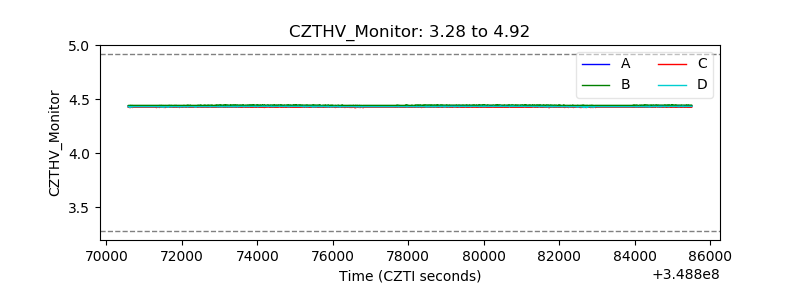 |
| D_VDD | 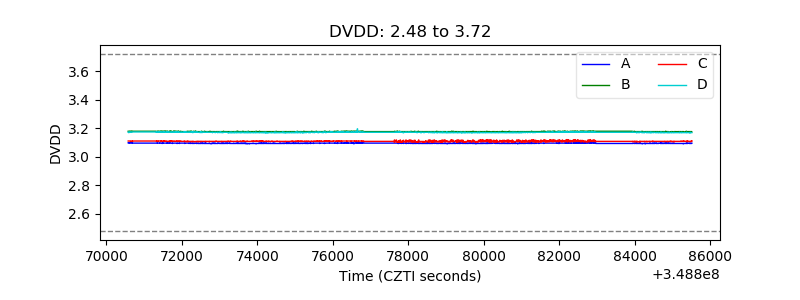 |
| Temperature 1 |  |
| Veto HV Monitor | 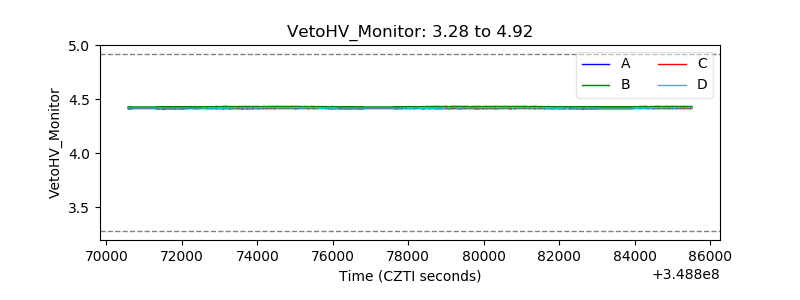 |
| Veto LLD |  |
| Alpha Counter | 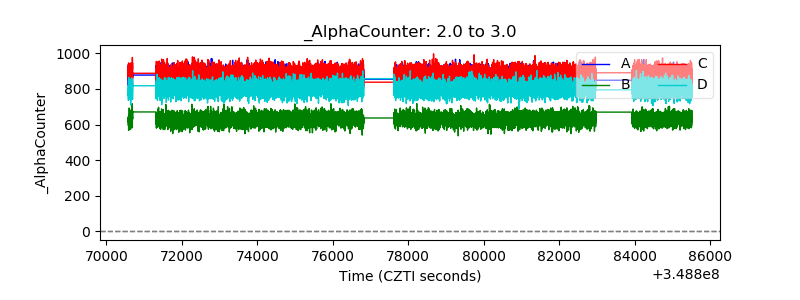 |
| _CPM_Rate | 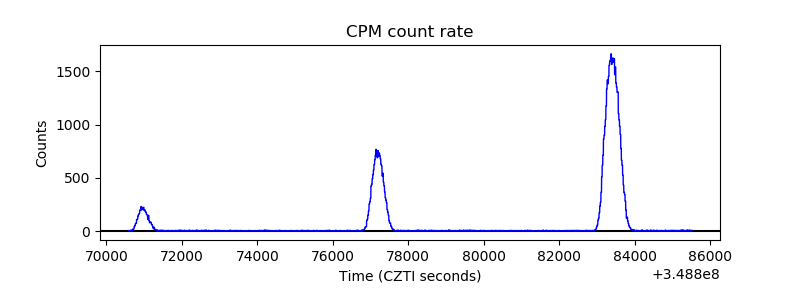 |
| CZT Counter | 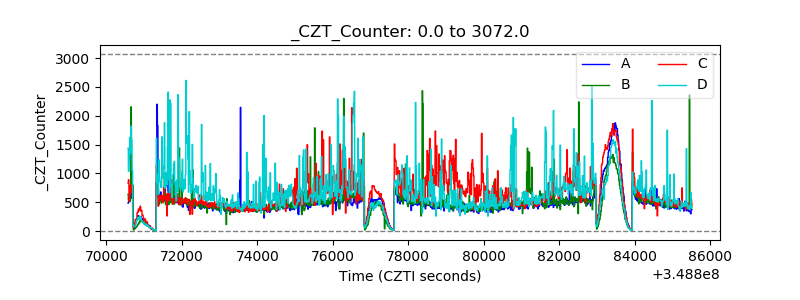 |
| +2.5 Volts monitor |  |
| +5 Volts monitor |  |
| _ROLL_ROT | 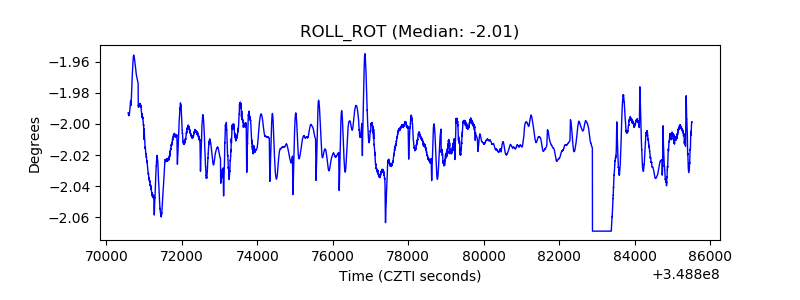 |
| _Roll_DEC | 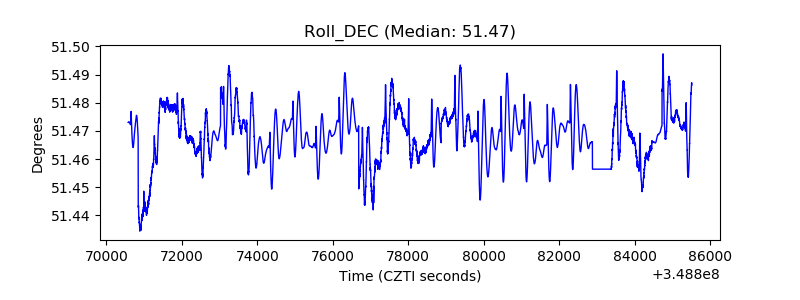 |
| _Roll_RA | 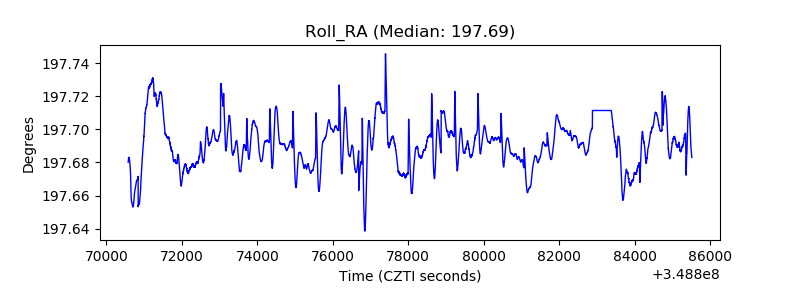 |
| Veto Counter | 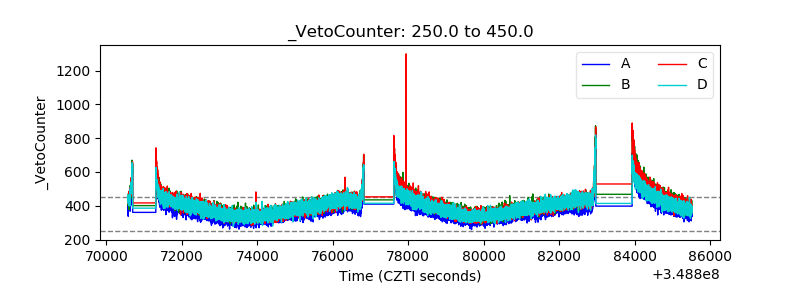 |