| Param | Original file | Final file |
|---|---|---|
| Filename | modeM0/AS1A10_123T08_9000004126_28744cztM0_level2.evt | modeM0/AS1A10_123T08_9000004126_28744cztM0_level2_quad_clean.evt |
| Size (bytes) | 561,916,800 | 102,438,720 |
| Size | 535.9 MB | 97.7 MB |
| Events in quadrant A | 3,064,463 | 671,483 |
| Events in quadrant B | 3,578,952 | 687,349 |
| Events in quadrant C | 5,126,839 | 655,001 |
| Events in quadrant D | 4,801,950 | 630,028 |
| Mode M0 | |||
|---|---|---|---|
| Quadrant | BADHDUFLAG | Total packets | Discarded packets |
| A | 0 | 13481 | 1 |
| B | 0 | 14951 | 1 |
| C | 0 | 19579 | 1 |
| D | 0 | 18896 | 1 |
| Mode SS | |||
|---|---|---|---|
| Quadrant | BADHDUFLAG | Total packets | Discarded packets |
| A | 0 | 134 | 0 |
| B | 0 | 134 | 0 |
| C | 0 | 134 | 0 |
| D | 0 | 134 | 0 |
| Mode M9 | |||
|---|---|---|---|
| Quadrant | BADHDUFLAG | Total packets | Discarded packets |
| A | 0 | 11 | 0 |
| B | 0 | 11 | 0 |
| C | 0 | 11 | 0 |
| D | 0 | 11 | 0 |
| Quadrant | Total seconds | Saturated seconds | Saturation percentage |
|---|---|---|---|
| A | 6572 | 18 | 0.273889% |
| B | 6573 | 83 | 1.262742% |
| C | 6573 | 587 | 8.930473% |
| D | 6573 | 238 | 3.620873% |
Noise dominated data is calculated using 1-second bins in cleaned event files. If a bin has >2000 counts, and if more than 50% of those come from <1% of pixels, then it is considered to be noise-dominated and hence unusable.
| Quadrant | # 1 sec bins | Bins with >0 counts | Bins with >2000 counts | High rate bins dominated by noise | Noise dominated (total time) | Noise dominated (detector-on time) | Marked lightcurve |
|---|---|---|---|---|---|---|---|
| A | 7692 | 6572 | 0 | 0 | 0.00% | 0.00% | 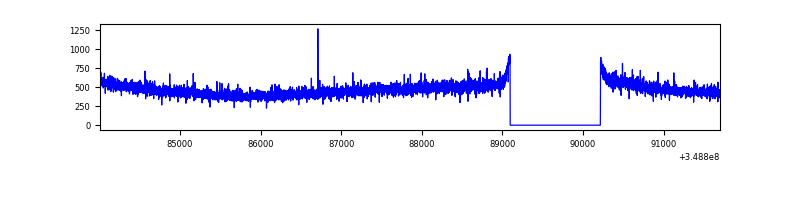 |
| B | 7693 | 6573 | 25 | 25 | 0.32% | 0.38% | 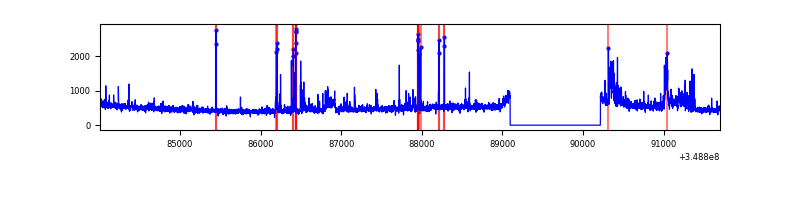 |
| C | 7693 | 6573 | 186 | 186 | 2.42% | 2.83% | 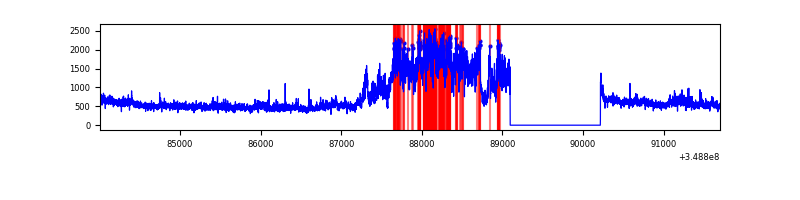 |
| D | 7693 | 6573 | 215 | 215 | 2.79% | 3.27% | 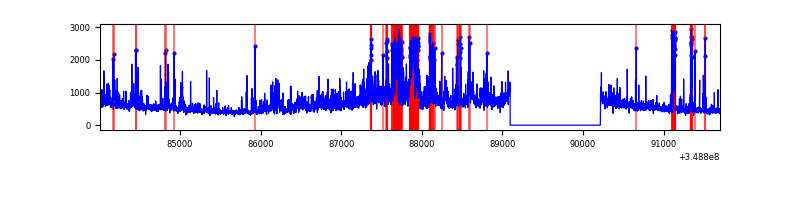 |
Top three noisy pixels from each quadrant. If the there are fewer than three noisy pixels in the level2.evt file, extra rows are filled as -1
| Pixel properties | Quadrant properties | ||||||
|---|---|---|---|---|---|---|---|
| Quadrant | DetID | PixID | Counts | Sigma | Mean | Median | Sigma |
| A | 13 | 254 | 13352 | 79.39 | 791 | 776 | 158.4 |
| A | 3 | 137 | 7384 | 41.72 | 791 | 776 | 158.4 |
| A | 0 | 226 | 6778 | 37.89 | 791 | 776 | 158.4 |
| B | 10 | 245 | 247679 | 1653.69 | 790 | 771 | 149.3 |
| B | 4 | 80 | 124655 | 829.72 | 790 | 771 | 149.3 |
| B | 5 | 255 | 83404 | 553.44 | 790 | 771 | 149.3 |
| C | 3 | 233 | 2078312 | 11934.29 | 746 | 750 | 174.1 |
| C | 14 | 238 | 128898 | 736.13 | 746 | 750 | 174.1 |
| C | 14 | 254 | 11798 | 63.46 | 746 | 750 | 174.1 |
| D | 8 | 195 | 1006109 | 5626.69 | 751 | 731 | 178.7 |
| D | 1 | 52 | 914153 | 5112.05 | 751 | 731 | 178.7 |
| D | 2 | 234 | 27845 | 151.75 | 751 | 731 | 178.7 |
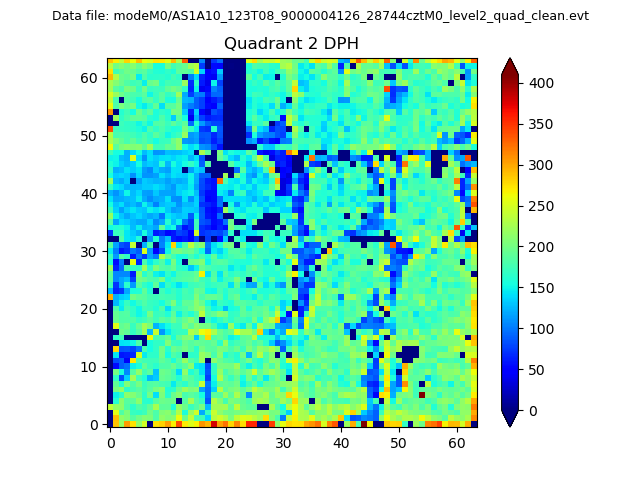
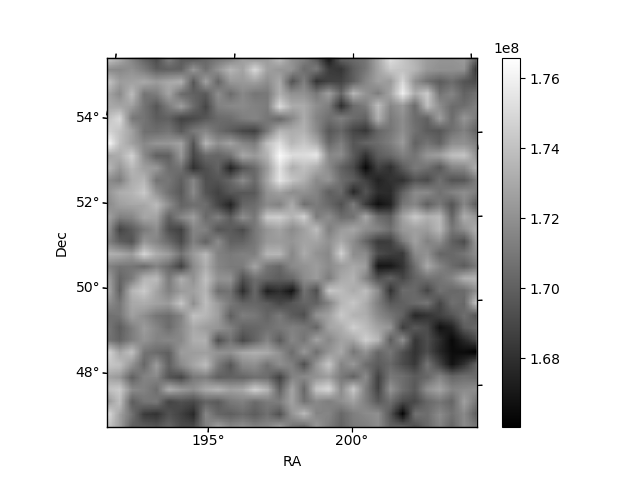
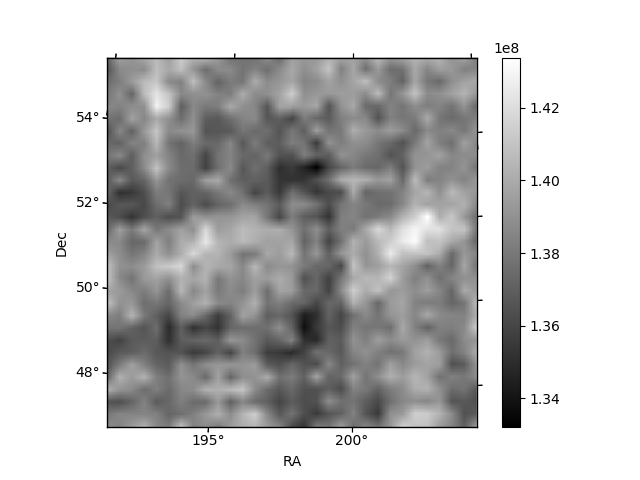
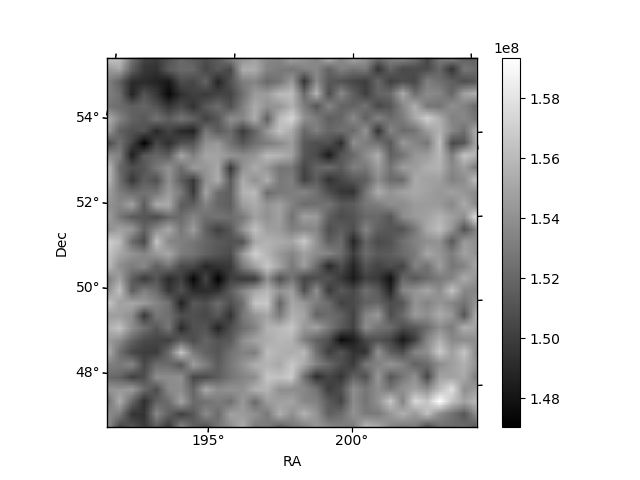
Histogram calculated using DETX and DETY for each event in the final _common_clean file
| Quadrant A | 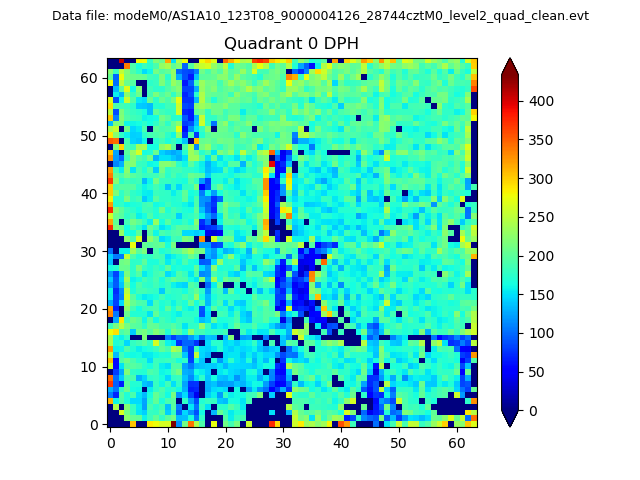 |
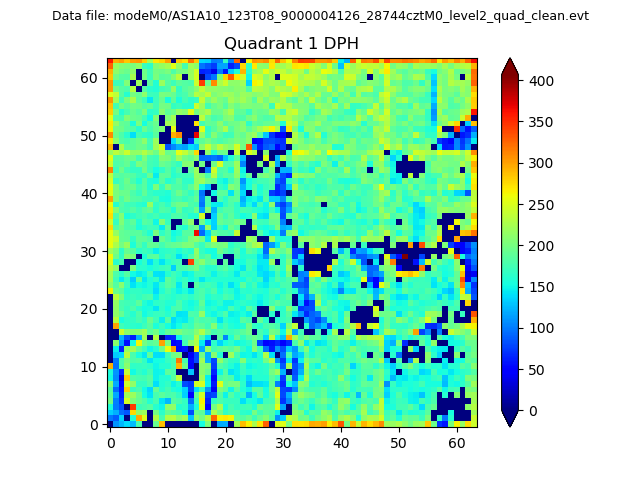 |
Quadrant B |
|---|---|---|---|
| Quadrant D | 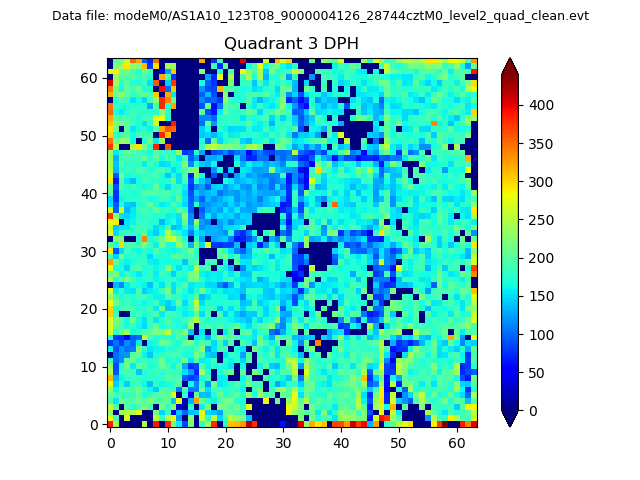 |
 |
Quadrant C |
| Plot type | Count rate plots | Images |
|---|---|---|
| Comparison with Poisson distribution Blue bars denote a histogram of data divided into 1 sec bins. Red curve is a Poisson curve with rate = median count rate of data. |
 |
 |
| Quadrant-wise count rates Data is divided into 100 sec bins |
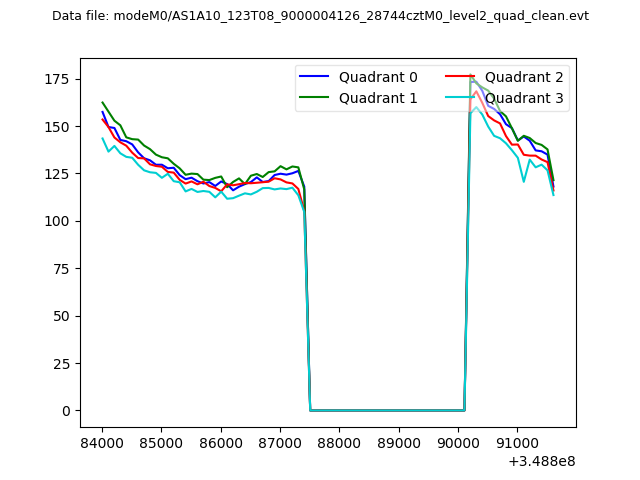 |
|
| Module-wise count rates for Quadrant A Data is divided into 100 sec bins |
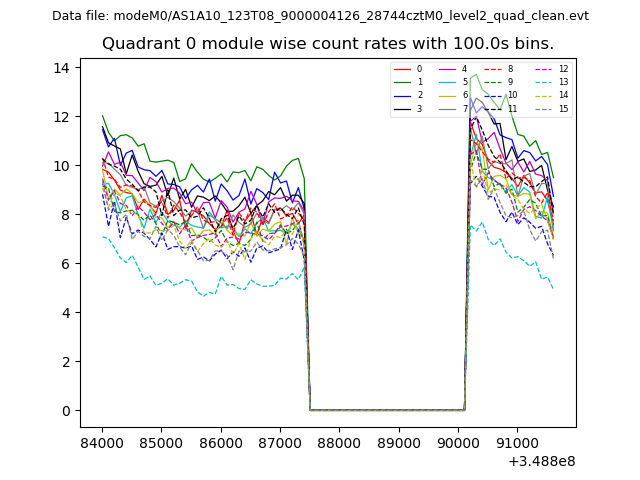 |
 |
| Module-wise count rates for Quadrant B Data is divided into 100 sec bins |
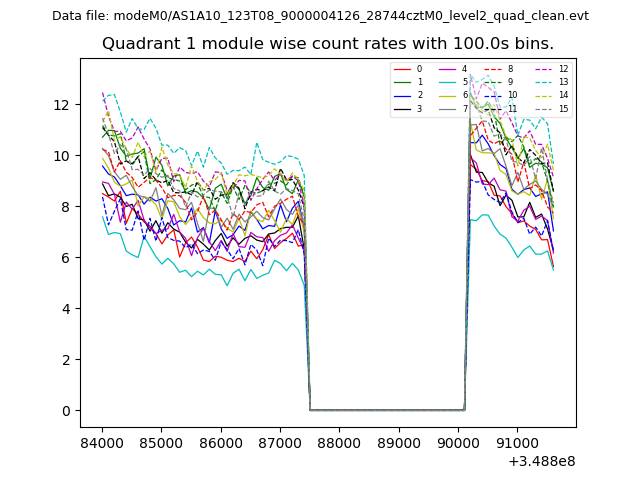 |
 |
| Module-wise count rates for Quadrant C Data is divided into 100 sec bins |
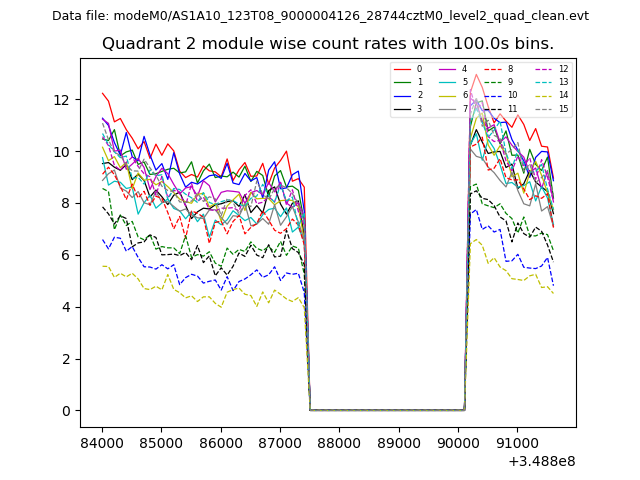 |
 |
| Module-wise count rates for Quadrant D Data is divided into 100 sec bins |
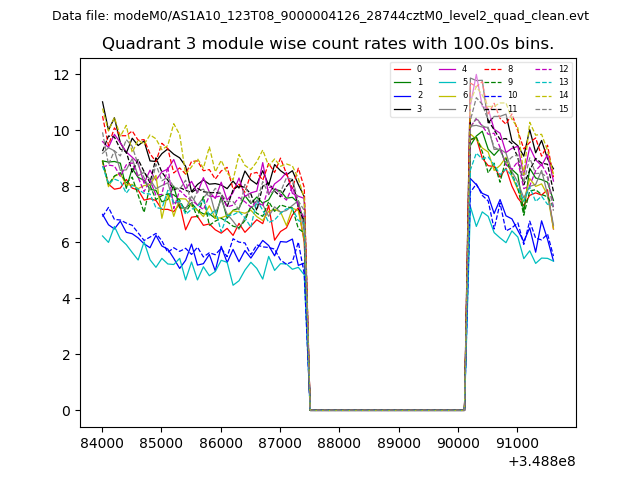 |
 |
| Parameter | Plot |
|---|---|
| CZT HV Monitor |  |
| D_VDD |  |
| Temperature 1 | 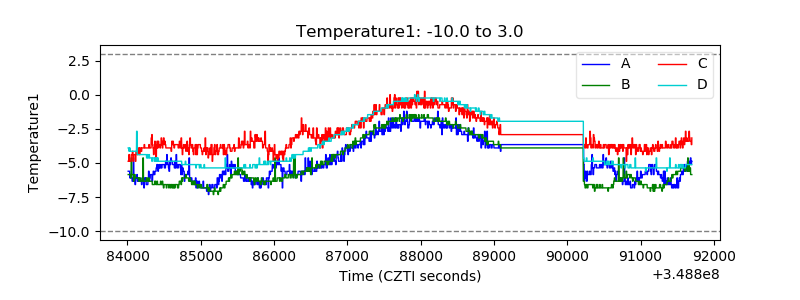 |
| Veto HV Monitor |  |
| Veto LLD | 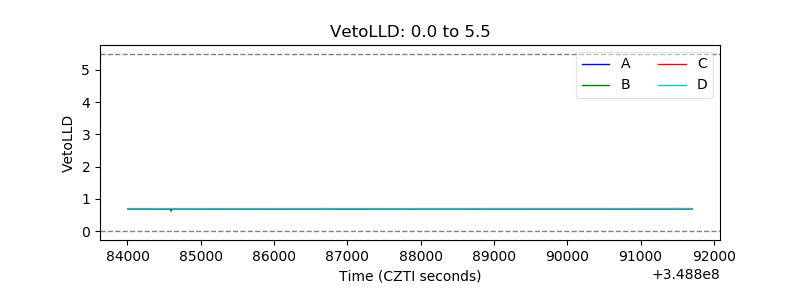 |
| Alpha Counter | 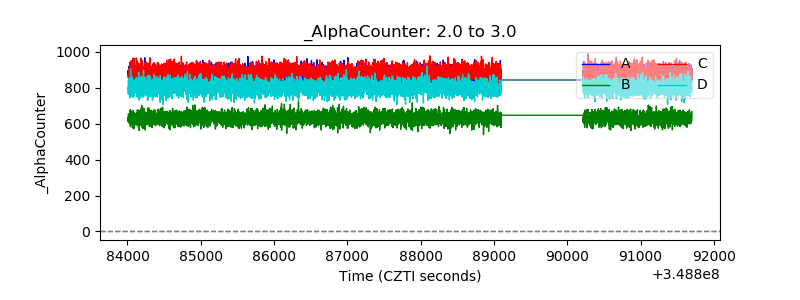 |
| _CPM_Rate | 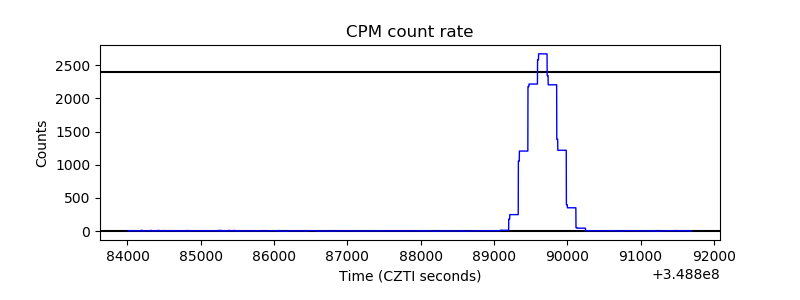 |
| CZT Counter | 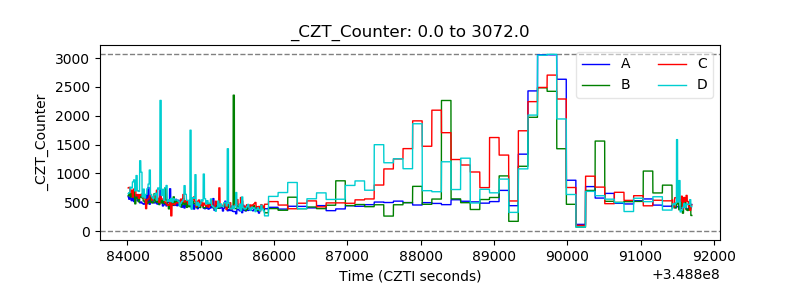 |
| +2.5 Volts monitor |  |
| +5 Volts monitor |  |
| _ROLL_ROT | 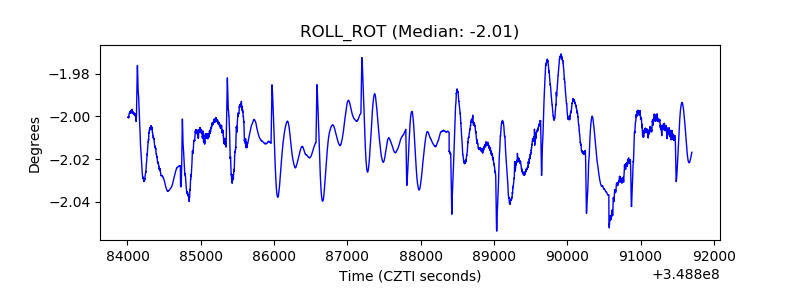 |
| _Roll_DEC | 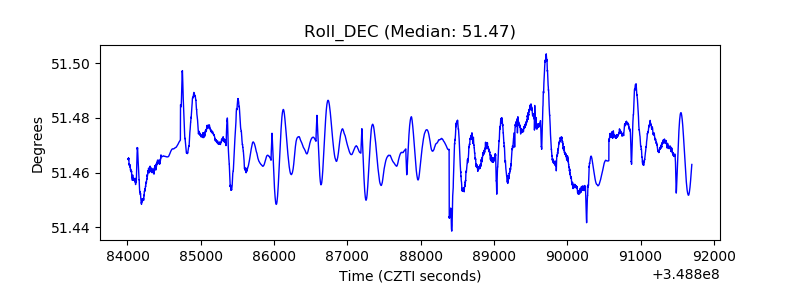 |
| _Roll_RA |  |
| Veto Counter | 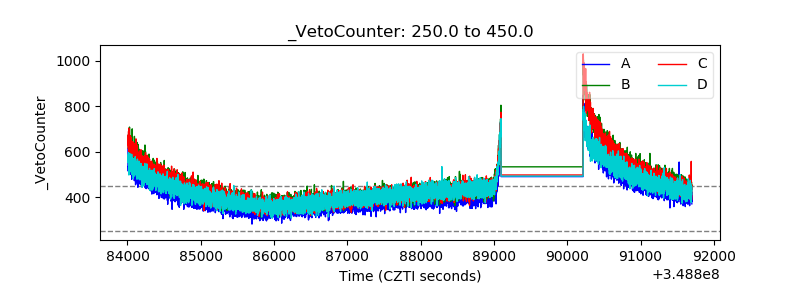 |