| Param | Original file | Final file |
|---|---|---|
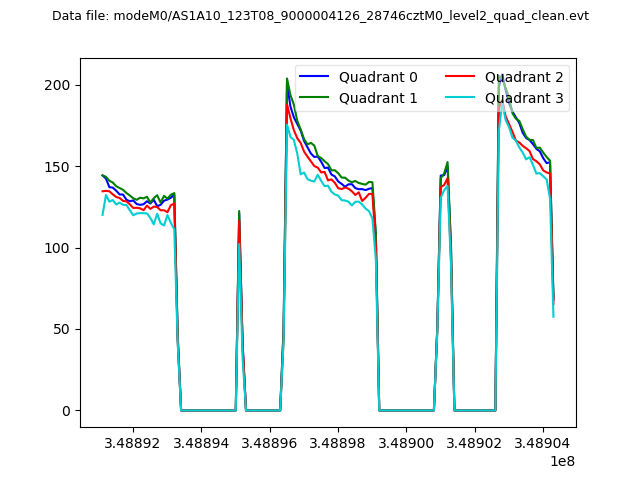
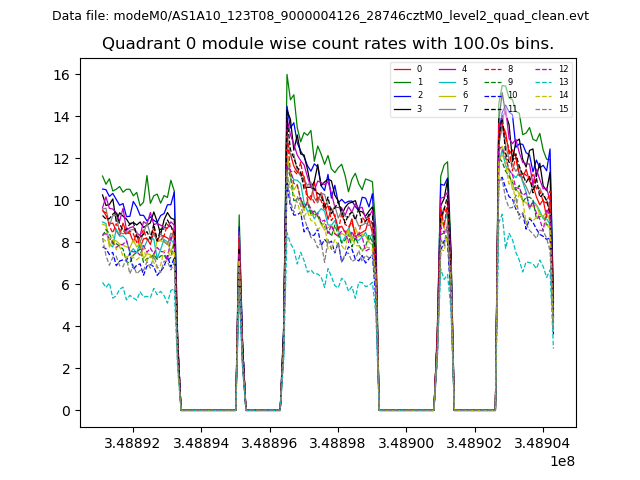
| Filename | modeM0/AS1A10_123T08_9000004126_28746cztM0_level2.evt | modeM0/AS1A10_123T08_9000004126_28746cztM0_level2_quad_clean.evt |
| Size (bytes) | 869,754,240 | 161,006,400 |
| Size | 829.5 MB | 153.5 MB |
| Events in quadrant A | 5,427,388 | 1,064,539 |
| Events in quadrant B | 5,803,414 | 1,082,678 |
| Events in quadrant C | 5,738,812 | 1,020,795 |
| Events in quadrant D | 8,651,829 | 971,701 |
| Mode M0 | |||
|---|---|---|---|
| Quadrant | BADHDUFLAG | Total packets | Discarded packets |
| A | 0 | 22629 | 2 |
| B | 0 | 23803 | 2 |
| C | 0 | 23445 | 2 |
| D | 0 | 33087 | 2 |
| Mode SS | |||
|---|---|---|---|
| Quadrant | BADHDUFLAG | Total packets | Discarded packets |
| A | 0 | 214 | 0 |
| B | 0 | 214 | 0 |
| C | 0 | 214 | 0 |
| D | 0 | 214 | 0 |
| Mode M9 | |||
|---|---|---|---|
| Quadrant | BADHDUFLAG | Total packets | Discarded packets |
| A | 0 | 27 | 0 |
| B | 0 | 27 | 0 |
| C | 0 | 27 | 0 |
| D | 0 | 27 | 0 |
| Quadrant | Total seconds | Saturated seconds | Saturation percentage |
|---|---|---|---|
| A | 10653 | 118 | 1.107669% |
| B | 10652 | 128 | 1.201652% |
| C | 10652 | 109 | 1.023282% |
| D | 10653 | 567 | 5.322444% |
Noise dominated data is calculated using 1-second bins in cleaned event files. If a bin has >2000 counts, and if more than 50% of those come from <1% of pixels, then it is considered to be noise-dominated and hence unusable.
| Quadrant | # 1 sec bins | Bins with >0 counts | Bins with >2000 counts | High rate bins dominated by noise | Noise dominated (total time) | Noise dominated (detector-on time) | Marked lightcurve |
|---|---|---|---|---|---|---|---|
| A | 13248 | 10654 | 90 | 90 | 0.68% | 0.84% | 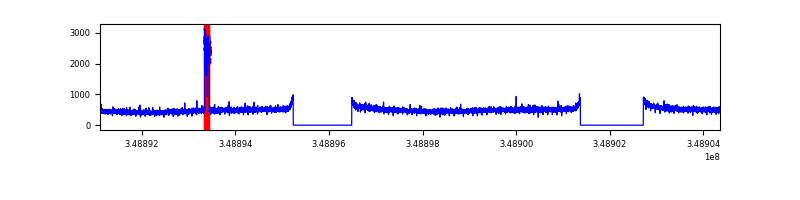 |
| B | 13247 | 10653 | 57 | 57 | 0.43% | 0.54% | 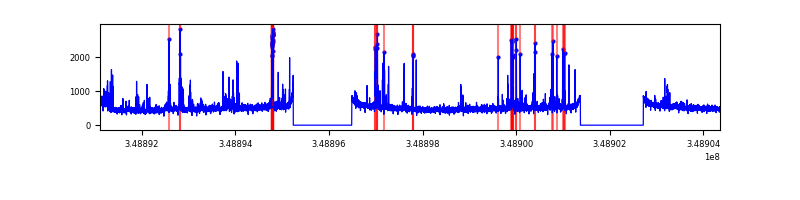 |
| C | 13247 | 10654 | 0 | 0 | 0.00% | 0.00% | 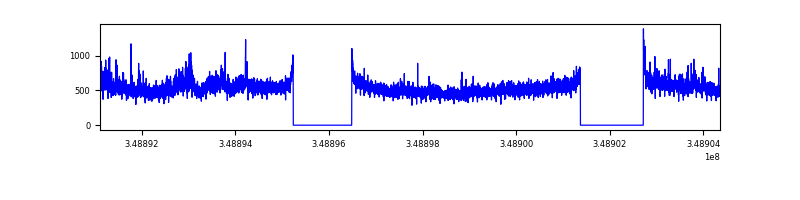 |
| D | 13248 | 10655 | 448 | 448 | 3.38% | 4.20% | 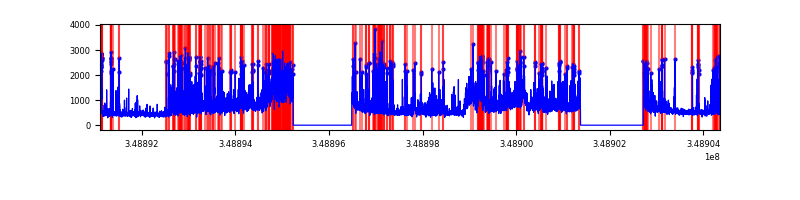 |
Top three noisy pixels from each quadrant. If the there are fewer than three noisy pixels in the level2.evt file, extra rows are filled as -1
| Pixel properties | Quadrant properties | ||||||
|---|---|---|---|---|---|---|---|
| Quadrant | DetID | PixID | Counts | Sigma | Mean | Median | Sigma |
| A | 4 | 2 | 215229 | 805.58 | 1349 | 1326 | 265.5 |
| A | 13 | 254 | 23296 | 82.74 | 1349 | 1326 | 265.5 |
| A | 3 | 137 | 11967 | 40.08 | 1349 | 1326 | 265.5 |
| B | 5 | 255 | 359230 | 1463.64 | 1331 | 1301 | 244.5 |
| B | 10 | 245 | 144504 | 585.59 | 1331 | 1301 | 244.5 |
| B | 12 | 111 | 29272 | 114.38 | 1331 | 1301 | 244.5 |
| C | 3 | 233 | 542402 | 1858.6 | 1273 | 1284 | 291.1 |
| C | 14 | 238 | 220351 | 752.44 | 1273 | 1284 | 291.1 |
| C | 14 | 254 | 15297 | 48.13 | 1273 | 1284 | 291.1 |
| D | 1 | 52 | 2647056 | 9072.06 | 1262 | 1229 | 291.6 |
| D | 8 | 195 | 1019090 | 3490.06 | 1262 | 1229 | 291.6 |
| D | 12 | 233 | 171215 | 582.85 | 1262 | 1229 | 291.6 |
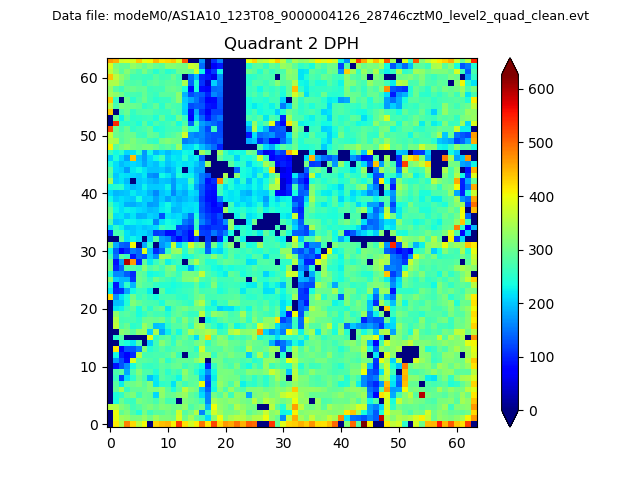
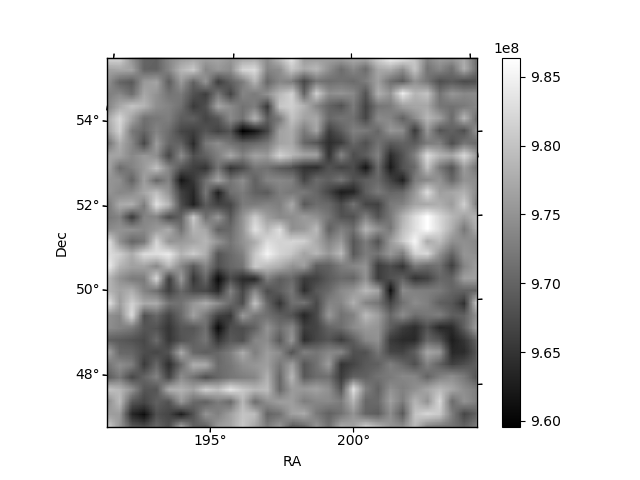
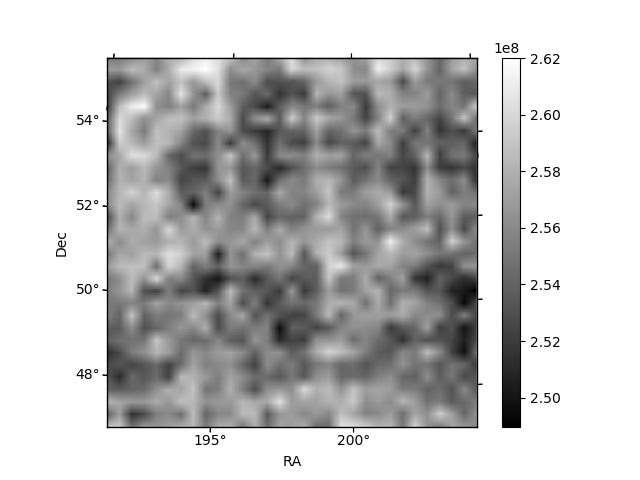
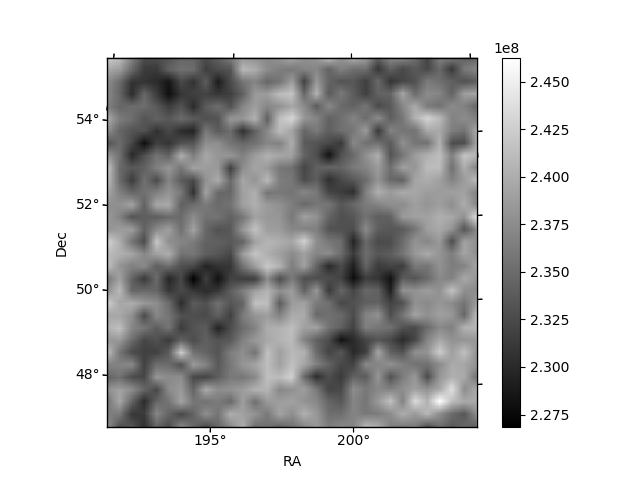
Histogram calculated using DETX and DETY for each event in the final _common_clean file
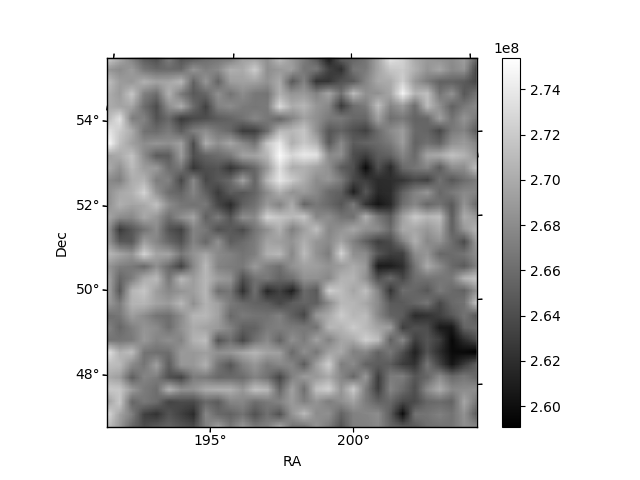
| Quadrant A | 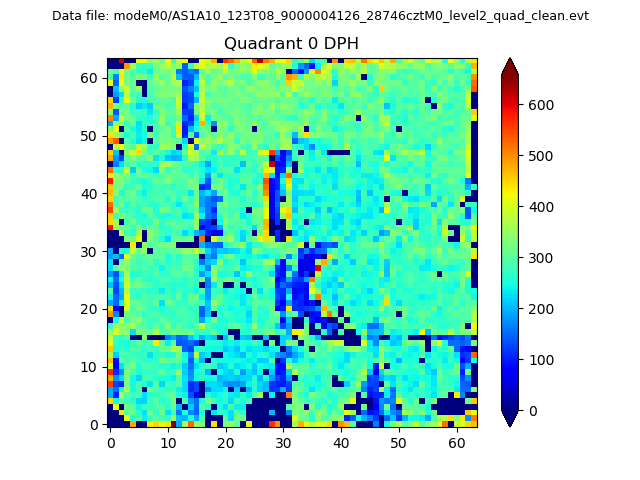 |
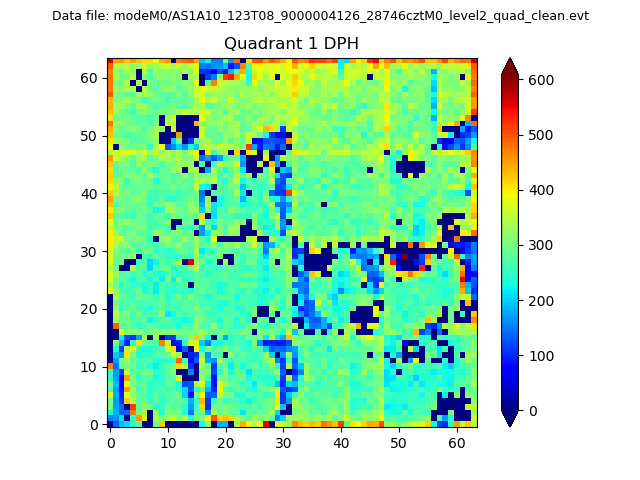 |
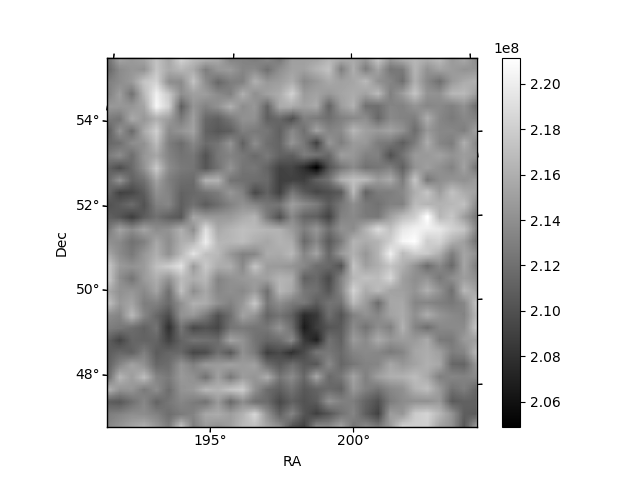
Quadrant B |
|---|---|---|---|
| Quadrant D | 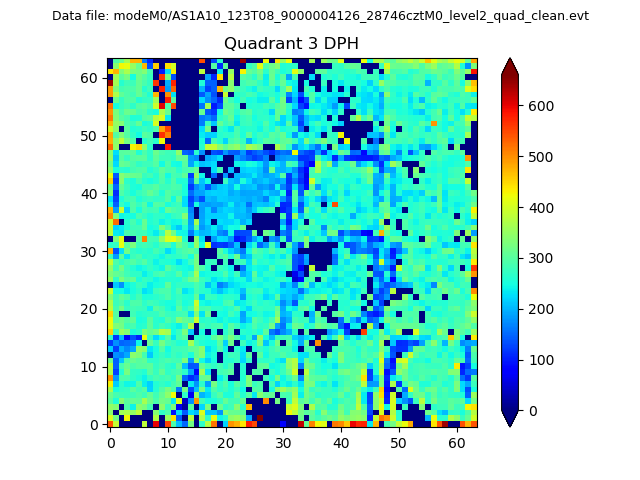 |
 |
Quadrant C |
| Plot type | Count rate plots | Images |
|---|---|---|
| Comparison with Poisson distribution Blue bars denote a histogram of data divided into 1 sec bins. Red curve is a Poisson curve with rate = median count rate of data. |
 |
 |
| Quadrant-wise count rates Data is divided into 100 sec bins |
 |
|
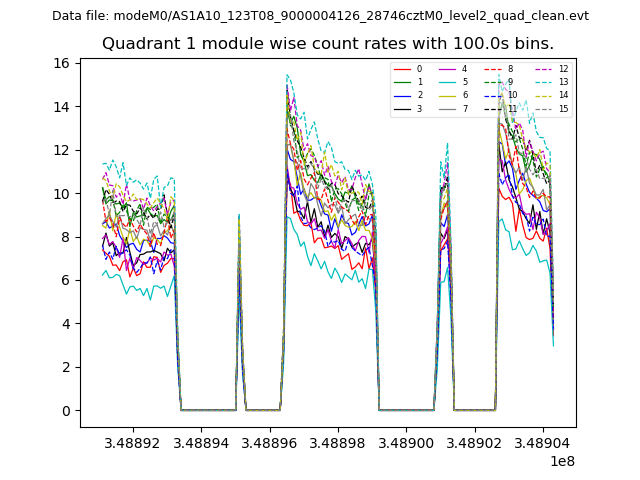
| Module-wise count rates for Quadrant A Data is divided into 100 sec bins |
 |
 |
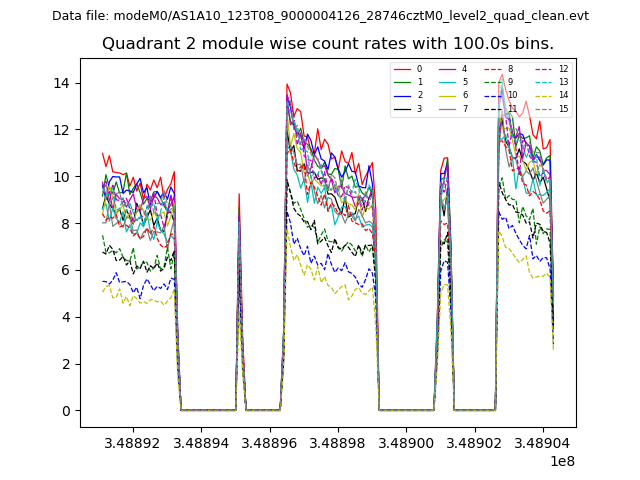
| Module-wise count rates for Quadrant B Data is divided into 100 sec bins |
 |
 |
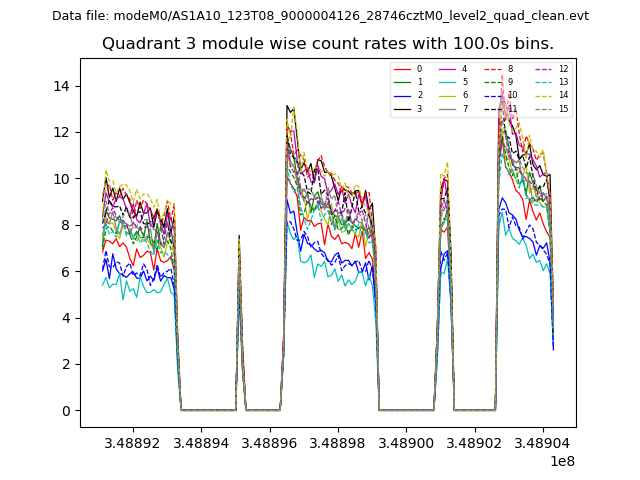
| Module-wise count rates for Quadrant C Data is divided into 100 sec bins |
 |
 |
| Module-wise count rates for Quadrant D Data is divided into 100 sec bins |
 |
 |
| Parameter | Plot |
|---|---|
| CZT HV Monitor | 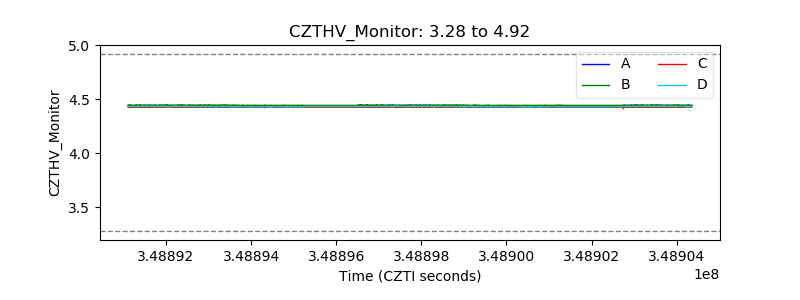 |
| D_VDD | 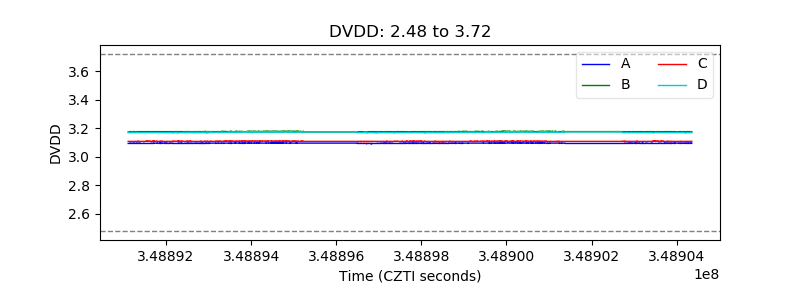 |
| Temperature 1 | 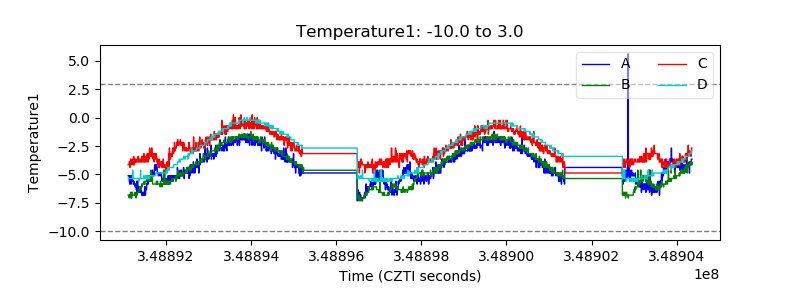 |
| Veto HV Monitor | 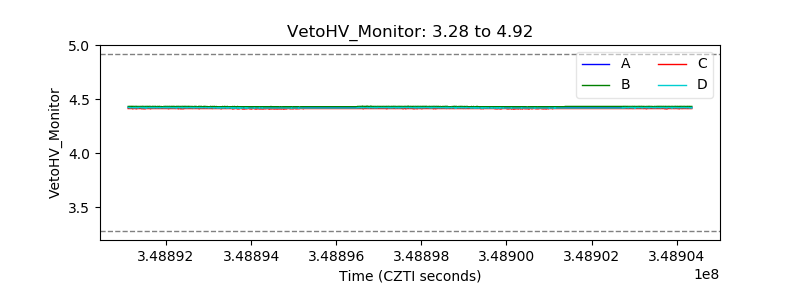 |
| Veto LLD | 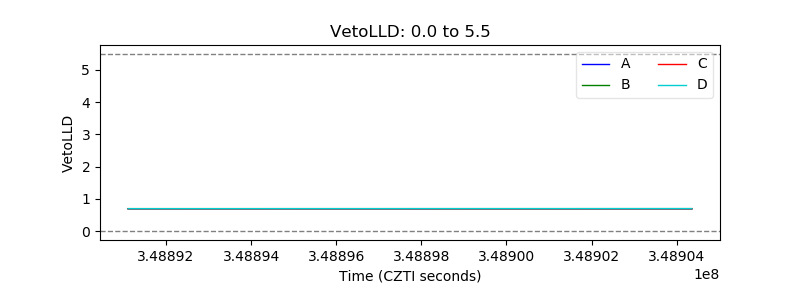 |
| Alpha Counter | 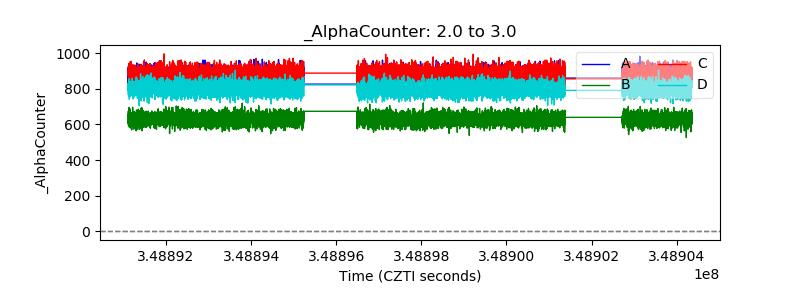 |
| _CPM_Rate | 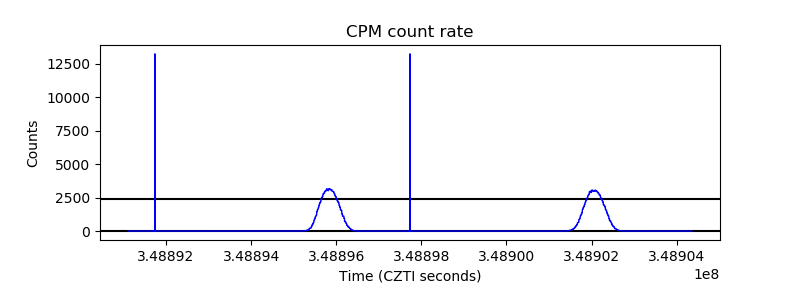 |
| CZT Counter | 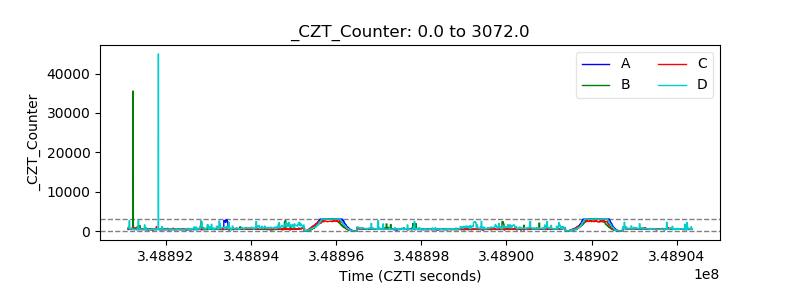 |
| +2.5 Volts monitor | 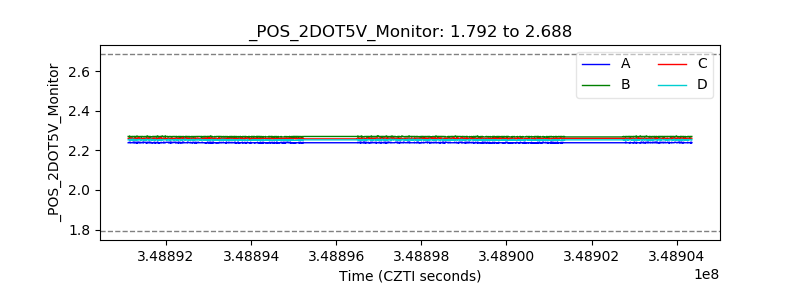 |
| +5 Volts monitor |  |
| _ROLL_ROT | 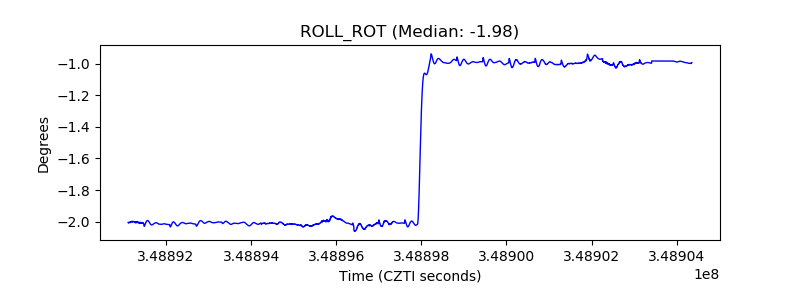 |
| _Roll_DEC | 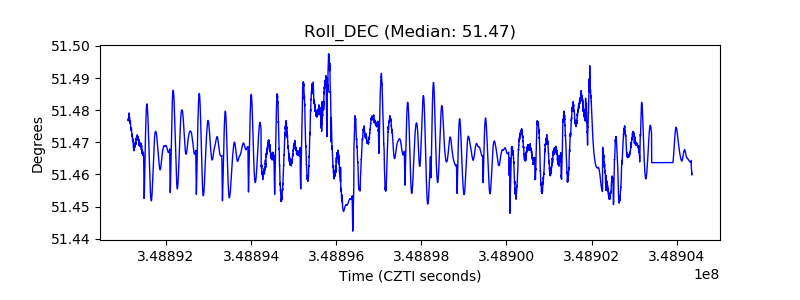 |
| _Roll_RA | 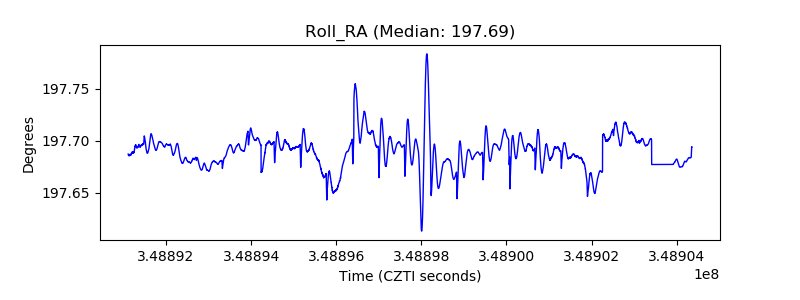 |
| Veto Counter | 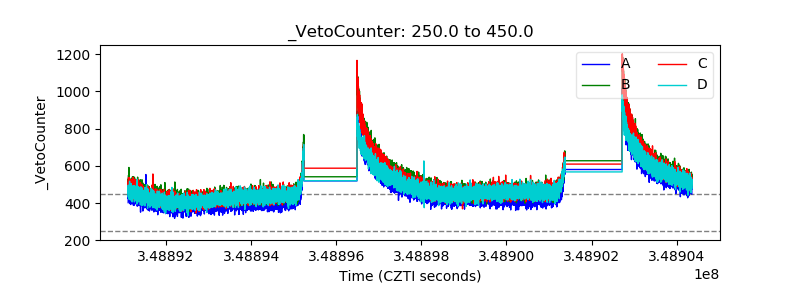 |