| Param | Original file | Final file |
|---|---|---|
| Filename | modeM0/AS1A10_123T08_9000004126_28747cztM0_level2.evt | modeM0/AS1A10_123T08_9000004126_28747cztM0_level2_quad_clean.evt |
| Size (bytes) | 521,994,240 | 109,990,080 |
| Size | 497.8 MB | 104.9 MB |
| Events in quadrant A | 3,307,225 | 747,847 |
| Events in quadrant B | 3,346,860 | 755,171 |
| Events in quadrant C | 3,748,353 | 704,179 |
| Events in quadrant D | 4,978,698 | 683,738 |
| Mode M0 | |||
|---|---|---|---|
| Quadrant | BADHDUFLAG | Total packets | Discarded packets |
| A | 0 | 13398 | 2 |
| B | 0 | 13559 | 2 |
| C | 0 | 15208 | 2 |
| D | 0 | 19257 | 2 |
| Mode SS | |||
|---|---|---|---|
| Quadrant | BADHDUFLAG | Total packets | Discarded packets |
| A | 0 | 130 | 0 |
| B | 0 | 130 | 0 |
| C | 0 | 130 | 0 |
| D | 0 | 130 | 0 |
| Mode M9 | |||
|---|---|---|---|
| Quadrant | BADHDUFLAG | Total packets | Discarded packets |
| A | 0 | 13 | 0 |
| B | 0 | 13 | 0 |
| C | 0 | 13 | 0 |
| D | 0 | 13 | 0 |
| Quadrant | Total seconds | Saturated seconds | Saturation percentage |
|---|---|---|---|
| A | 6301 | 36 | 0.571338% |
| B | 6302 | 63 | 0.999683% |
| C | 6302 | 100 | 1.586798% |
| D | 6302 | 260 | 4.125674% |
Noise dominated data is calculated using 1-second bins in cleaned event files. If a bin has >2000 counts, and if more than 50% of those come from <1% of pixels, then it is considered to be noise-dominated and hence unusable.
| Quadrant | # 1 sec bins | Bins with >0 counts | Bins with >2000 counts | High rate bins dominated by noise | Noise dominated (total time) | Noise dominated (detector-on time) | Marked lightcurve |
|---|---|---|---|---|---|---|---|
| A | 7651 | 6301 | 0 | 0 | 0.00% | 0.00% | 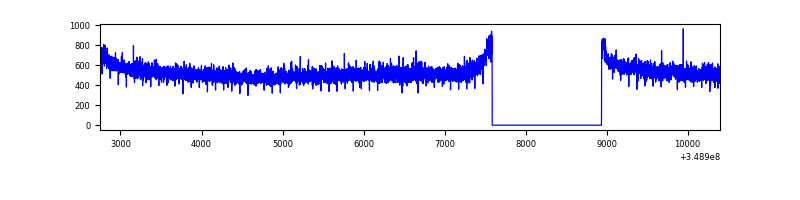 |
| B | 7652 | 6302 | 4 | 4 | 0.05% | 0.06% | 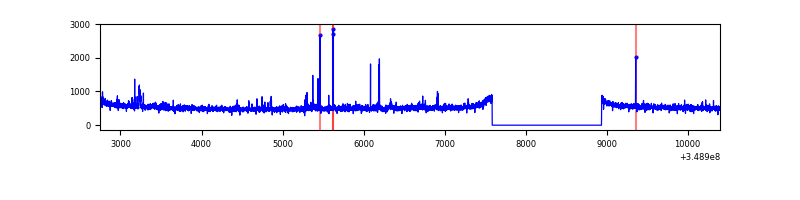 |
| C | 7652 | 6303 | 0 | 0 | 0.00% | 0.00% | 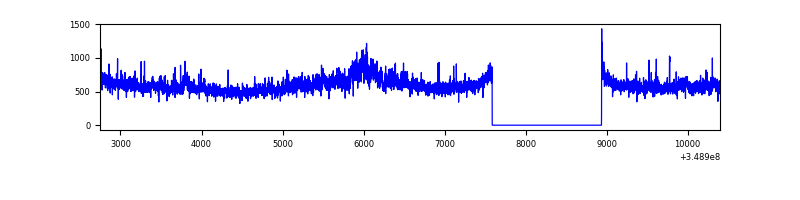 |
| D | 7652 | 6303 | 217 | 217 | 2.84% | 3.44% | 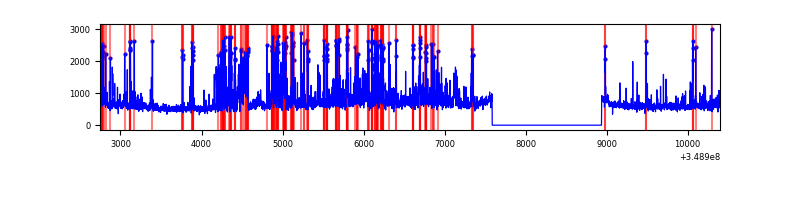 |
Top three noisy pixels from each quadrant. If the there are fewer than three noisy pixels in the level2.evt file, extra rows are filled as -1
| Pixel properties | Quadrant properties | ||||||
|---|---|---|---|---|---|---|---|
| Quadrant | DetID | PixID | Counts | Sigma | Mean | Median | Sigma |
| A | 13 | 254 | 12627 | 69.6 | 856 | 842 | 169.3 |
| A | 3 | 137 | 7522 | 39.45 | 856 | 842 | 169.3 |
| A | 0 | 226 | 7452 | 39.04 | 856 | 842 | 169.3 |
| B | 5 | 255 | 29572 | 186.49 | 835 | 817 | 154.2 |
| B | 12 | 111 | 17749 | 109.81 | 835 | 817 | 154.2 |
| B | 11 | 111 | 16278 | 100.27 | 835 | 817 | 154.2 |
| C | 3 | 233 | 480529 | 2659.43 | 795 | 801 | 180.4 |
| C | 14 | 238 | 140840 | 776.32 | 795 | 801 | 180.4 |
| C | 14 | 254 | 15153 | 79.56 | 795 | 801 | 180.4 |
| D | 1 | 52 | 960887 | 5170.04 | 799 | 781 | 185.7 |
| D | 8 | 195 | 884528 | 4758.86 | 799 | 781 | 185.7 |
| D | 12 | 233 | 55290 | 293.52 | 799 | 781 | 185.7 |
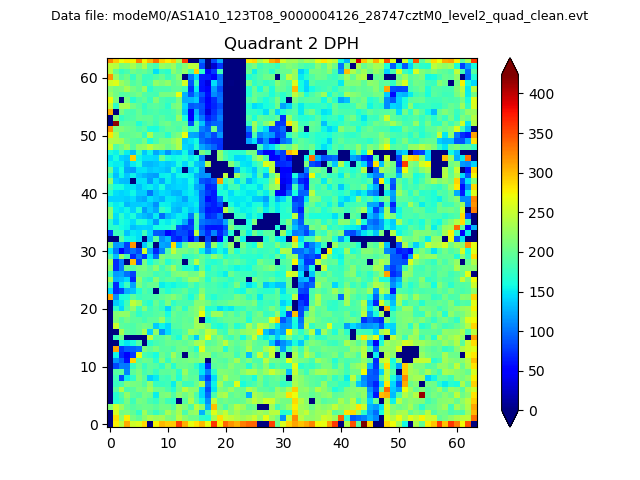
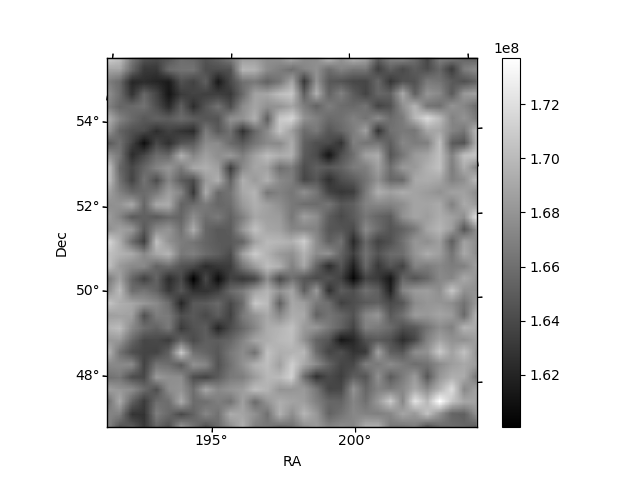
Histogram calculated using DETX and DETY for each event in the final _common_clean file
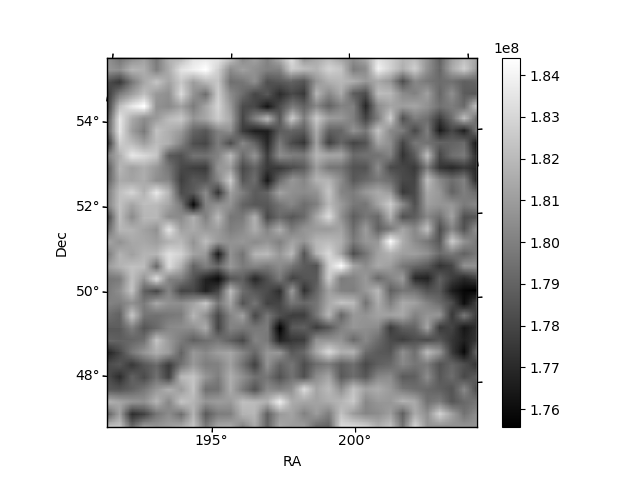
| Quadrant A | 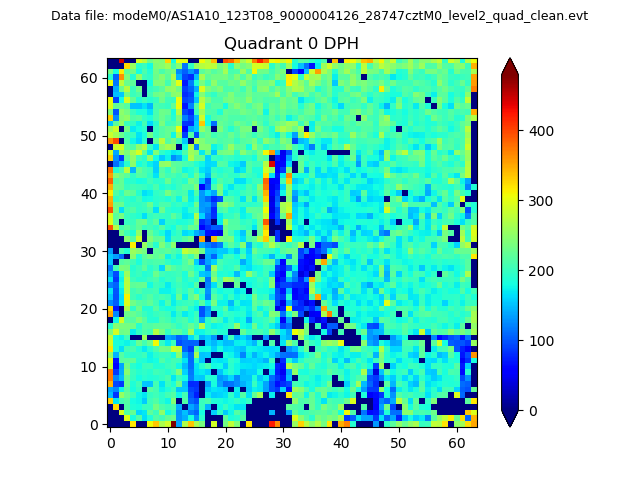 |
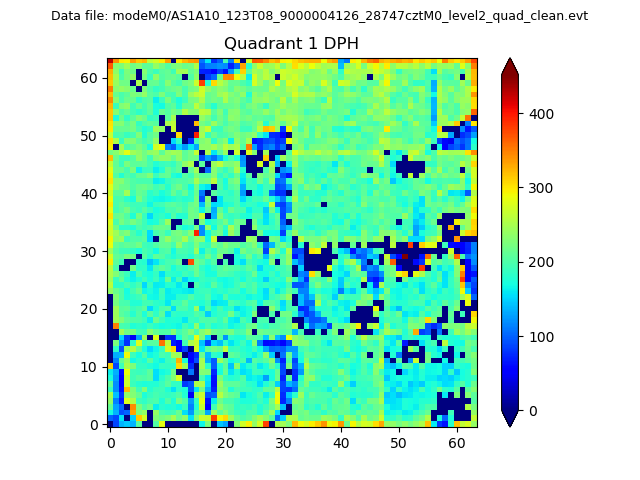 |
Quadrant B |
|---|---|---|---|
| Quadrant D | 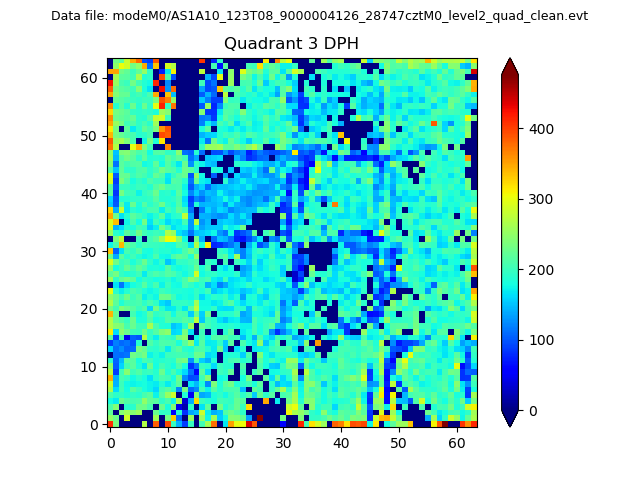 |
 |
Quadrant C |
| Plot type | Count rate plots | Images |
|---|---|---|
| Comparison with Poisson distribution Blue bars denote a histogram of data divided into 1 sec bins. Red curve is a Poisson curve with rate = median count rate of data. |
 |
 |
| Quadrant-wise count rates Data is divided into 100 sec bins |
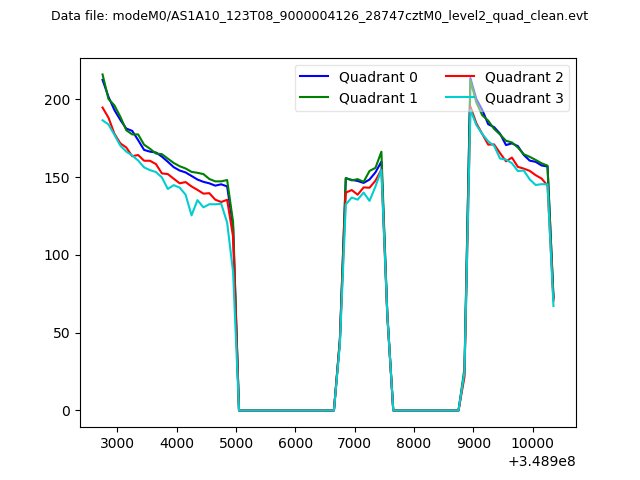 |
|
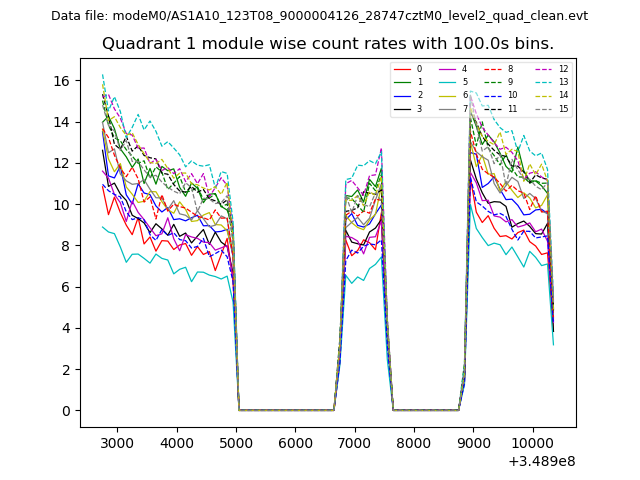
| Module-wise count rates for Quadrant A Data is divided into 100 sec bins |
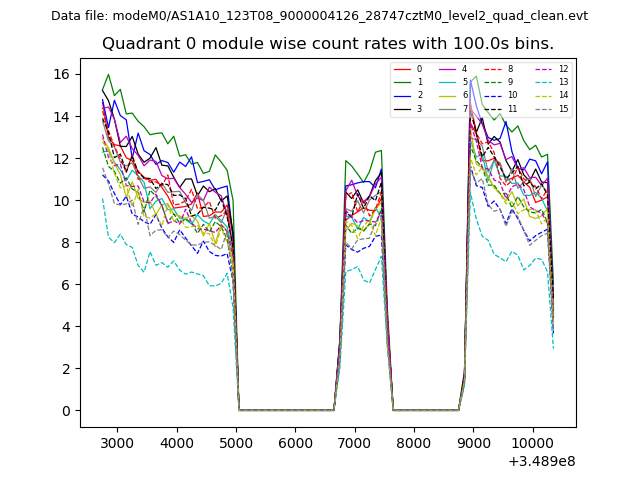 |
 |
| Module-wise count rates for Quadrant B Data is divided into 100 sec bins |
 |
 |
| Module-wise count rates for Quadrant C Data is divided into 100 sec bins |
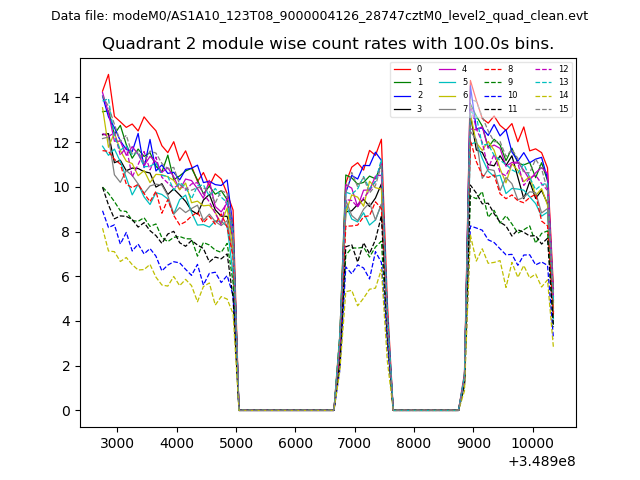 |
 |
| Module-wise count rates for Quadrant D Data is divided into 100 sec bins |
 |
 |
| Parameter | Plot |
|---|---|
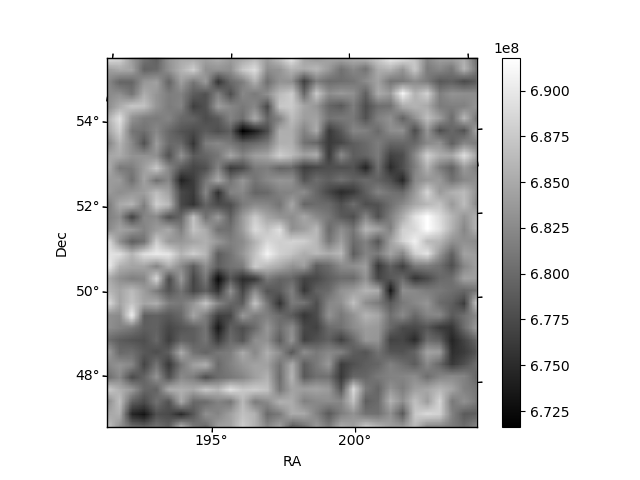
| CZT HV Monitor | 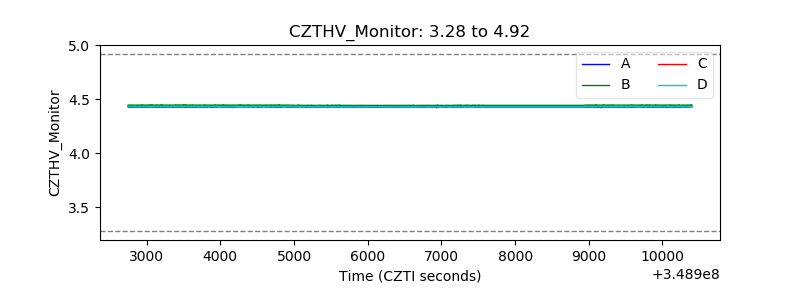 |
| D_VDD | 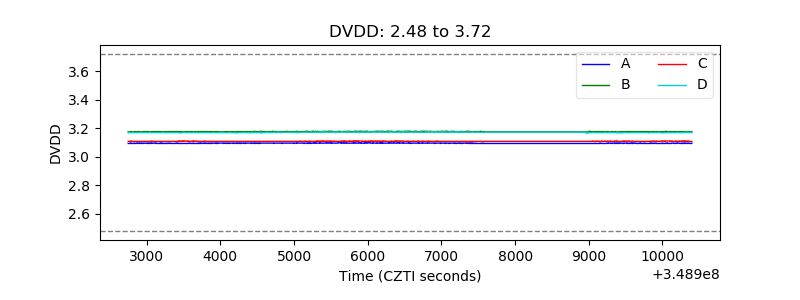 |
| Temperature 1 | 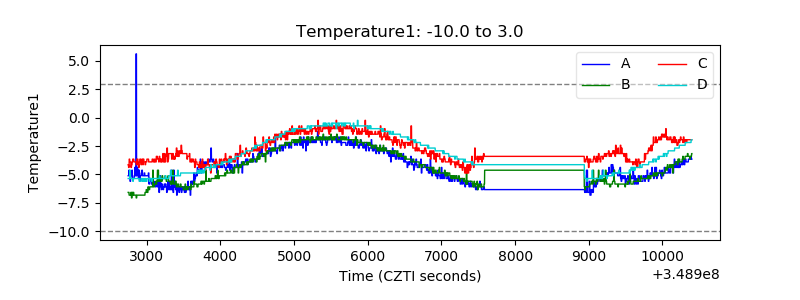 |
| Veto HV Monitor | 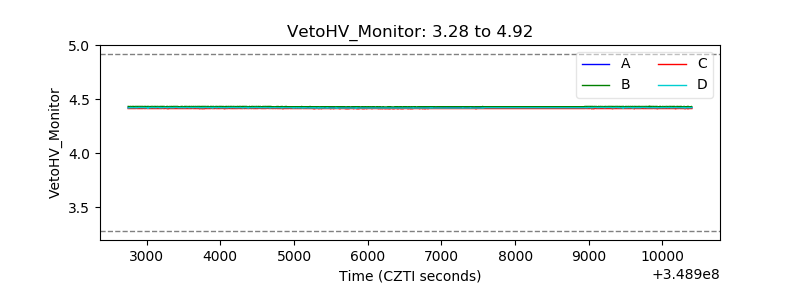 |
| Veto LLD | 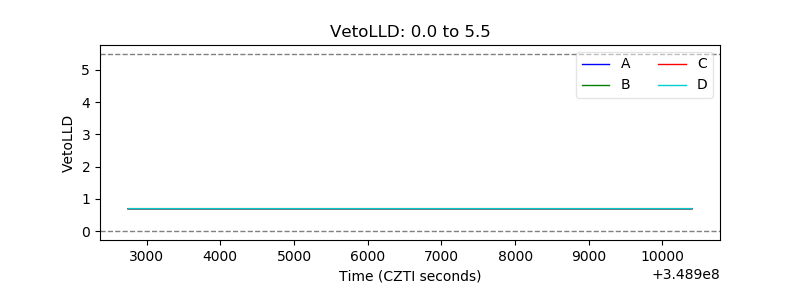 |
| Alpha Counter | 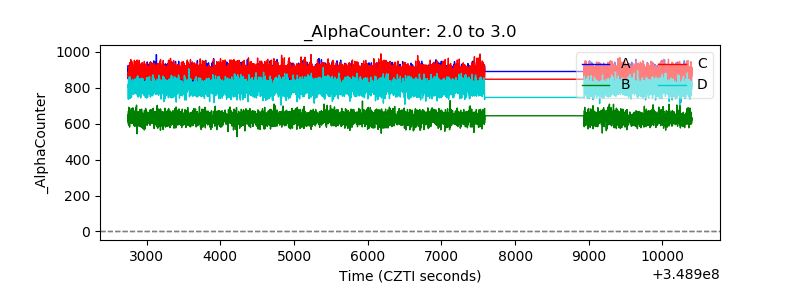 |
| _CPM_Rate | 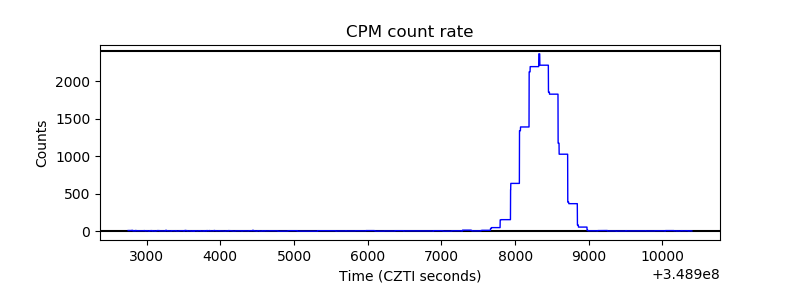 |
| CZT Counter | 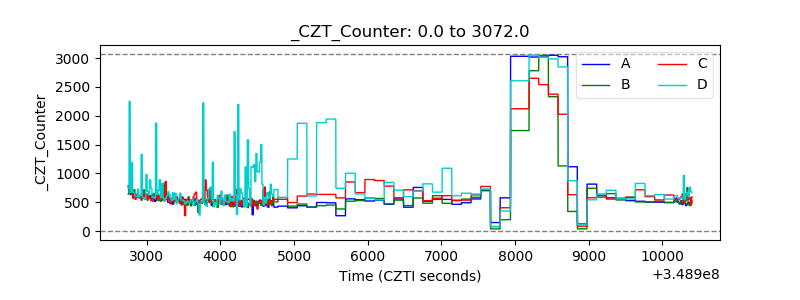 |
| +2.5 Volts monitor | 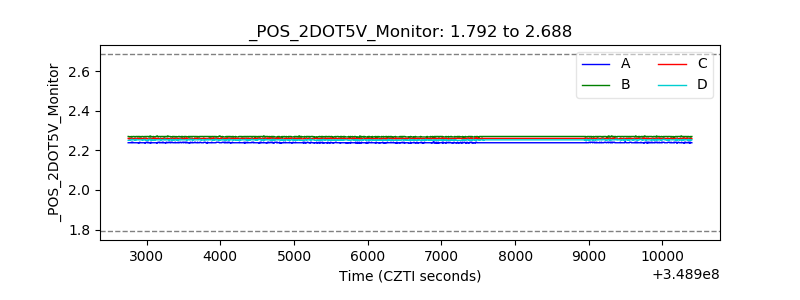 |
| +5 Volts monitor |  |
| _ROLL_ROT |  |
| _Roll_DEC |  |
| _Roll_RA | 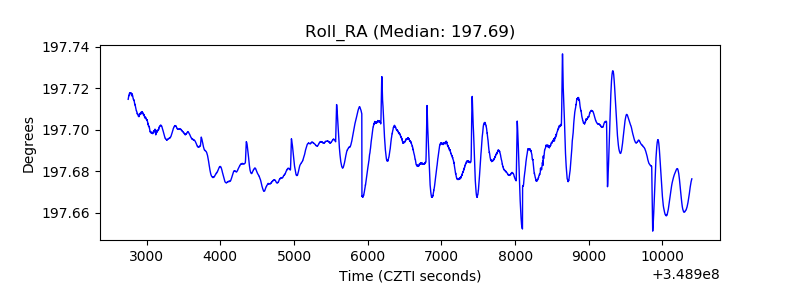 |
| Veto Counter | 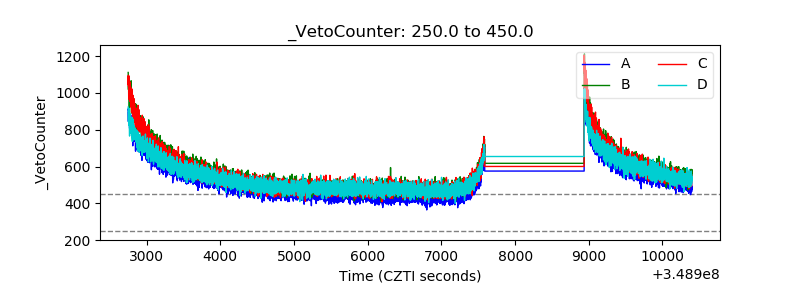 |