| Param | Original file | Final file |
|---|---|---|
| Filename | modeM0/AS1A10_123T08_9000004126_28750cztM0_level2.evt | modeM0/AS1A10_123T08_9000004126_28750cztM0_level2_quad_clean.evt |
| Size (bytes) | 793,512,000 | 81,181,440 |
| Size | 756.8 MB | 77.4 MB |
| Events in quadrant A | 3,333,930 | 524,678 |
| Events in quadrant B | 3,376,472 | 533,136 |
| Events in quadrant C | 10,441,964 | 458,176 |
| Events in quadrant D | 6,429,520 | 477,251 |
| Mode M0 | |||
|---|---|---|---|
| Quadrant | BADHDUFLAG | Total packets | Discarded packets |
| A | 0 | 14018 | 2 |
| B | 0 | 14151 | 1 |
| C | 0 | 35698 | 1 |
| D | 0 | 23810 | 1 |
| Mode SS | |||
|---|---|---|---|
| Quadrant | BADHDUFLAG | Total packets | Discarded packets |
| A | 0 | 136 | 0 |
| B | 0 | 136 | 0 |
| C | 0 | 136 | 0 |
| D | 0 | 136 | 0 |
| Mode M9 | |||
|---|---|---|---|
| Quadrant | BADHDUFLAG | Total packets | Discarded packets |
| A | 0 | 7 | 0 |
| B | 0 | 7 | 0 |
| C | 0 | 7 | 0 |
| D | 0 | 7 | 0 |
| Quadrant | Total seconds | Saturated seconds | Saturation percentage |
|---|---|---|---|
| A | 6659 | 169 | 2.537919% |
| B | 6659 | 159 | 2.387746% |
| C | 6660 | 2578 | 38.708709% |
| D | 6660 | 761 | 11.426426% |
Noise dominated data is calculated using 1-second bins in cleaned event files. If a bin has >2000 counts, and if more than 50% of those come from <1% of pixels, then it is considered to be noise-dominated and hence unusable.
| Quadrant | # 1 sec bins | Bins with >0 counts | Bins with >2000 counts | High rate bins dominated by noise | Noise dominated (total time) | Noise dominated (detector-on time) | Marked lightcurve |
|---|---|---|---|---|---|---|---|
| A | 7384 | 6659 | 5 | 5 | 0.07% | 0.08% | 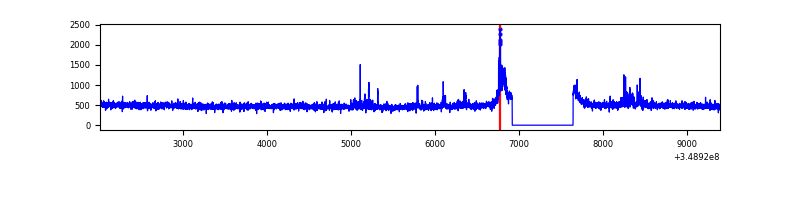 |
| B | 7384 | 6659 | 22 | 22 | 0.30% | 0.33% | 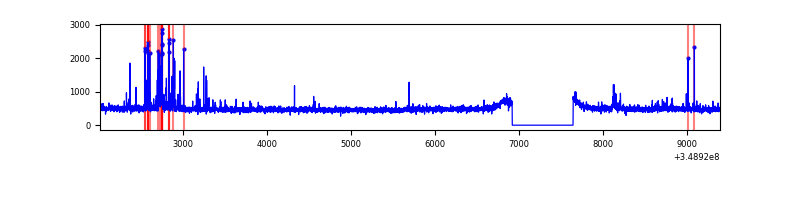 |
| C | 7385 | 6660 | 1756 | 1756 | 23.78% | 26.37% | 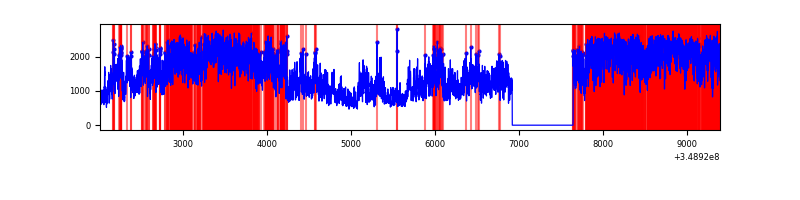 |
| D | 7385 | 6660 | 633 | 633 | 8.57% | 9.50% | 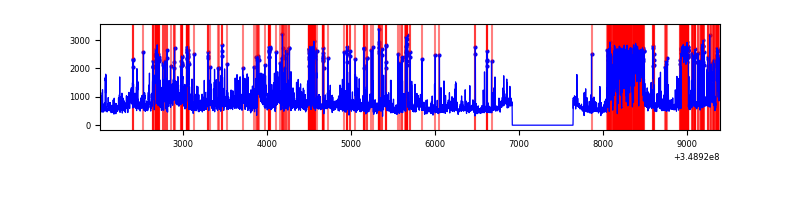 |
Top three noisy pixels from each quadrant. If the there are fewer than three noisy pixels in the level2.evt file, extra rows are filled as -1
| Pixel properties | Quadrant properties | ||||||
|---|---|---|---|---|---|---|---|
| Quadrant | DetID | PixID | Counts | Sigma | Mean | Median | Sigma |
| A | 14 | 239 | 117971 | 706.83 | 824 | 807 | 165.8 |
| A | 15 | 174 | 37463 | 221.14 | 824 | 807 | 165.8 |
| A | 13 | 254 | 14397 | 81.99 | 824 | 807 | 165.8 |
| B | 5 | 255 | 144223 | 937.76 | 810 | 789 | 153.0 |
| B | 0 | 190 | 25471 | 161.37 | 810 | 789 | 153.0 |
| B | 4 | 80 | 22411 | 141.36 | 810 | 789 | 153.0 |
| C | 3 | 233 | 7517285 | 46110.79 | 708 | 710 | 163.0 |
| C | 14 | 238 | 127078 | 775.21 | 708 | 710 | 163.0 |
| C | 14 | 254 | 21084 | 124.99 | 708 | 710 | 163.0 |
| D | 8 | 195 | 1607972 | 8935.99 | 762 | 741 | 179.9 |
| D | 1 | 52 | 923912 | 5132.71 | 762 | 741 | 179.9 |
| D | 12 | 233 | 919963 | 5110.75 | 762 | 741 | 179.9 |
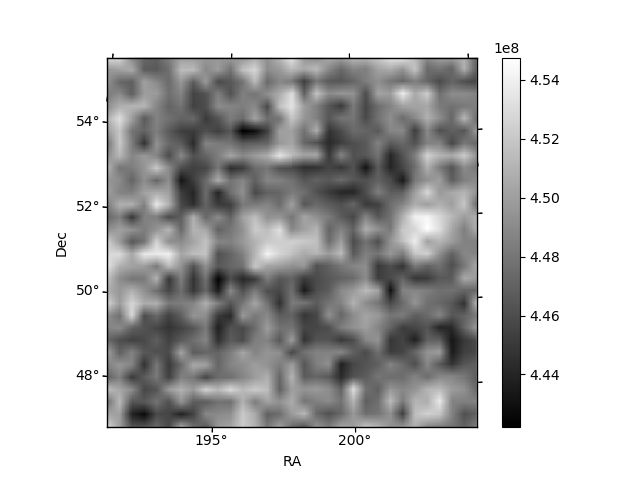
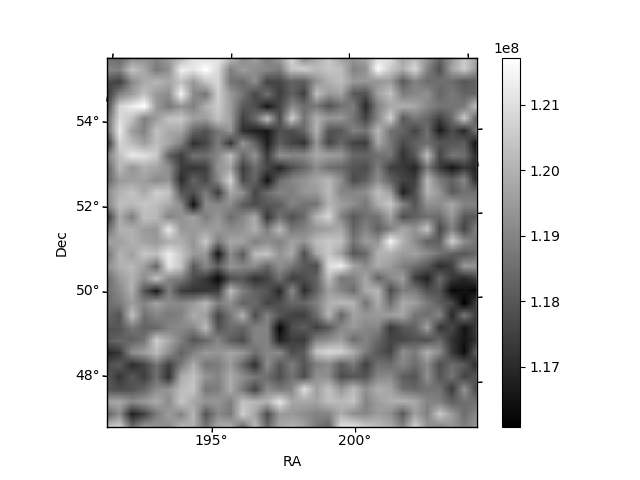
Histogram calculated using DETX and DETY for each event in the final _common_clean file
| Quadrant A | 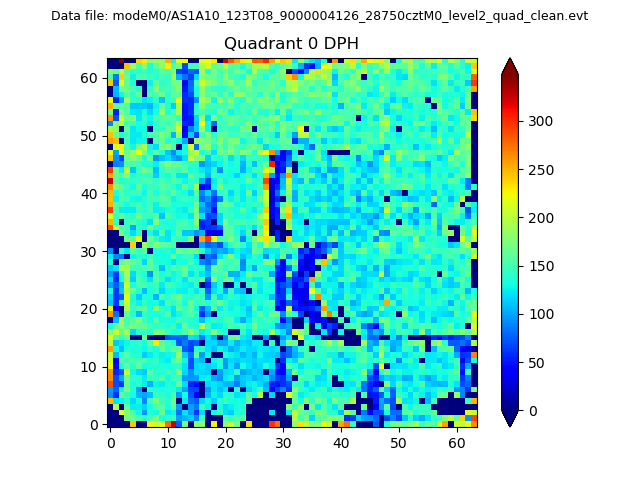 |
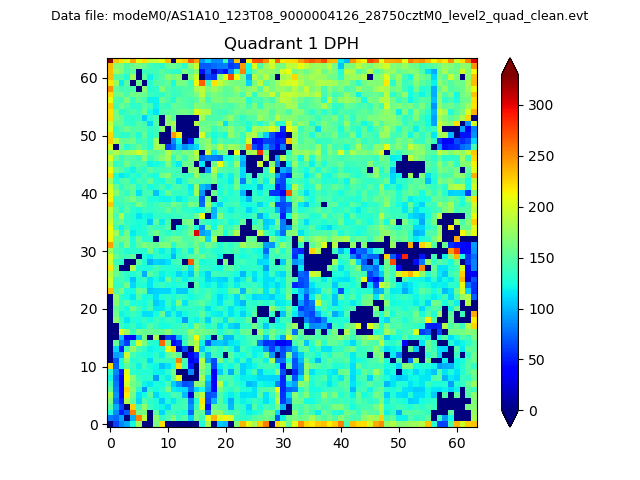 |
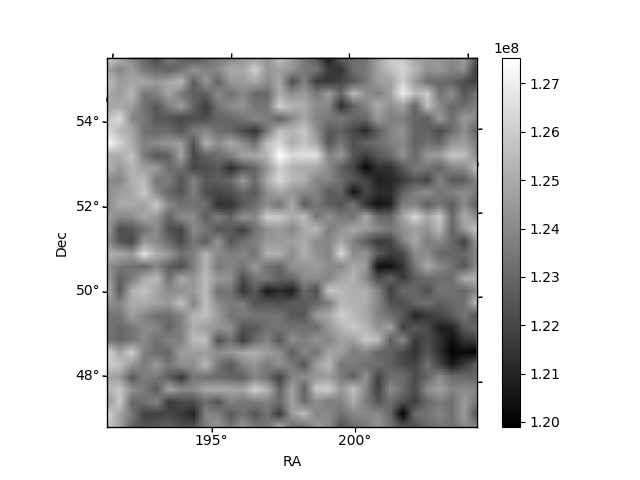
Quadrant B |
|---|---|---|---|
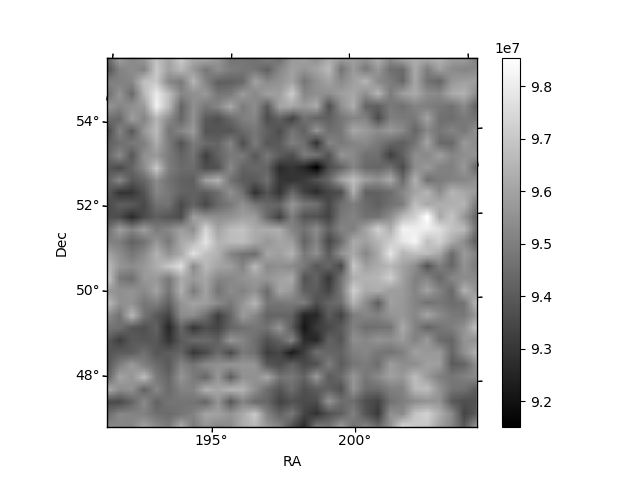
| Quadrant D | 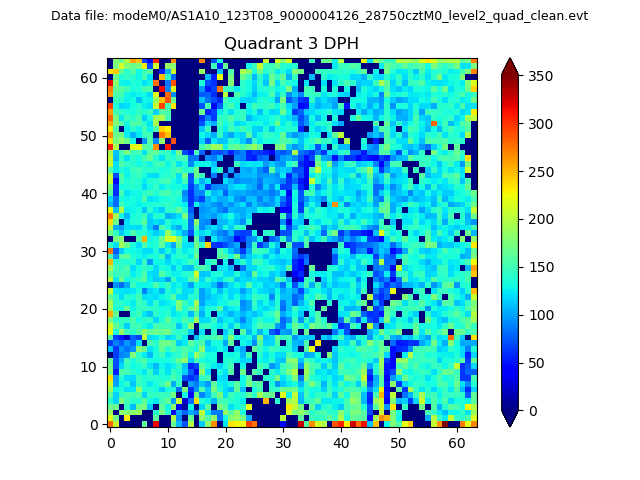 |
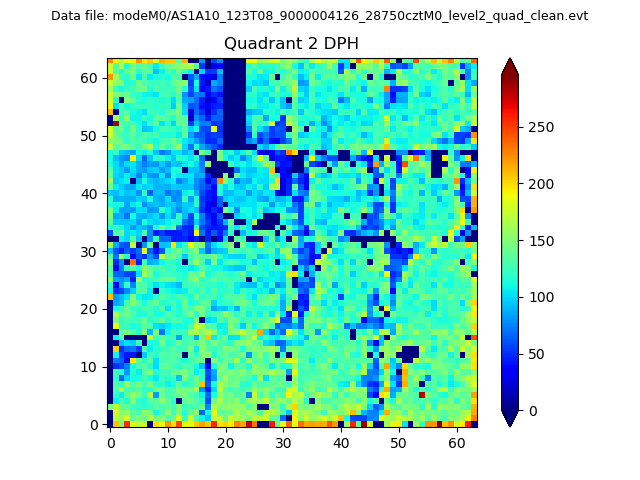 |
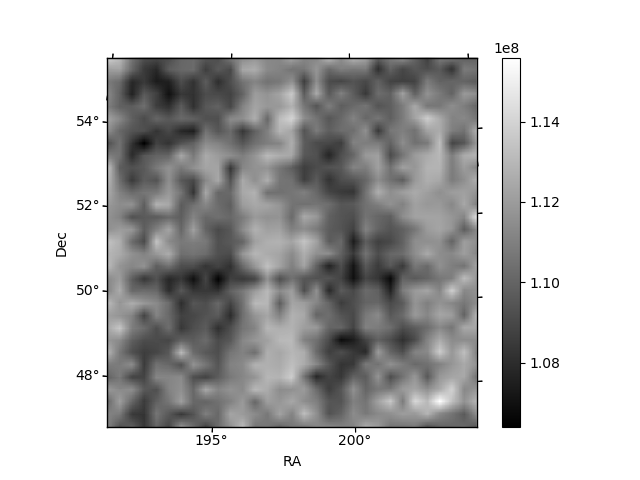
Quadrant C |
| Plot type | Count rate plots | Images |
|---|---|---|
| Comparison with Poisson distribution Blue bars denote a histogram of data divided into 1 sec bins. Red curve is a Poisson curve with rate = median count rate of data. |
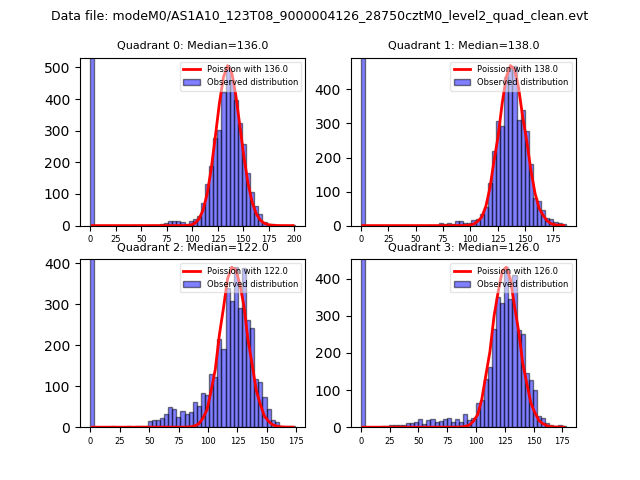 |
 |
| Quadrant-wise count rates Data is divided into 100 sec bins |
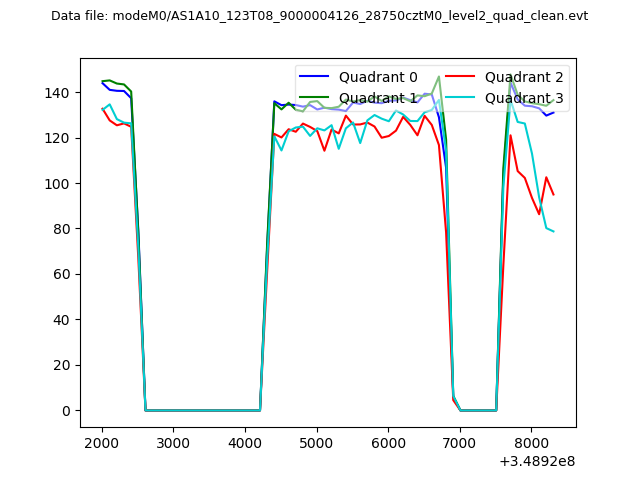 |
|
| Module-wise count rates for Quadrant A Data is divided into 100 sec bins |
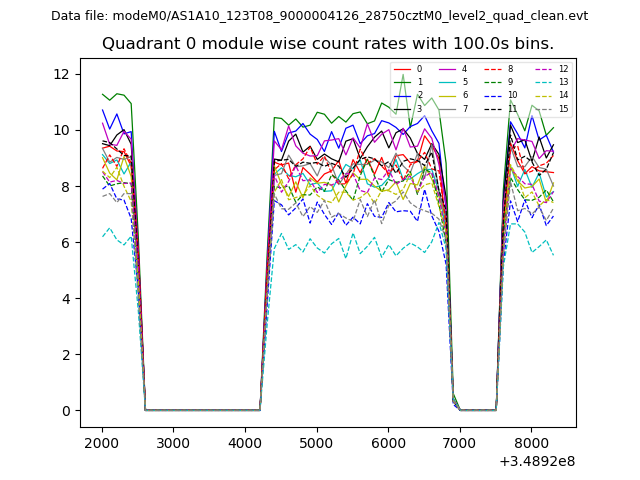 |
 |
| Module-wise count rates for Quadrant B Data is divided into 100 sec bins |
 |
 |
| Module-wise count rates for Quadrant C Data is divided into 100 sec bins |
 |
 |
| Module-wise count rates for Quadrant D Data is divided into 100 sec bins |
 |
 |
| Parameter | Plot |
|---|---|
| CZT HV Monitor | 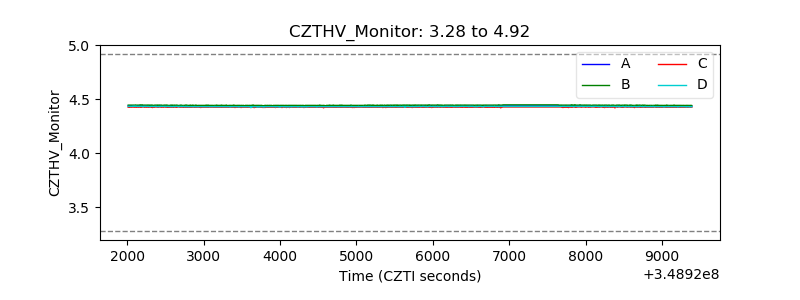 |
| D_VDD | 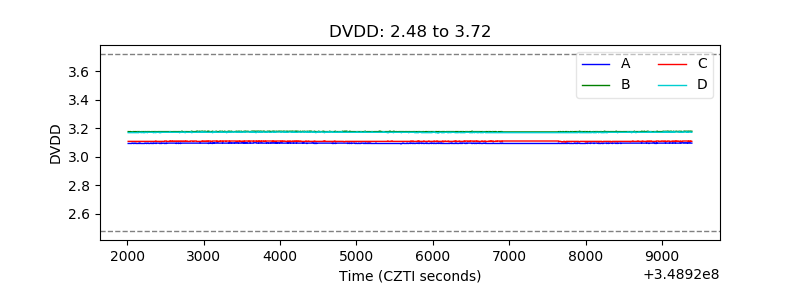 |
| Temperature 1 | 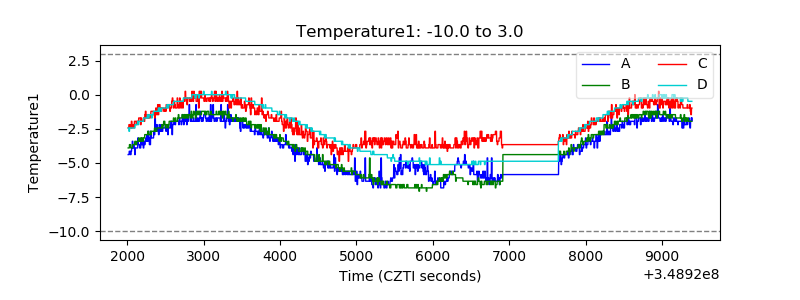 |
| Veto HV Monitor | 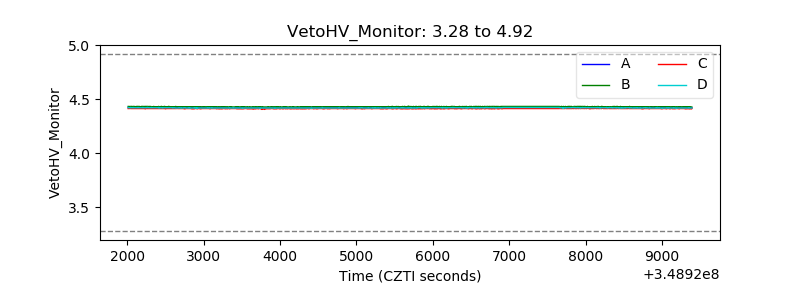 |
| Veto LLD | 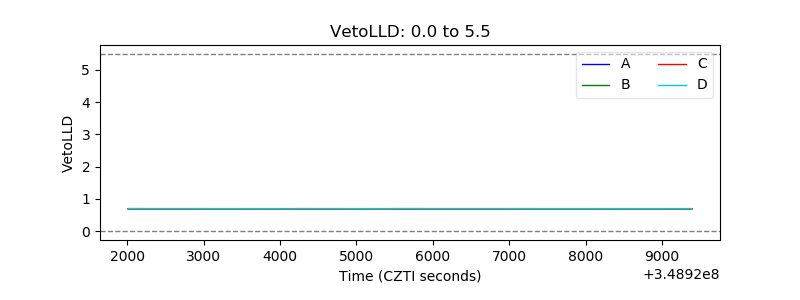 |
| Alpha Counter |  |
| _CPM_Rate | 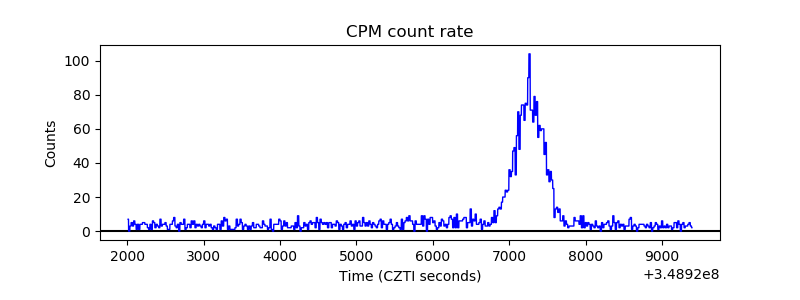 |
| CZT Counter | 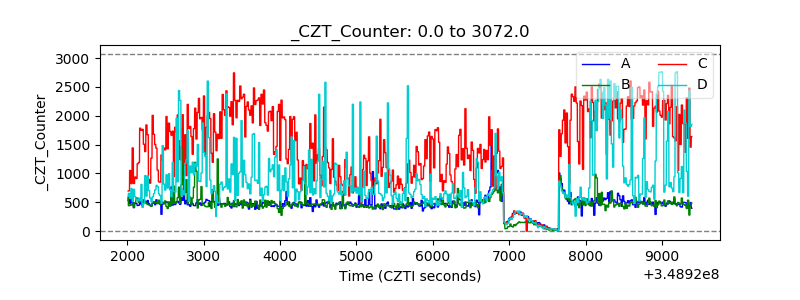 |
| +2.5 Volts monitor |  |
| +5 Volts monitor |  |
| _ROLL_ROT | 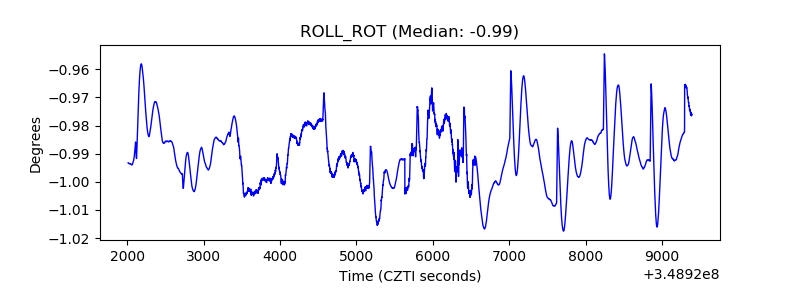 |
| _Roll_DEC | 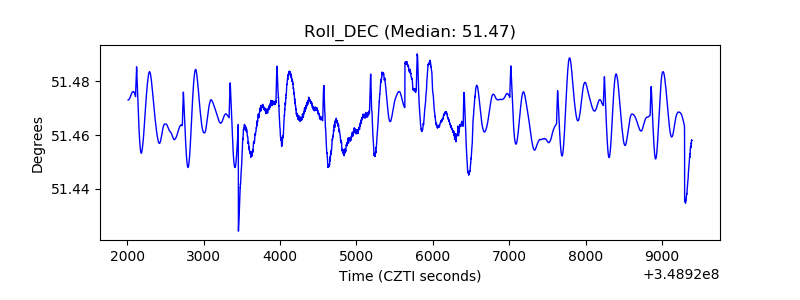 |
| _Roll_RA | 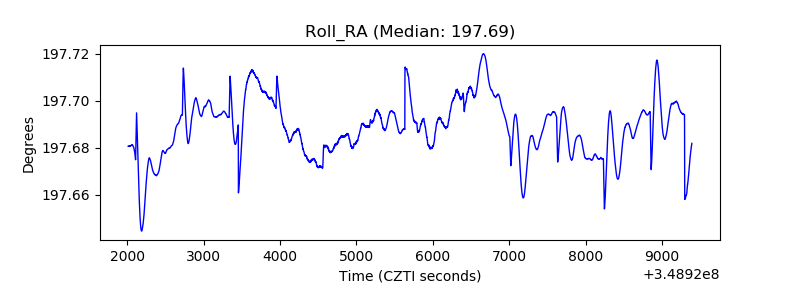 |
| Veto Counter | 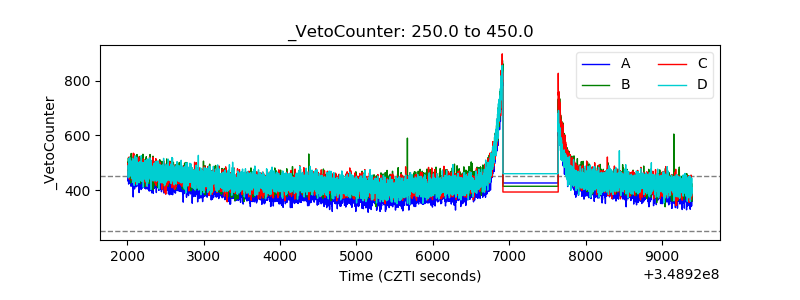 |