| Param | Original file | Final file |
|---|---|---|
| Filename | modeM0/AS1A10_123T08_9000004126_28751cztM0_level2.evt | modeM0/AS1A10_123T08_9000004126_28751cztM0_level2_quad_clean.evt |
| Size (bytes) | 751,118,400 | 84,962,880 |
| Size | 716.3 MB | 81.0 MB |
| Events in quadrant A | 3,653,204 | 535,200 |
| Events in quadrant B | 3,513,689 | 543,665 |
| Events in quadrant C | 8,583,100 | 490,608 |
| Events in quadrant D | 6,507,770 | 498,230 |
| Mode M0 | |||
|---|---|---|---|
| Quadrant | BADHDUFLAG | Total packets | Discarded packets |
| A | 0 | 15438 | 1 |
| B | 0 | 15016 | 1 |
| C | 0 | 30679 | 1 |
| D | 0 | 24195 | 1 |
| Mode SS | |||
|---|---|---|---|
| Quadrant | BADHDUFLAG | Total packets | Discarded packets |
| A | 0 | 148 | 0 |
| B | 0 | 148 | 0 |
| C | 0 | 148 | 0 |
| D | 0 | 148 | 0 |
| Mode M9 | |||
|---|---|---|---|
| Quadrant | BADHDUFLAG | Total packets | Discarded packets |
| A | 0 | 3 | 0 |
| B | 0 | 3 | 0 |
| C | 0 | 3 | 0 |
| D | 0 | 3 | 0 |
| Quadrant | Total seconds | Saturated seconds | Saturation percentage |
|---|---|---|---|
| A | 7246 | 110 | 1.518079% |
| B | 7247 | 109 | 1.504071% |
| C | 7247 | 1508 | 20.808610% |
| D | 7247 | 755 | 10.418104% |
Noise dominated data is calculated using 1-second bins in cleaned event files. If a bin has >2000 counts, and if more than 50% of those come from <1% of pixels, then it is considered to be noise-dominated and hence unusable.
| Quadrant | # 1 sec bins | Bins with >0 counts | Bins with >2000 counts | High rate bins dominated by noise | Noise dominated (total time) | Noise dominated (detector-on time) | Marked lightcurve |
|---|---|---|---|---|---|---|---|
| A | 7591 | 7246 | 20 | 20 | 0.26% | 0.28% | 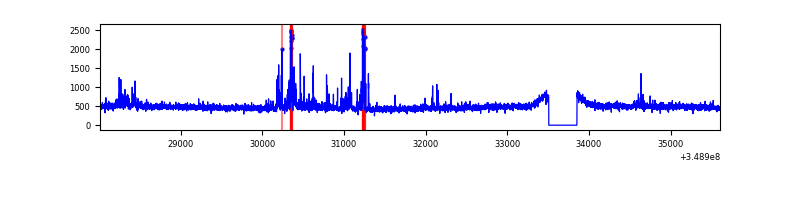 |
| B | 7592 | 7247 | 2 | 2 | 0.03% | 0.03% | 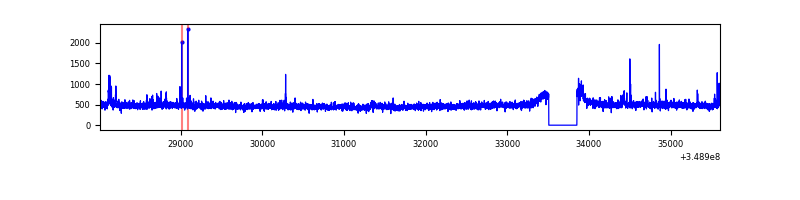 |
| C | 7591 | 7246 | 981 | 981 | 12.92% | 13.54% | 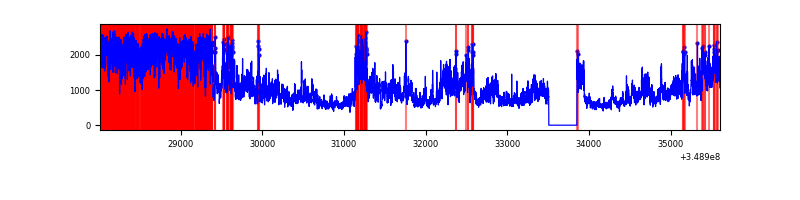 |
| D | 7592 | 7247 | 654 | 654 | 8.61% | 9.02% | 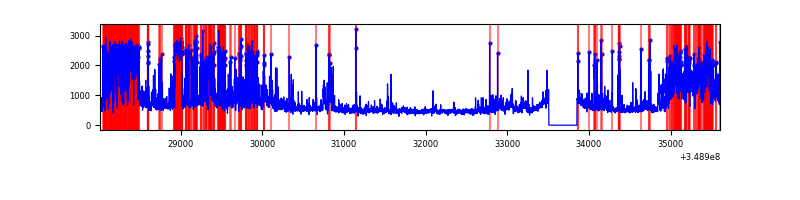 |
Top three noisy pixels from each quadrant. If the there are fewer than three noisy pixels in the level2.evt file, extra rows are filled as -1
| Pixel properties | Quadrant properties | ||||||
|---|---|---|---|---|---|---|---|
| Quadrant | DetID | PixID | Counts | Sigma | Mean | Median | Sigma |
| A | 14 | 239 | 159380 | 893.13 | 882 | 864 | 177.5 |
| A | 15 | 174 | 86917 | 484.85 | 882 | 864 | 177.5 |
| A | 13 | 254 | 15711 | 83.65 | 882 | 864 | 177.5 |
| B | 4 | 80 | 30621 | 179.12 | 870 | 847 | 166.2 |
| B | 0 | 190 | 26996 | 157.31 | 870 | 847 | 166.2 |
| B | 0 | 229 | 24191 | 140.44 | 870 | 847 | 166.2 |
| C | 3 | 233 | 5327568 | 28819.12 | 795 | 800 | 184.8 |
| C | 14 | 238 | 132778 | 714.03 | 795 | 800 | 184.8 |
| C | 4 | 254 | 12851 | 65.2 | 795 | 800 | 184.8 |
| D | 8 | 195 | 1400485 | 7213.92 | 819 | 796 | 194.0 |
| D | 1 | 52 | 1091452 | 5621.18 | 819 | 796 | 194.0 |
| D | 12 | 233 | 826658 | 4256.45 | 819 | 796 | 194.0 |
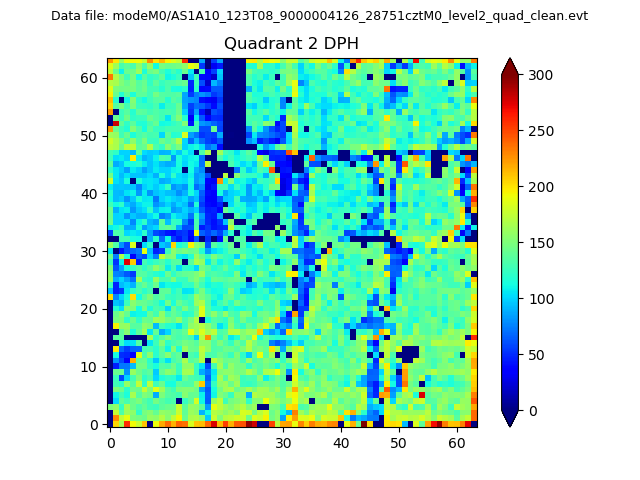
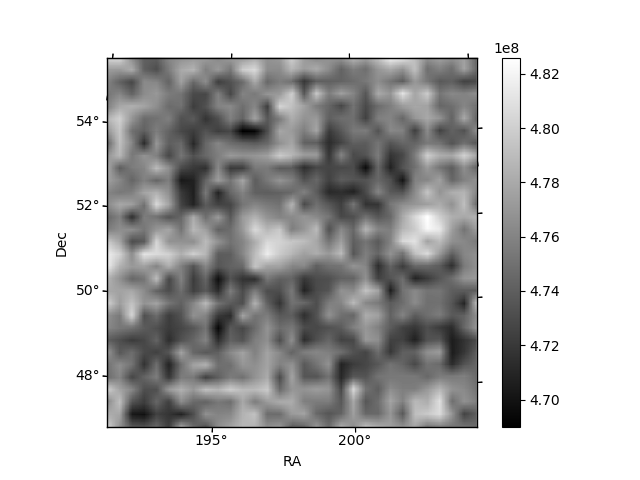
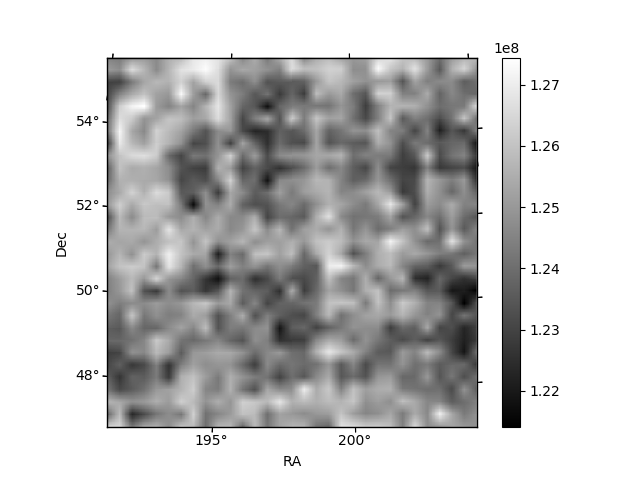
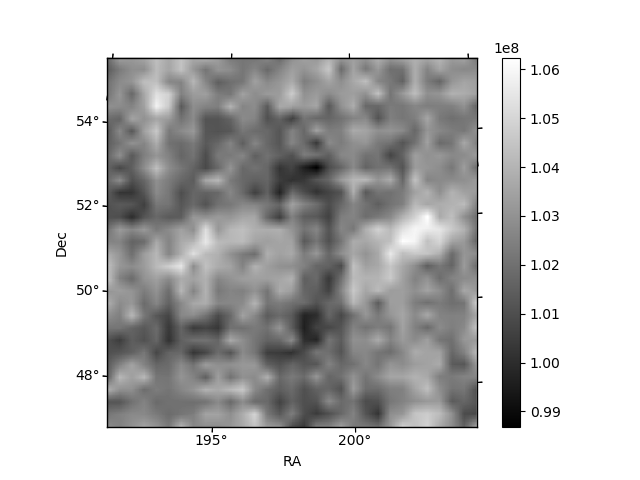
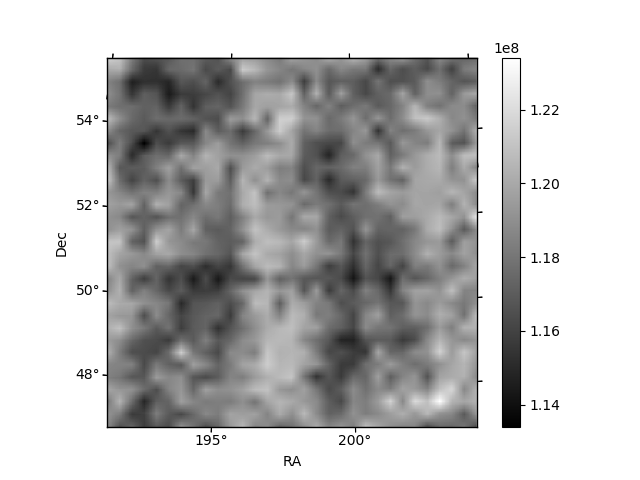
Histogram calculated using DETX and DETY for each event in the final _common_clean file
| Quadrant A | 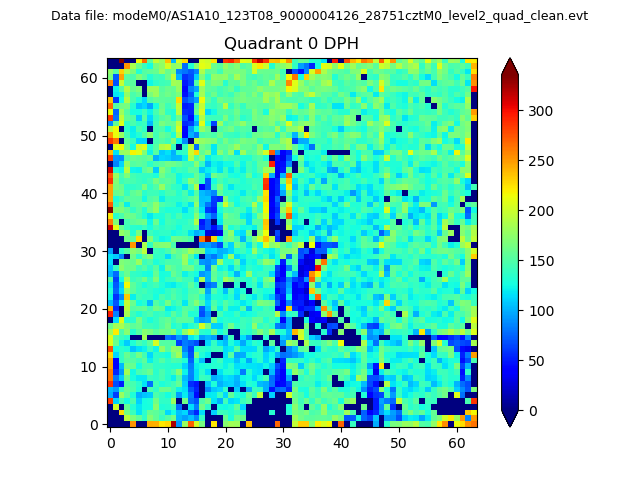 |
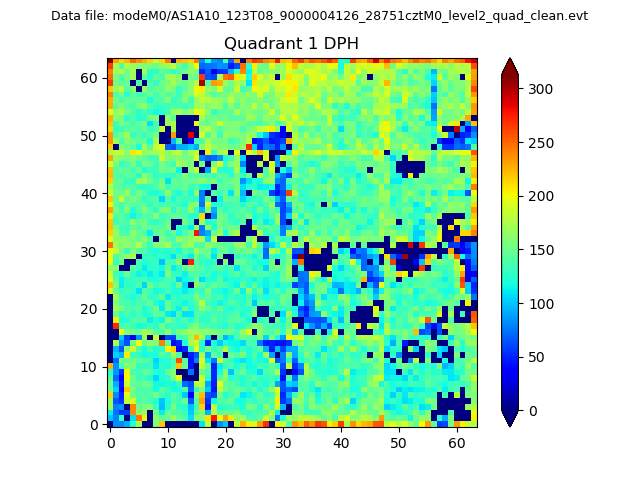 |
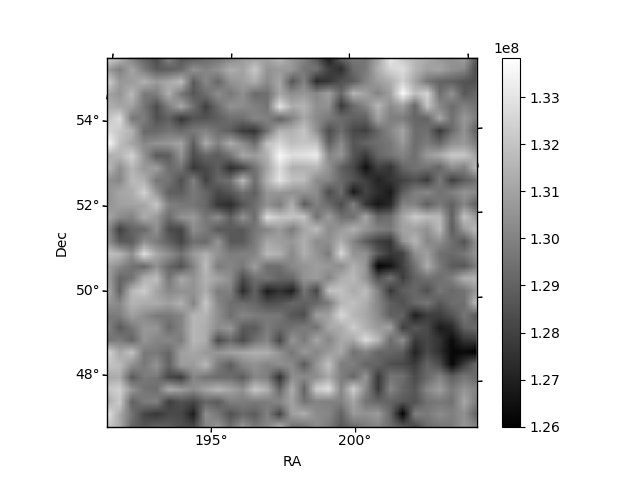
Quadrant B |
|---|---|---|---|
| Quadrant D | 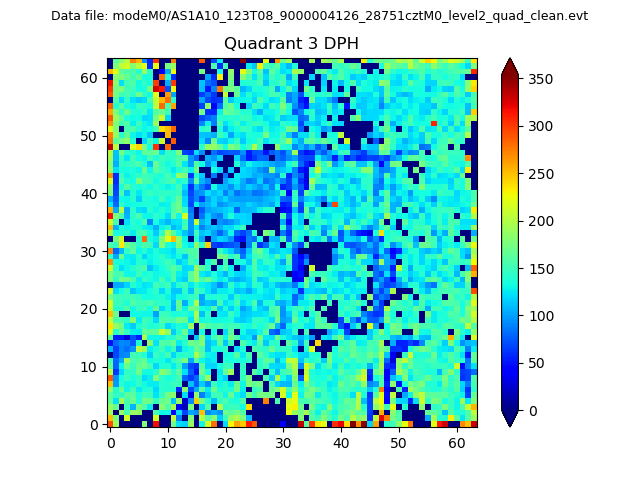 |
 |
Quadrant C |
| Plot type | Count rate plots | Images |
|---|---|---|
| Comparison with Poisson distribution Blue bars denote a histogram of data divided into 1 sec bins. Red curve is a Poisson curve with rate = median count rate of data. |
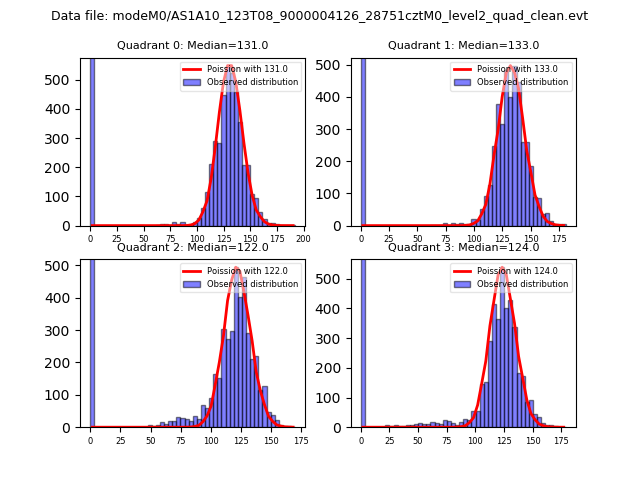 |
 |
| Quadrant-wise count rates Data is divided into 100 sec bins |
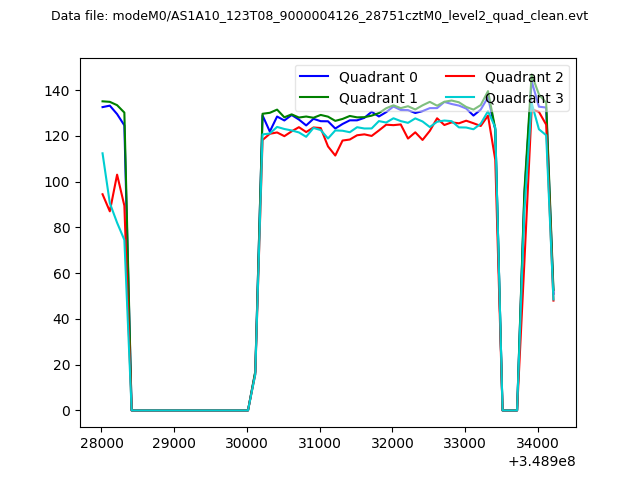 |
|
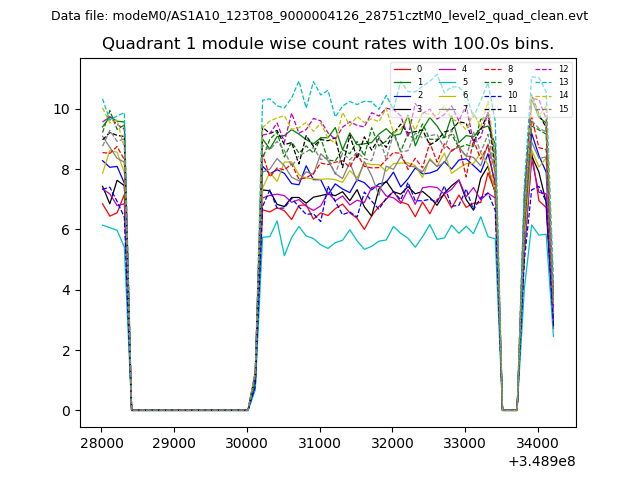
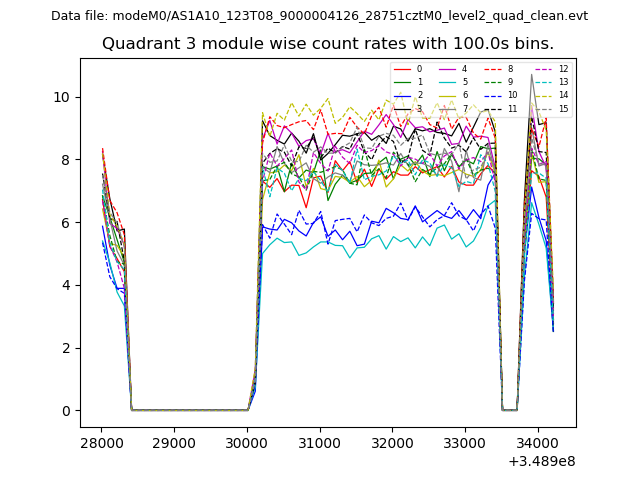
| Module-wise count rates for Quadrant A Data is divided into 100 sec bins |
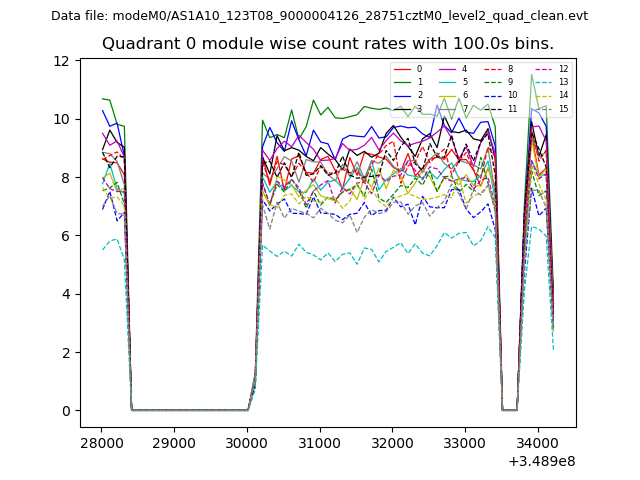 |
 |
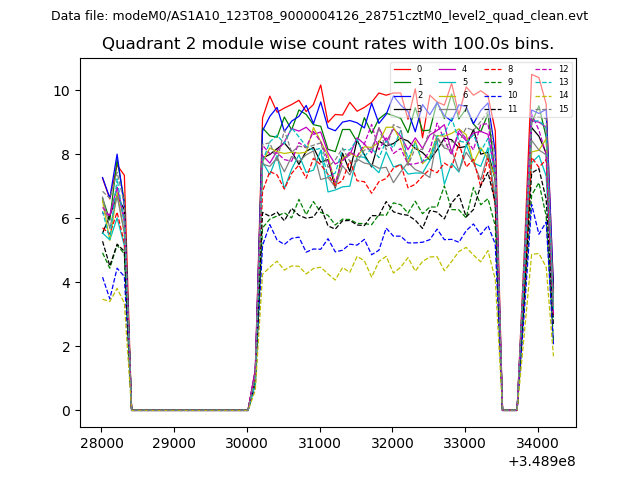
| Module-wise count rates for Quadrant B Data is divided into 100 sec bins |
 |
 |
| Module-wise count rates for Quadrant C Data is divided into 100 sec bins |
 |
 |
| Module-wise count rates for Quadrant D Data is divided into 100 sec bins |
 |
 |
| Parameter | Plot |
|---|---|
| CZT HV Monitor | 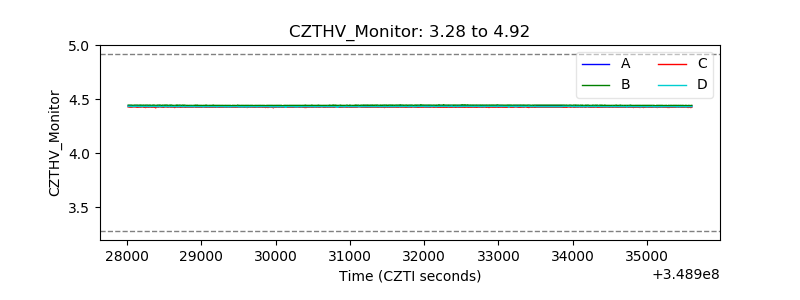 |
| D_VDD | 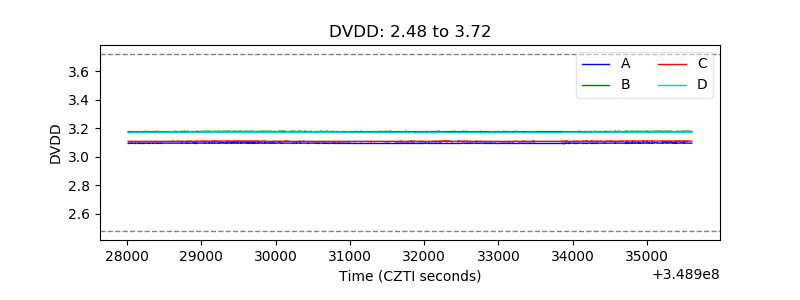 |
| Temperature 1 | 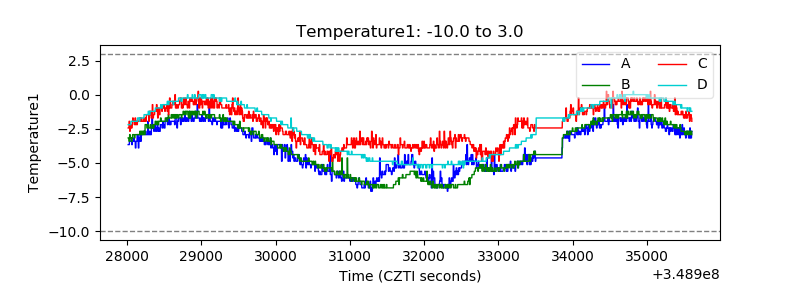 |
| Veto HV Monitor | 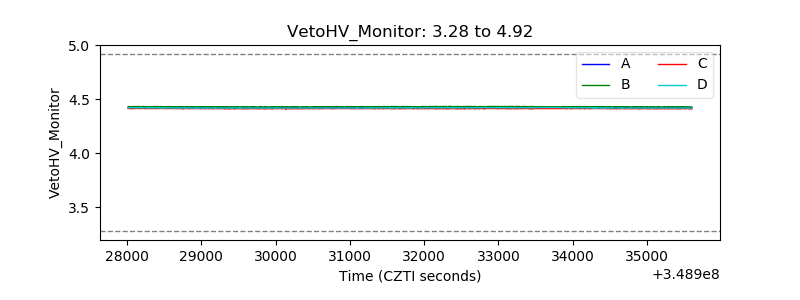 |
| Veto LLD | 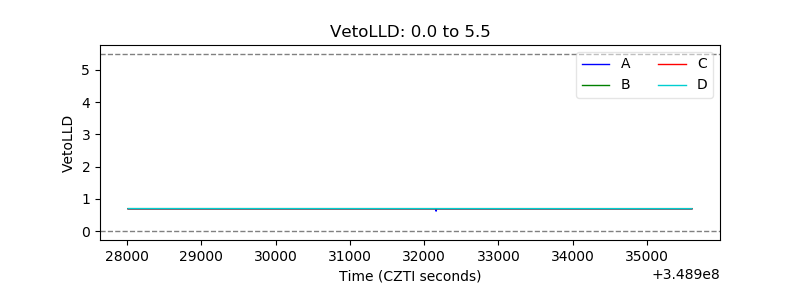 |
| Alpha Counter | 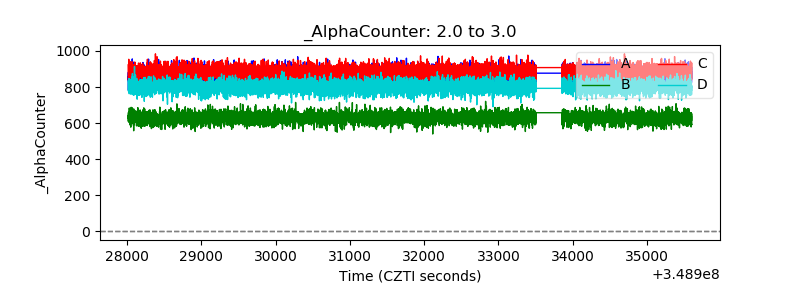 |
| _CPM_Rate | 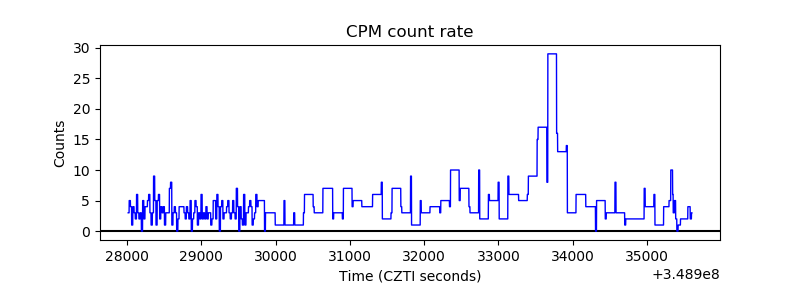 |
| CZT Counter | 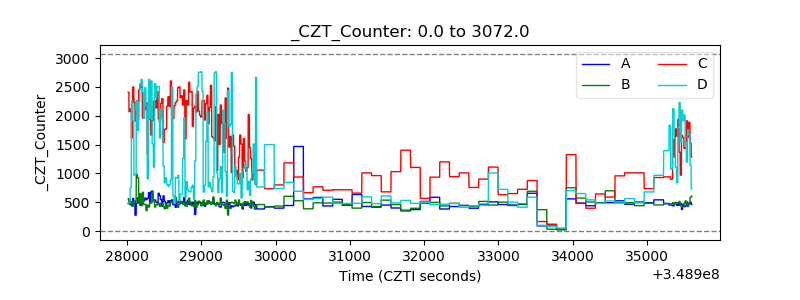 |
| +2.5 Volts monitor |  |
| +5 Volts monitor |  |
| _ROLL_ROT | 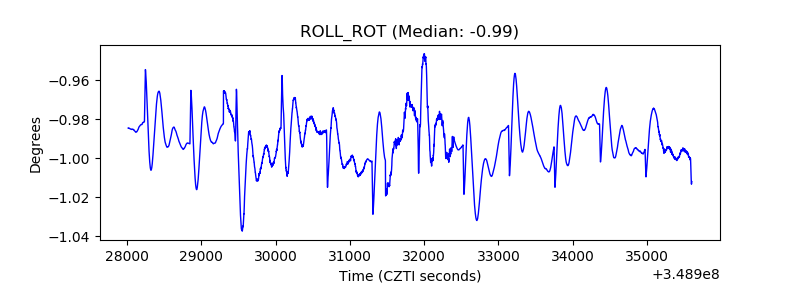 |
| _Roll_DEC | 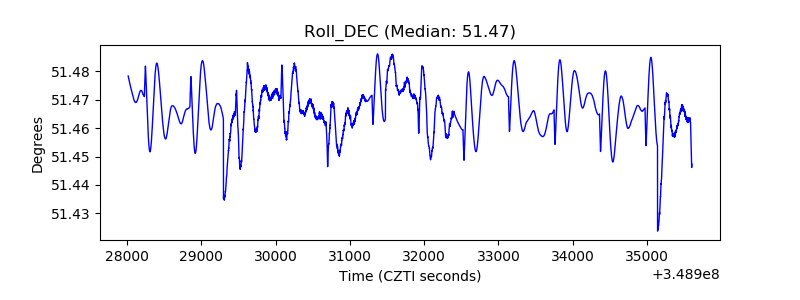 |
| _Roll_RA | 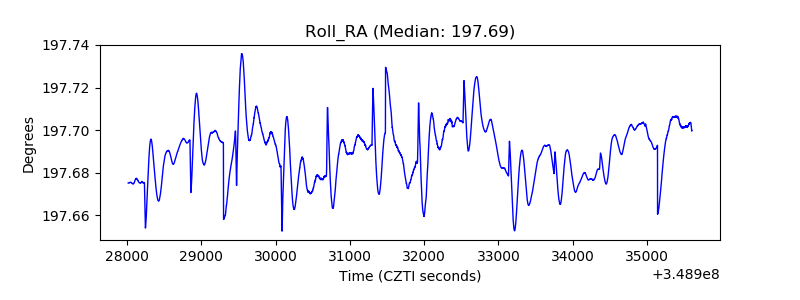 |
| Veto Counter | 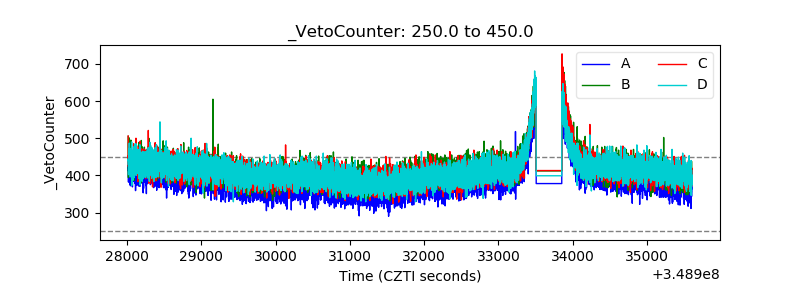 |