| Param | Original file | Final file |
|---|---|---|
| Filename | modeM0/AS1A10_123T08_9000004126_28752cztM0_level2.evt | modeM0/AS1A10_123T08_9000004126_28752cztM0_level2_quad_clean.evt |
| Size (bytes) | 819,328,320 | 96,863,040 |
| Size | 781.4 MB | 92.4 MB |
| Events in quadrant A | 3,792,218 | 627,466 |
| Events in quadrant B | 4,096,575 | 632,917 |
| Events in quadrant C | 10,110,605 | 543,097 |
| Events in quadrant D | 6,289,873 | 589,169 |
| Mode M0 | |||
|---|---|---|---|
| Quadrant | BADHDUFLAG | Total packets | Discarded packets |
| A | 0 | 16234 | 2 |
| B | 0 | 17156 | 4 |
| C | 0 | 35545 | 2 |
| D | 0 | 23938 | 2 |
| Mode SS | |||
|---|---|---|---|
| Quadrant | BADHDUFLAG | Total packets | Discarded packets |
| A | 0 | 158 | 0 |
| B | 0 | 158 | 0 |
| C | 0 | 158 | 0 |
| D | 0 | 158 | 0 |
| Mode M9 | |||
|---|---|---|---|
| Quadrant | BADHDUFLAG | Total packets | Discarded packets |
| A | 0 | 1 | 0 |
| B | 0 | 1 | 0 |
| C | 0 | 1 | 0 |
| D | 0 | 1 | 0 |
| Quadrant | Total seconds | Saturated seconds | Saturation percentage |
|---|---|---|---|
| A | 7761 | 183 | 2.357944% |
| B | 7761 | 299 | 3.852596% |
| C | 7761 | 1903 | 24.520036% |
| D | 7761 | 533 | 6.867672% |
Noise dominated data is calculated using 1-second bins in cleaned event files. If a bin has >2000 counts, and if more than 50% of those come from <1% of pixels, then it is considered to be noise-dominated and hence unusable.
| Quadrant | # 1 sec bins | Bins with >0 counts | Bins with >2000 counts | High rate bins dominated by noise | Noise dominated (total time) | Noise dominated (detector-on time) | Marked lightcurve |
|---|---|---|---|---|---|---|---|
| A | 7896 | 7762 | 1 | 1 | 0.01% | 0.01% | 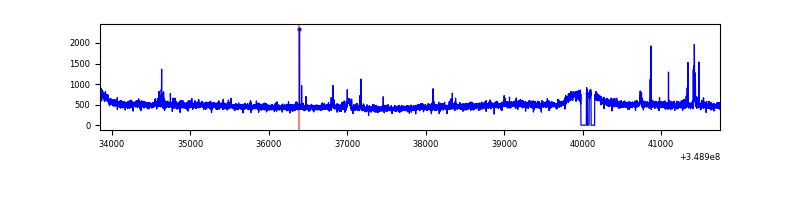 |
| B | 7896 | 7762 | 64 | 64 | 0.81% | 0.82% | 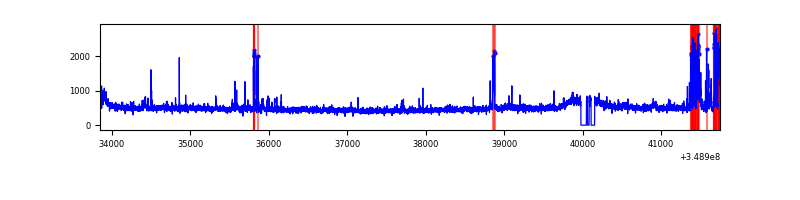 |
| C | 7896 | 7761 | 761 | 761 | 9.64% | 9.81% | 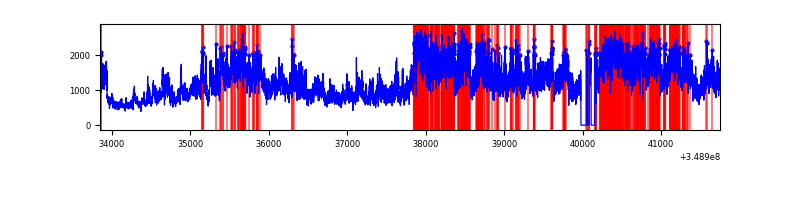 |
| D | 7896 | 7762 | 353 | 353 | 4.47% | 4.55% | 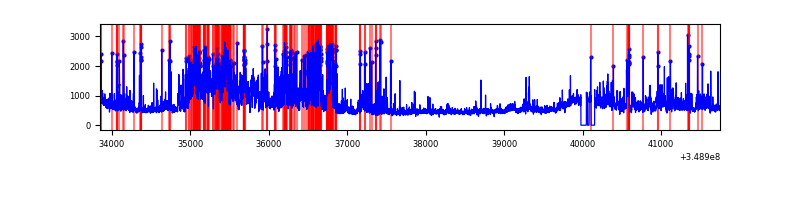 |
Top three noisy pixels from each quadrant. If the there are fewer than three noisy pixels in the level2.evt file, extra rows are filled as -1
| Pixel properties | Quadrant properties | ||||||
|---|---|---|---|---|---|---|---|
| Quadrant | DetID | PixID | Counts | Sigma | Mean | Median | Sigma |
| A | 15 | 174 | 36591 | 184.14 | 957 | 935 | 193.6 |
| A | 12 | 16 | 21834 | 107.93 | 957 | 935 | 193.6 |
| A | 14 | 239 | 18707 | 91.78 | 957 | 935 | 193.6 |
| B | 4 | 80 | 302503 | 1677.51 | 941 | 917 | 179.8 |
| B | 0 | 229 | 59853 | 327.82 | 941 | 917 | 179.8 |
| B | 12 | 111 | 22351 | 119.22 | 941 | 917 | 179.8 |
| C | 3 | 233 | 6561123 | 33369.84 | 850 | 853 | 196.6 |
| C | 14 | 238 | 160926 | 814.24 | 850 | 853 | 196.6 |
| C | 14 | 254 | 37900 | 188.45 | 850 | 853 | 196.6 |
| D | 8 | 195 | 1608974 | 7347.32 | 913 | 886 | 218.9 |
| D | 1 | 52 | 787561 | 3594.3 | 913 | 886 | 218.9 |
| D | 12 | 233 | 207522 | 944.12 | 913 | 886 | 218.9 |
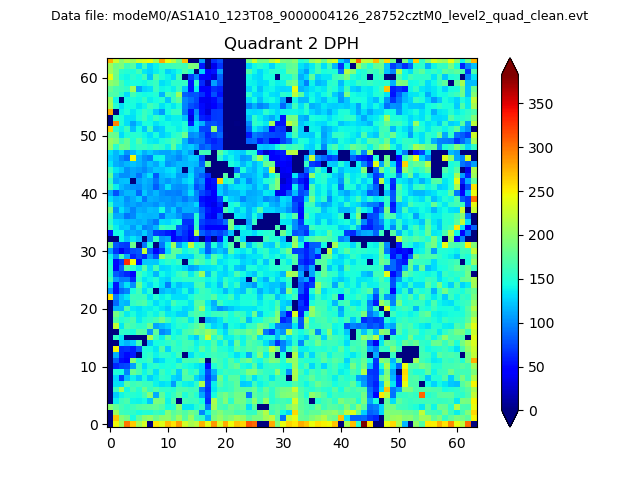
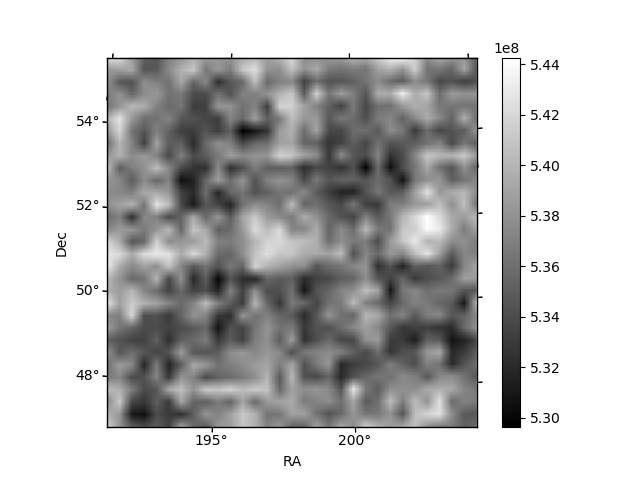
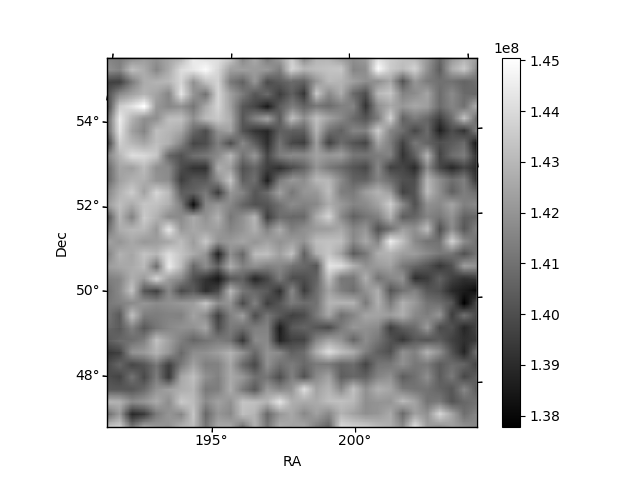
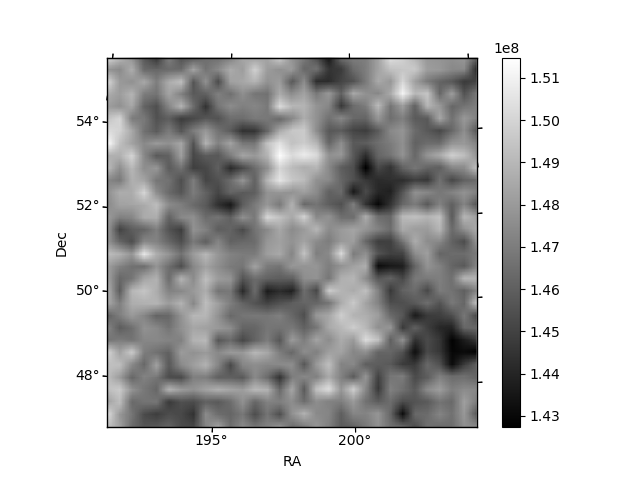
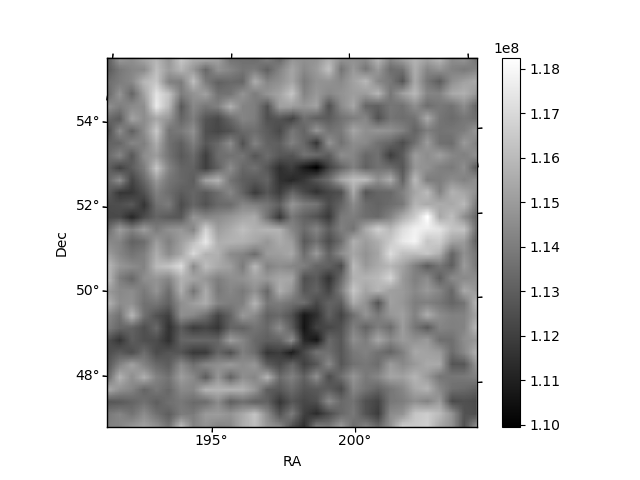
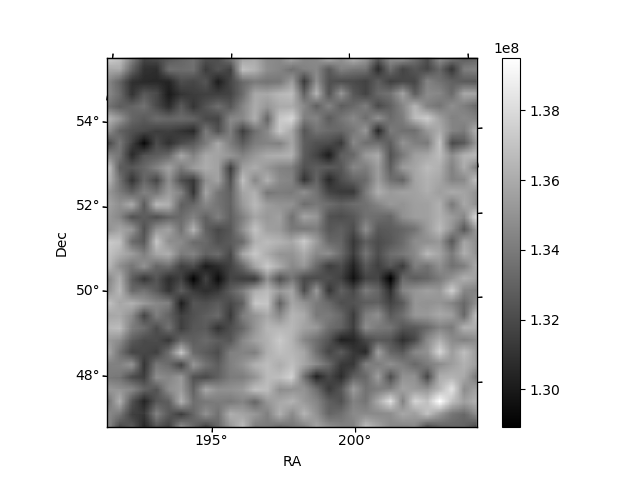
Histogram calculated using DETX and DETY for each event in the final _common_clean file
| Quadrant A | 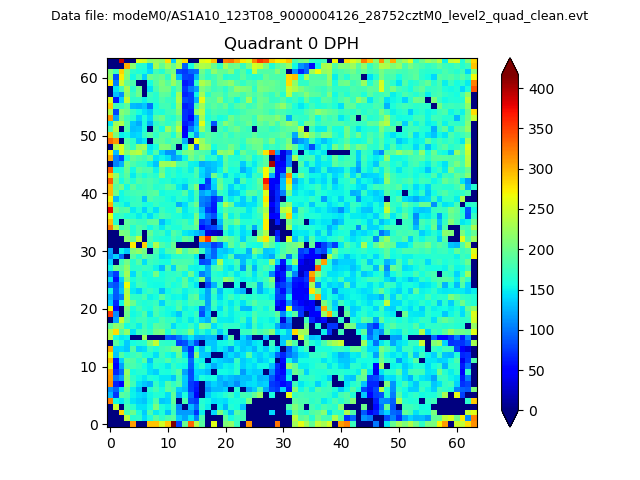 |
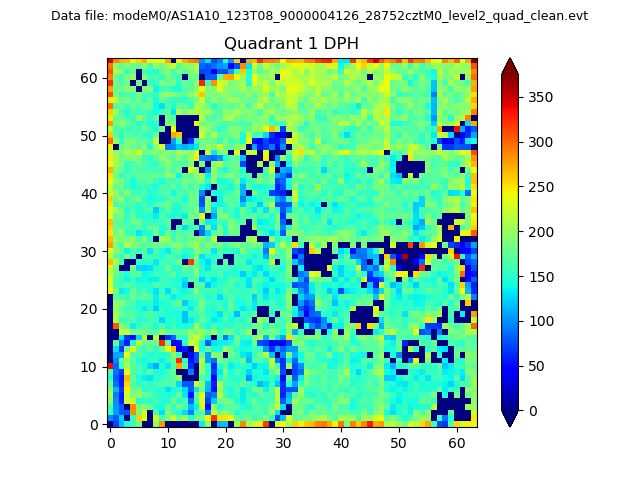 |
Quadrant B |
|---|---|---|---|
| Quadrant D | 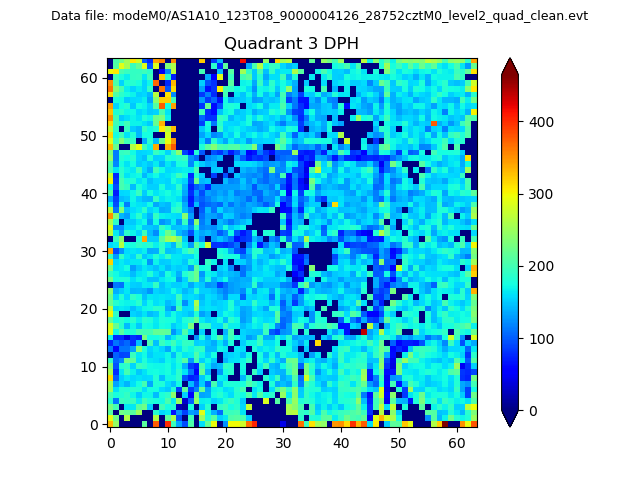 |
 |
Quadrant C |
| Plot type | Count rate plots | Images |
|---|---|---|
| Comparison with Poisson distribution Blue bars denote a histogram of data divided into 1 sec bins. Red curve is a Poisson curve with rate = median count rate of data. |
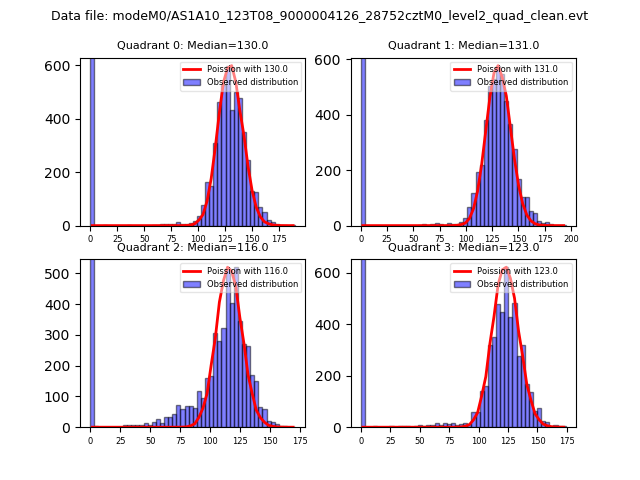 |
 |
| Quadrant-wise count rates Data is divided into 100 sec bins |
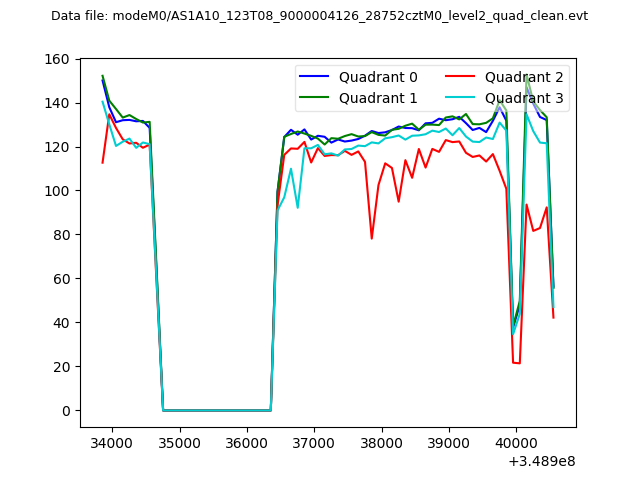 |
|
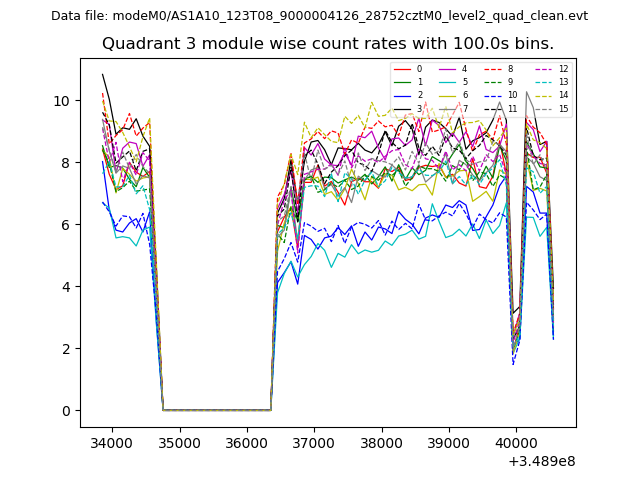
| Module-wise count rates for Quadrant A Data is divided into 100 sec bins |
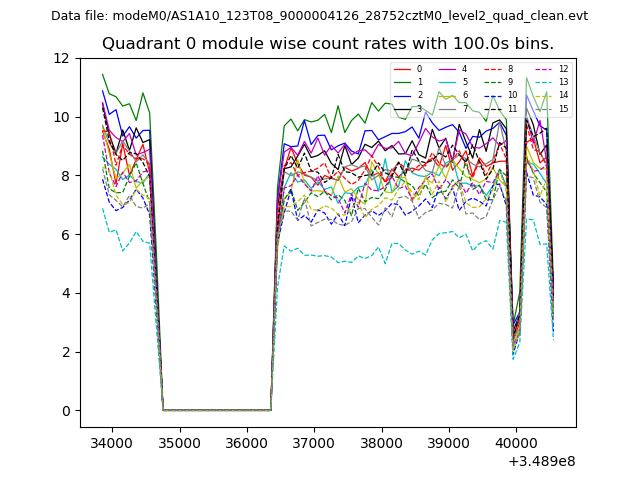 |
 |
| Module-wise count rates for Quadrant B Data is divided into 100 sec bins |
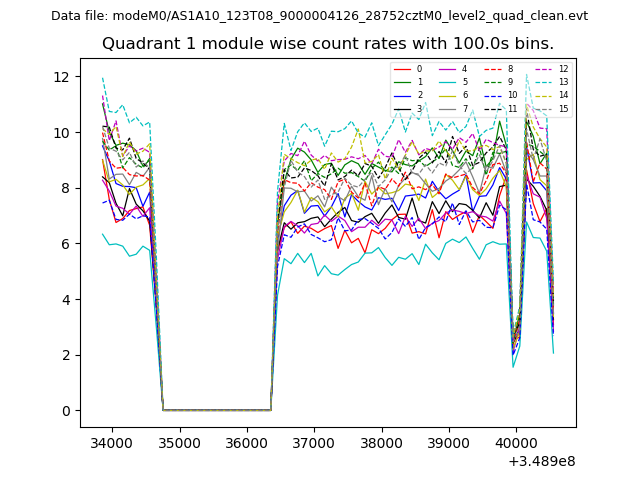 |
 |
| Module-wise count rates for Quadrant C Data is divided into 100 sec bins |
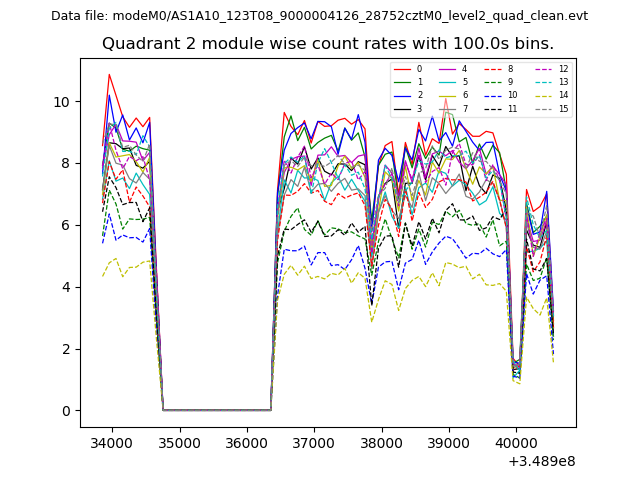 |
 |
| Module-wise count rates for Quadrant D Data is divided into 100 sec bins |
 |
 |
| Parameter | Plot |
|---|---|
| CZT HV Monitor | 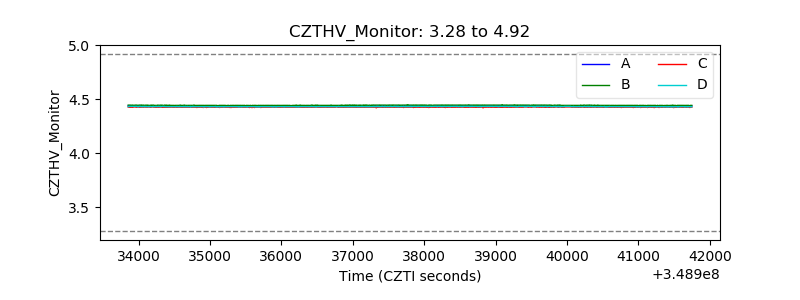 |
| D_VDD | 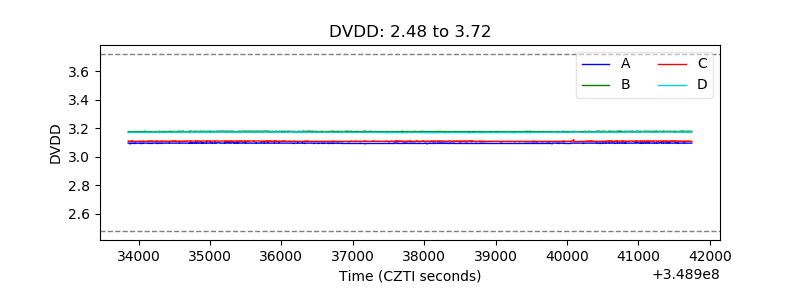 |
| Temperature 1 | 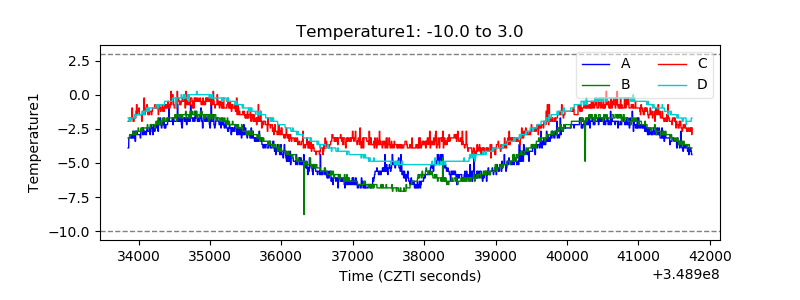 |
| Veto HV Monitor | 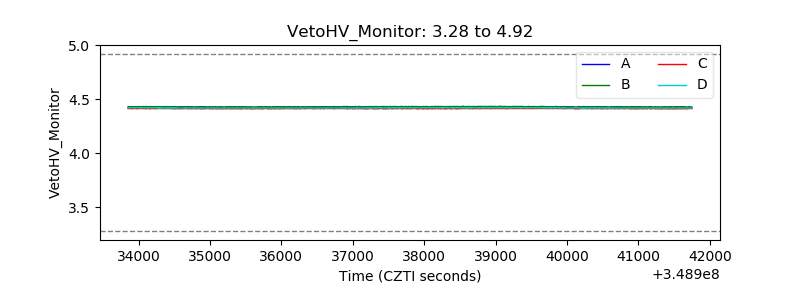 |
| Veto LLD | 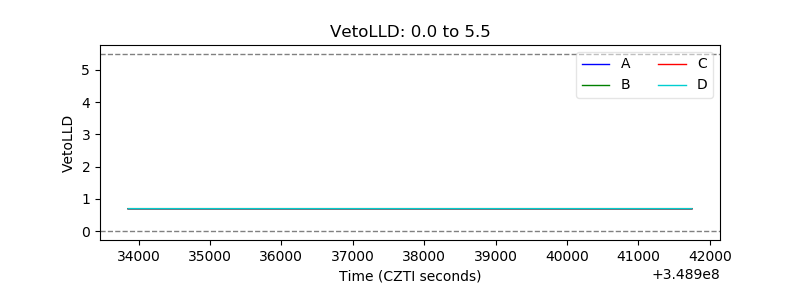 |
| Alpha Counter | 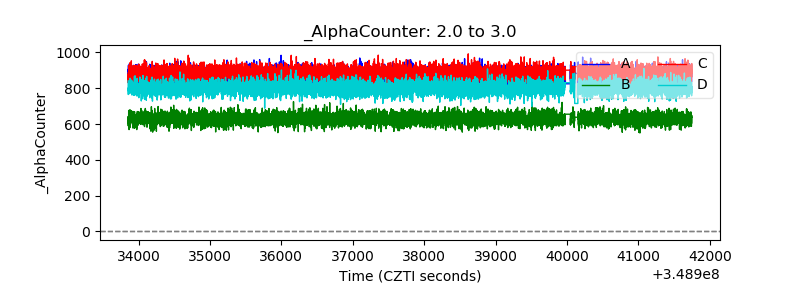 |
| _CPM_Rate | 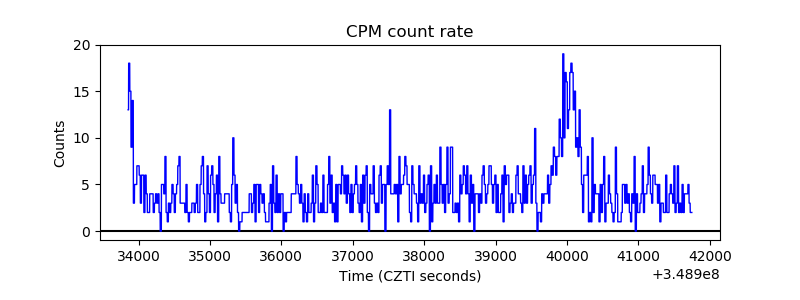 |
| CZT Counter | 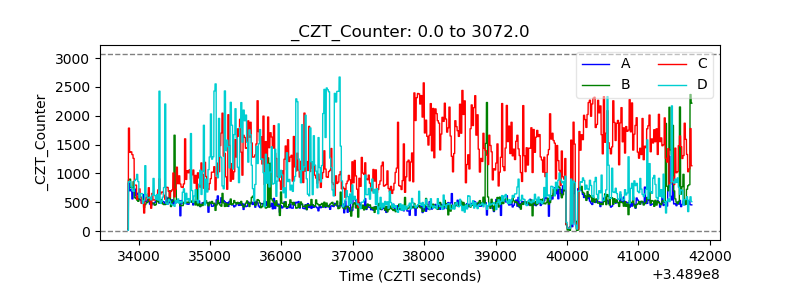 |
| +2.5 Volts monitor |  |
| +5 Volts monitor | 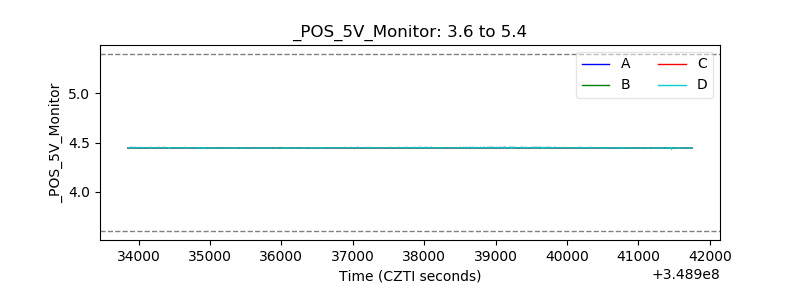 |
| _ROLL_ROT | 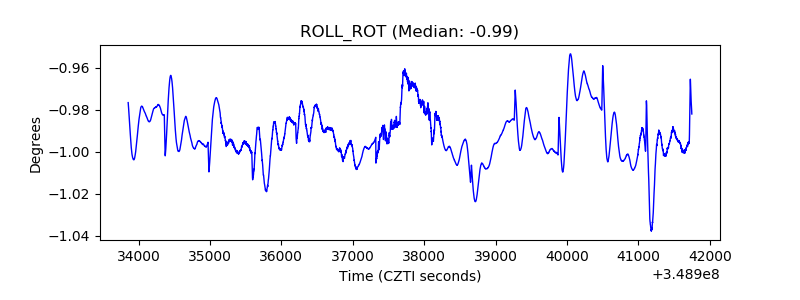 |
| _Roll_DEC | 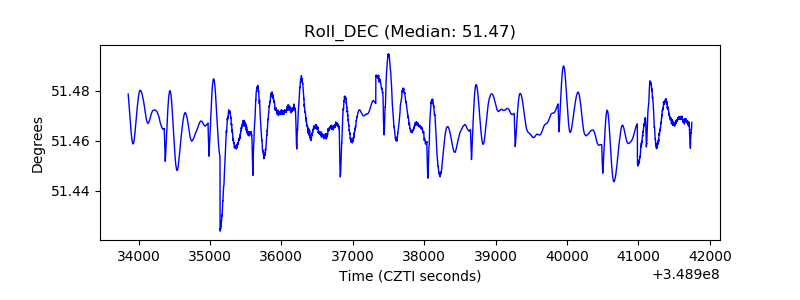 |
| _Roll_RA | 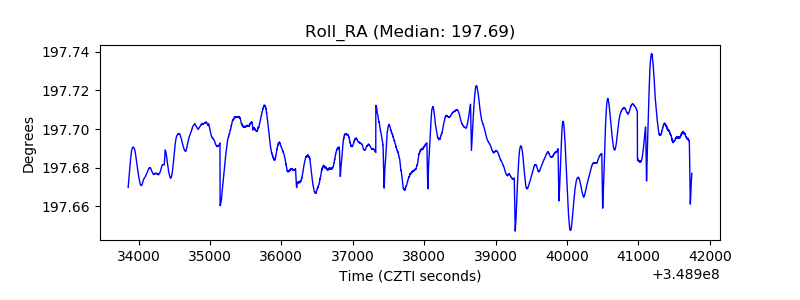 |
| Veto Counter | 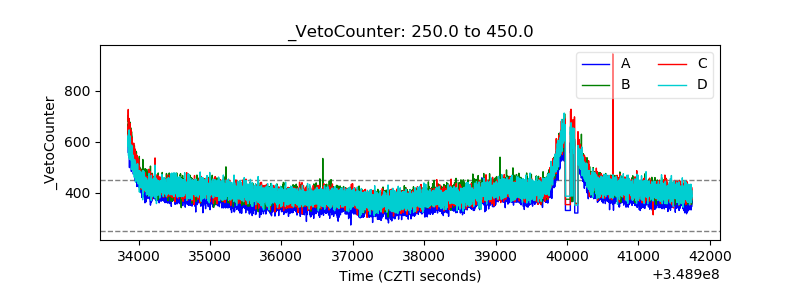 |