| Param | Original file | Final file |
|---|---|---|
| Filename | modeM0/AS1A10_123T08_9000004126_28753cztM0_level2.evt | modeM0/AS1A10_123T08_9000004126_28753cztM0_level2_quad_clean.evt |
| Size (bytes) | 701,507,520 | 79,223,040 |
| Size | 669.0 MB | 75.6 MB |
| Events in quadrant A | 3,557,653 | 487,631 |
| Events in quadrant B | 3,845,362 | 492,746 |
| Events in quadrant C | 7,392,652 | 458,961 |
| Events in quadrant D | 5,962,254 | 457,327 |
| Mode M0 | |||
|---|---|---|---|
| Quadrant | BADHDUFLAG | Total packets | Discarded packets |
| A | 0 | 15194 | 1 |
| B | 0 | 15995 | 1 |
| C | 0 | 27038 | 1 |
| D | 0 | 22804 | 1 |
| Mode SS | |||
|---|---|---|---|
| Quadrant | BADHDUFLAG | Total packets | Discarded packets |
| A | 0 | 146 | 0 |
| B | 0 | 146 | 0 |
| C | 0 | 146 | 0 |
| D | 0 | 146 | 0 |
| Mode M9 | |||
|---|---|---|---|
| Quadrant | BADHDUFLAG | Total packets | Discarded packets |
| A | 0 | 3 | 0 |
| B | 0 | 3 | 0 |
| C | 0 | 3 | 0 |
| D | 0 | 3 | 0 |
| Quadrant | Total seconds | Saturated seconds | Saturation percentage |
|---|---|---|---|
| A | 7211 | 64 | 0.887533% |
| B | 7212 | 185 | 2.565169% |
| C | 7212 | 962 | 13.338880% |
| D | 7212 | 391 | 5.421520% |
Noise dominated data is calculated using 1-second bins in cleaned event files. If a bin has >2000 counts, and if more than 50% of those come from <1% of pixels, then it is considered to be noise-dominated and hence unusable.
| Quadrant | # 1 sec bins | Bins with >0 counts | Bins with >2000 counts | High rate bins dominated by noise | Noise dominated (total time) | Noise dominated (detector-on time) | Marked lightcurve |
|---|---|---|---|---|---|---|---|
| A | 7556 | 7212 | 4 | 4 | 0.05% | 0.06% | 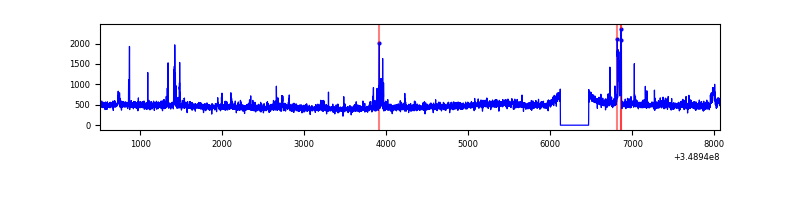 |
| B | 7557 | 7212 | 96 | 96 | 1.27% | 1.33% | 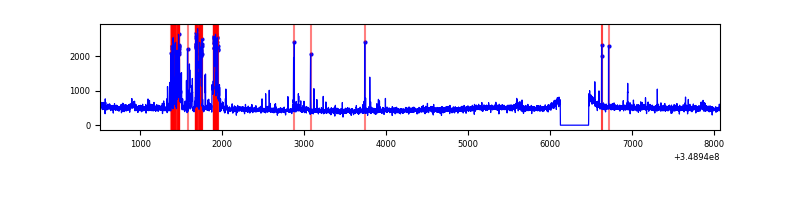 |
| C | 7557 | 7212 | 280 | 280 | 3.71% | 3.88% |  |
| D | 7556 | 7211 | 308 | 308 | 4.08% | 4.27% | 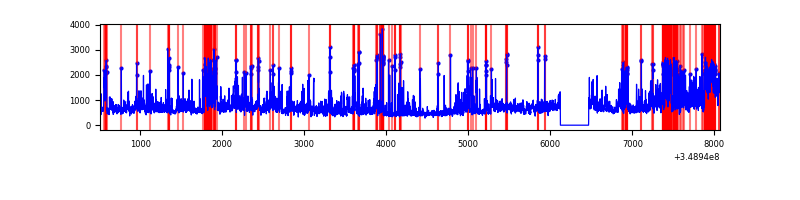 |
Top three noisy pixels from each quadrant. If the there are fewer than three noisy pixels in the level2.evt file, extra rows are filled as -1
| Pixel properties | Quadrant properties | ||||||
|---|---|---|---|---|---|---|---|
| Quadrant | DetID | PixID | Counts | Sigma | Mean | Median | Sigma |
| A | 15 | 174 | 103052 | 574.53 | 867 | 847 | 177.9 |
| A | 12 | 16 | 57606 | 319.06 | 867 | 847 | 177.9 |
| A | 14 | 239 | 29806 | 162.79 | 867 | 847 | 177.9 |
| B | 4 | 80 | 458917 | 2836.14 | 851 | 830 | 161.5 |
| B | 12 | 111 | 20116 | 119.41 | 851 | 830 | 161.5 |
| B | 11 | 111 | 18292 | 108.11 | 851 | 830 | 161.5 |
| C | 3 | 233 | 4007416 | 21252.28 | 807 | 810 | 188.5 |
| C | 14 | 238 | 154782 | 816.72 | 807 | 810 | 188.5 |
| C | 14 | 254 | 39093 | 203.06 | 807 | 810 | 188.5 |
| D | 8 | 195 | 1330562 | 6777.07 | 825 | 801 | 196.2 |
| D | 1 | 52 | 1307628 | 6660.19 | 825 | 801 | 196.2 |
| D | 2 | 250 | 71492 | 360.27 | 825 | 801 | 196.2 |
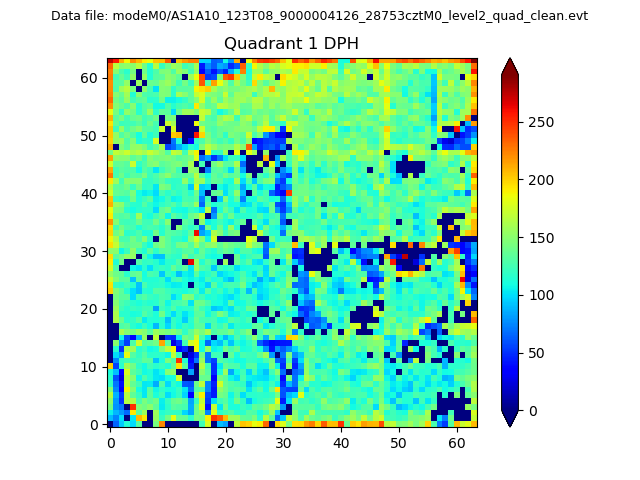
Histogram calculated using DETX and DETY for each event in the final _common_clean file
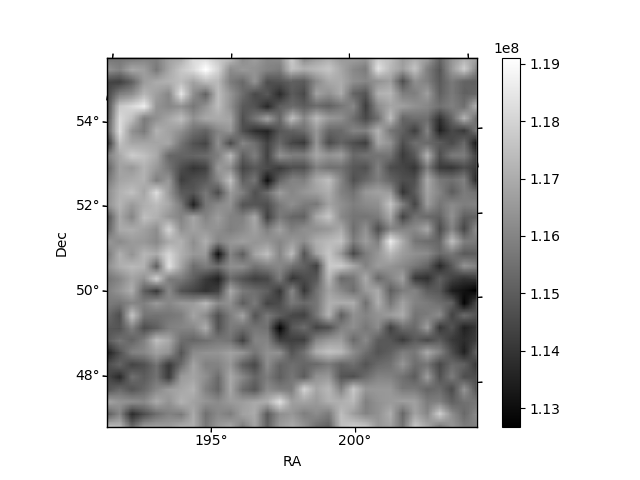
| Quadrant A |  |
 |
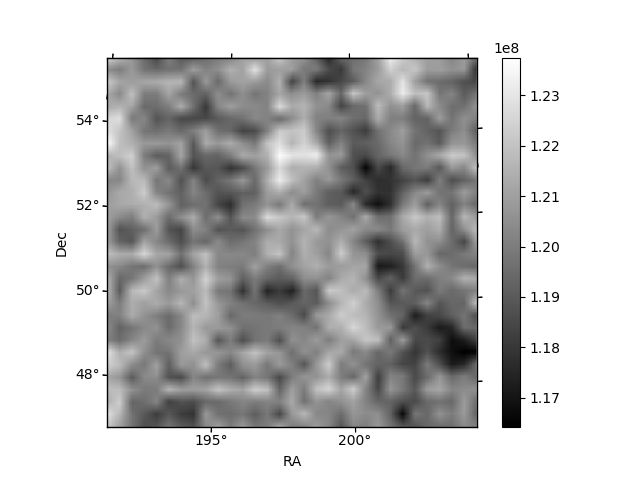
Quadrant B |
|---|---|---|---|
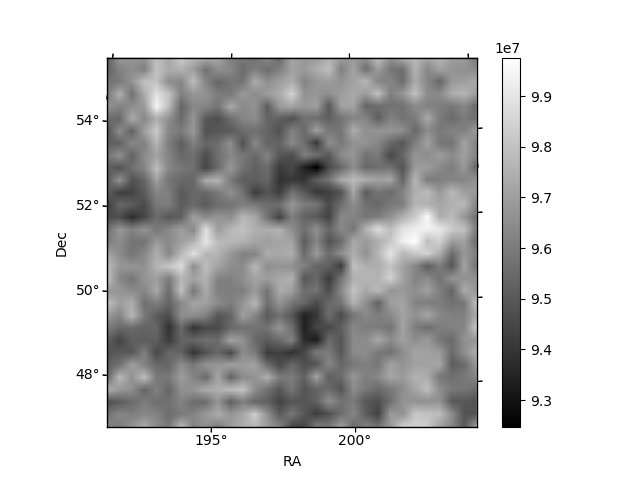
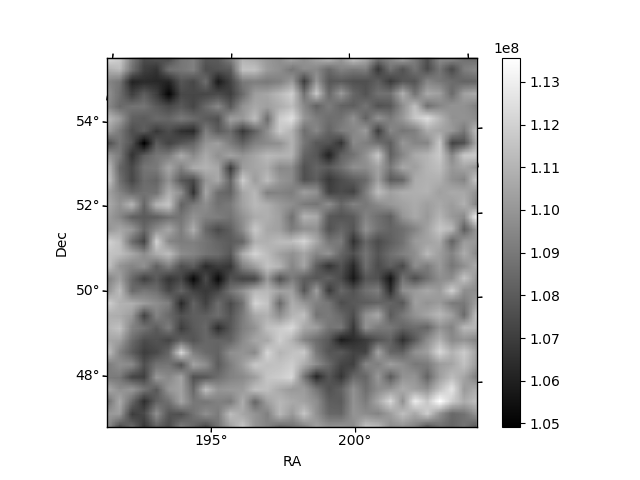
| Quadrant D |  |
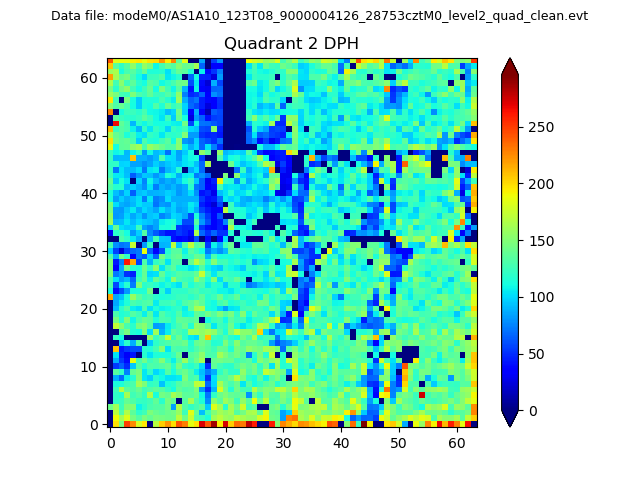 |
Quadrant C |
| Plot type | Count rate plots | Images |
|---|---|---|
| Comparison with Poisson distribution Blue bars denote a histogram of data divided into 1 sec bins. Red curve is a Poisson curve with rate = median count rate of data. |
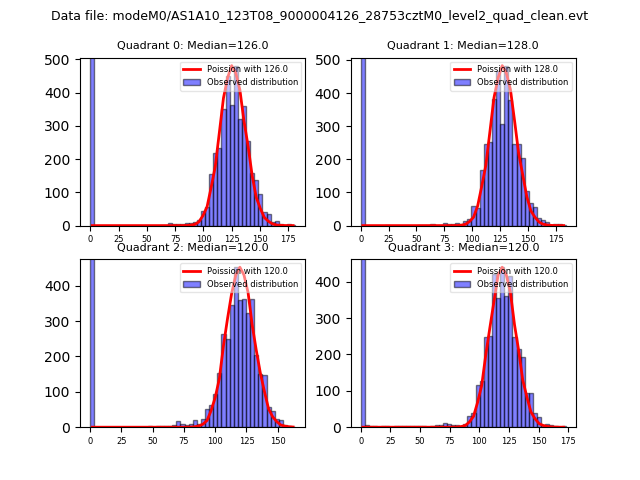 |
 |
| Quadrant-wise count rates Data is divided into 100 sec bins |
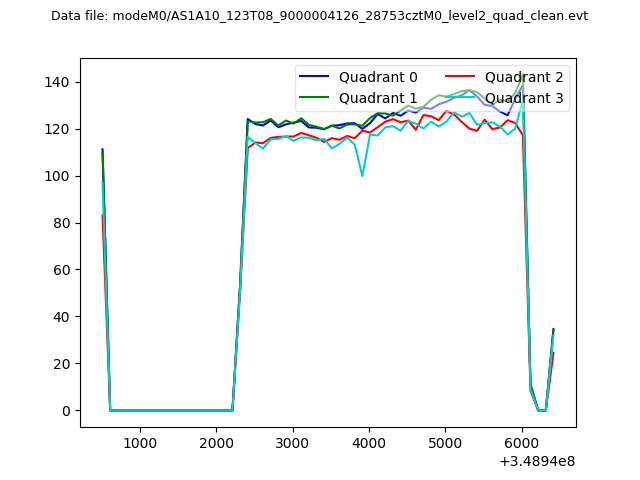 |
|
| Module-wise count rates for Quadrant A Data is divided into 100 sec bins |
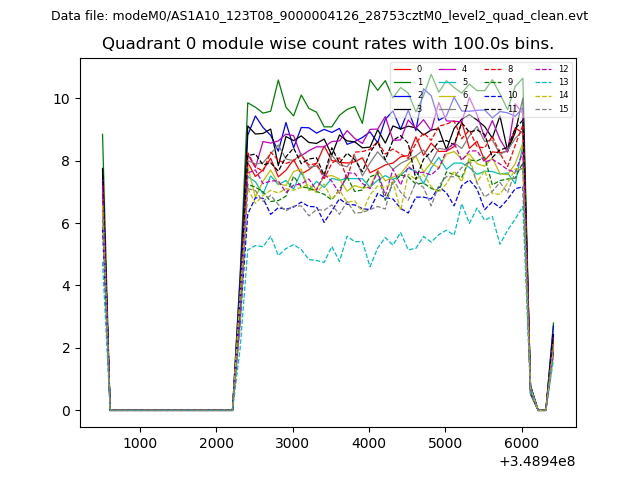 |
 |
| Module-wise count rates for Quadrant B Data is divided into 100 sec bins |
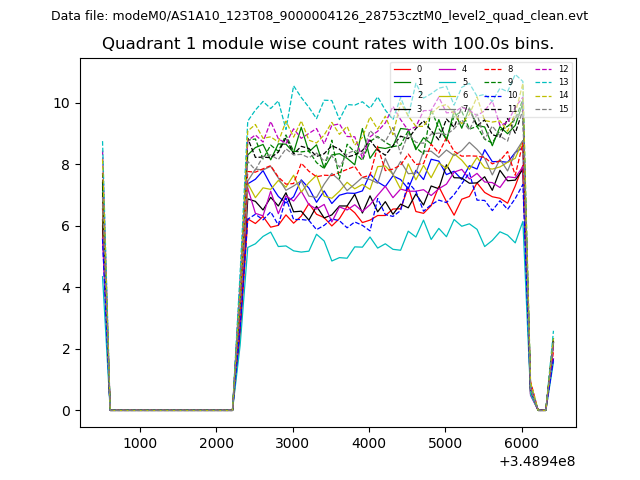 |
 |
| Module-wise count rates for Quadrant C Data is divided into 100 sec bins |
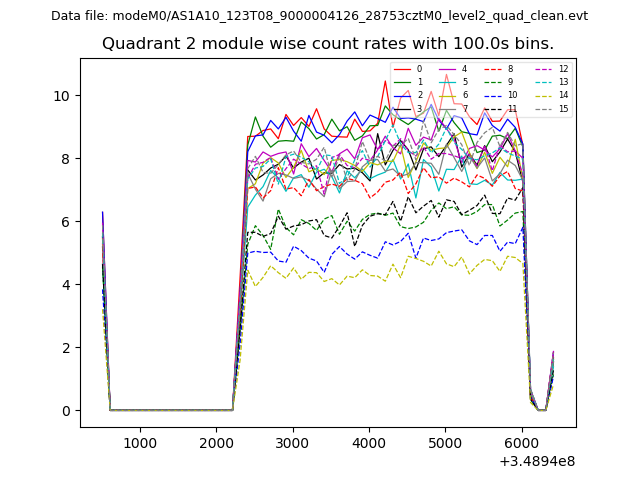 |
 |
| Module-wise count rates for Quadrant D Data is divided into 100 sec bins |
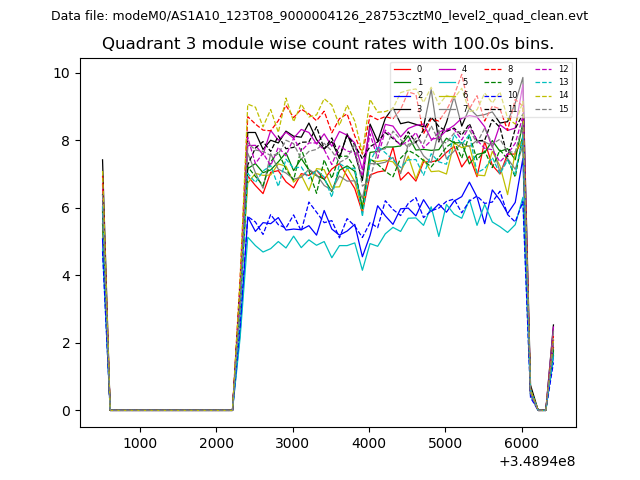 |
 |
| Parameter | Plot |
|---|---|
| CZT HV Monitor |  |
| D_VDD | 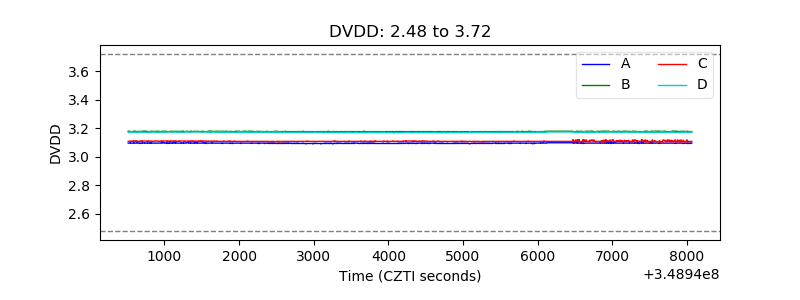 |
| Temperature 1 | 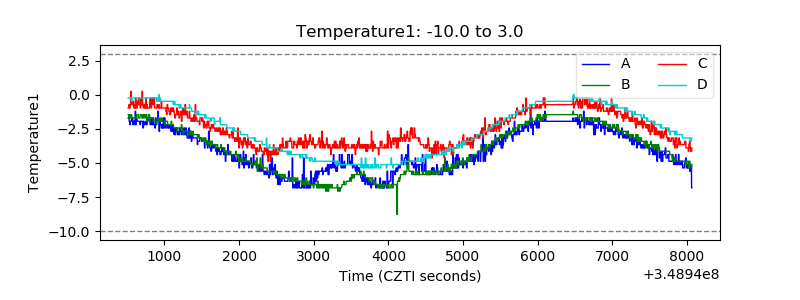 |
| Veto HV Monitor | 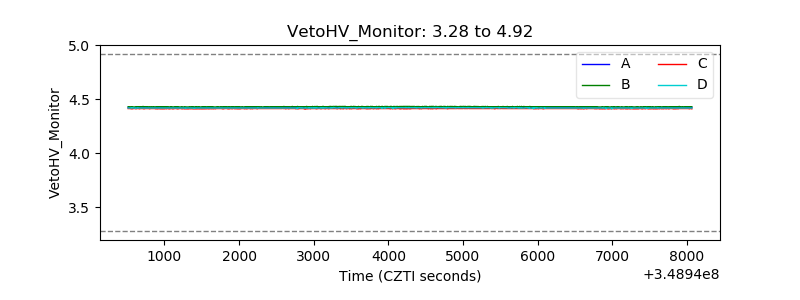 |
| Veto LLD | 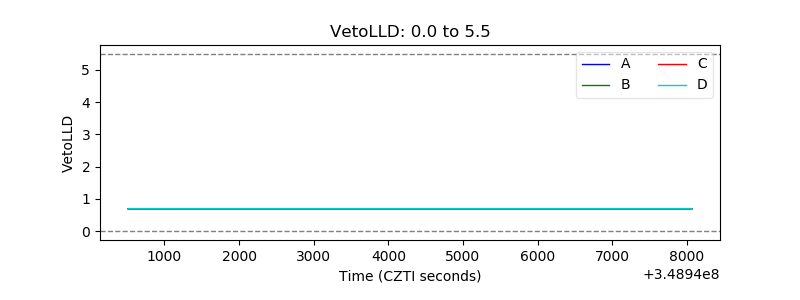 |
| Alpha Counter | 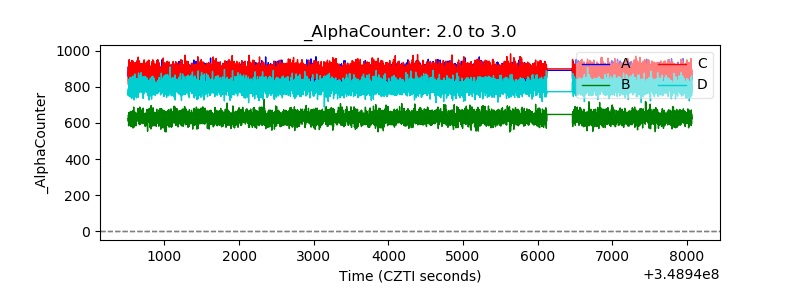 |
| _CPM_Rate | 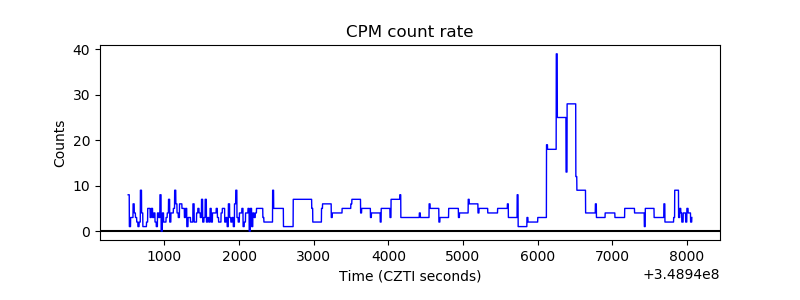 |
| CZT Counter | 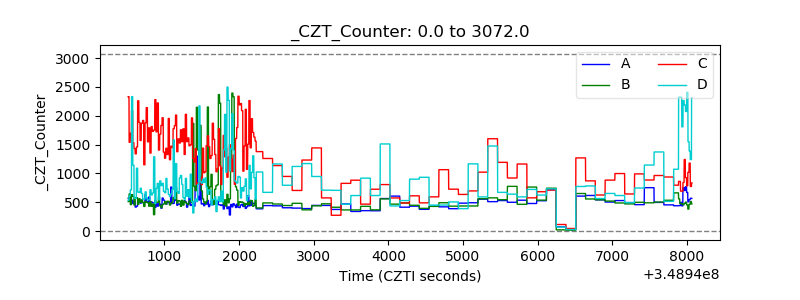 |
| +2.5 Volts monitor |  |
| +5 Volts monitor | 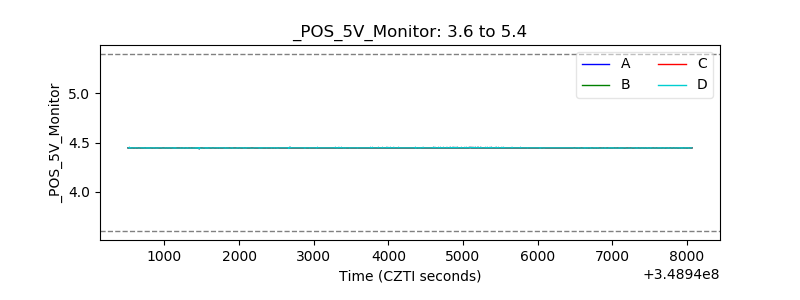 |
| _ROLL_ROT | 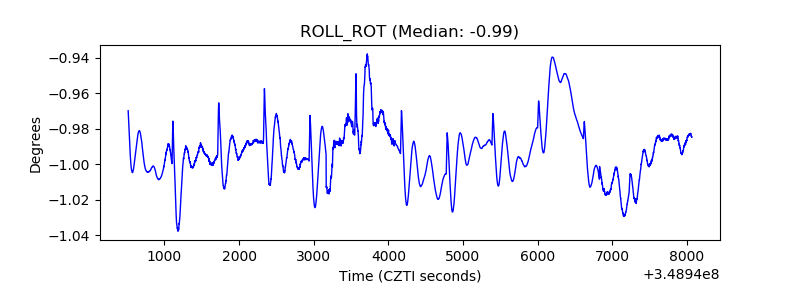 |
| _Roll_DEC | 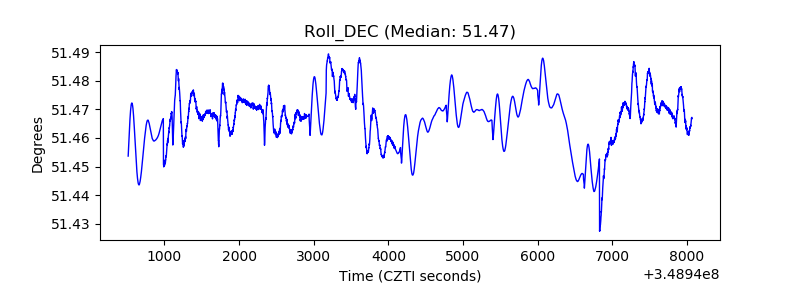 |
| _Roll_RA | 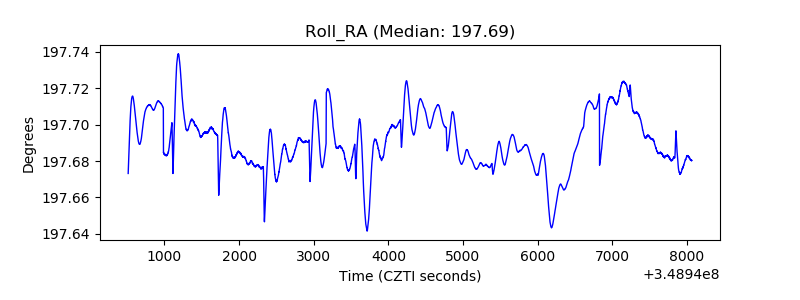 |
| Veto Counter | 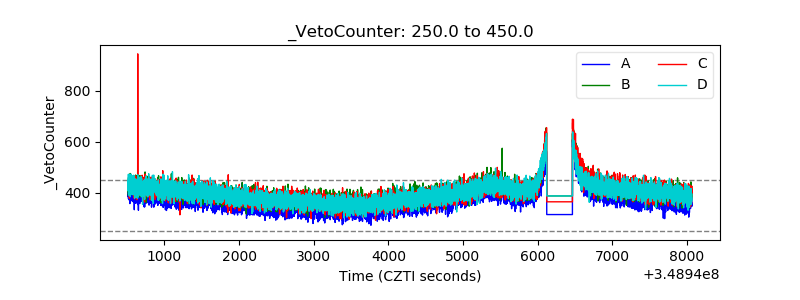 |