| Param | Original file | Final file |
|---|---|---|
| Filename | modeM0/AS1A10_123T08_9000004126_28755cztM0_level2.evt | modeM0/AS1A10_123T08_9000004126_28755cztM0_level2_quad_clean.evt |
| Size (bytes) | 224,305,920 | 10,676,160 |
| Size | 213.9 MB | 10.2 MB |
| Events in quadrant A | 1,141,853 | 43,649 |
| Events in quadrant B | 1,106,428 | 43,823 |
| Events in quadrant C | 1,973,940 | 40,040 |
| Events in quadrant D | 2,424,609 | 40,408 |
| Mode M0 | |||
|---|---|---|---|
| Quadrant | BADHDUFLAG | Total packets | Discarded packets |
| A | 0 | 4715 | 1 |
| B | 0 | 4571 | 1 |
| C | 0 | 7384 | 1 |
| D | 0 | 8738 | 1 |
| Mode SS | |||
|---|---|---|---|
| Quadrant | BADHDUFLAG | Total packets | Discarded packets |
| A | 0 | 44 | 0 |
| B | 0 | 44 | 0 |
| C | 0 | 44 | 0 |
| D | 0 | 44 | 0 |
| Mode M9 | |||
|---|---|---|---|
| Quadrant | BADHDUFLAG | Total packets | Discarded packets |
| A | 0 | 1 | 0 |
| B | 0 | 2 | 0 |
| C | 0 | 2 | 0 |
| D | 0 | 2 | 0 |
| Quadrant | Total seconds | Saturated seconds | Saturation percentage |
|---|---|---|---|
| A | 2127 | 21 | 0.987306% |
| B | 2127 | 33 | 1.551481% |
| C | 2127 | 130 | 6.111895% |
| D | 2127 | 207 | 9.732017% |
Noise dominated data is calculated using 1-second bins in cleaned event files. If a bin has >2000 counts, and if more than 50% of those come from <1% of pixels, then it is considered to be noise-dominated and hence unusable.
| Quadrant | # 1 sec bins | Bins with >0 counts | Bins with >2000 counts | High rate bins dominated by noise | Noise dominated (total time) | Noise dominated (detector-on time) | Marked lightcurve |
|---|---|---|---|---|---|---|---|
| A | 2127 | 2127 | 3 | 3 | 0.14% | 0.14% | 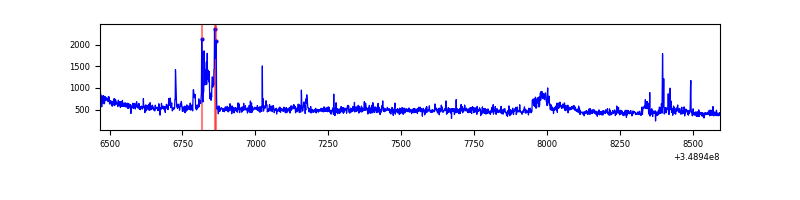 |
| B | 2127 | 2127 | 6 | 6 | 0.28% | 0.28% | 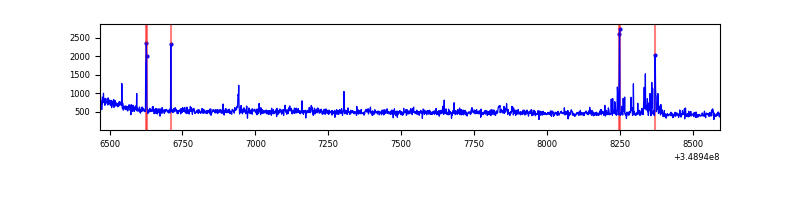 |
| C | 2127 | 2127 | 1 | 1 | 0.05% | 0.05% | 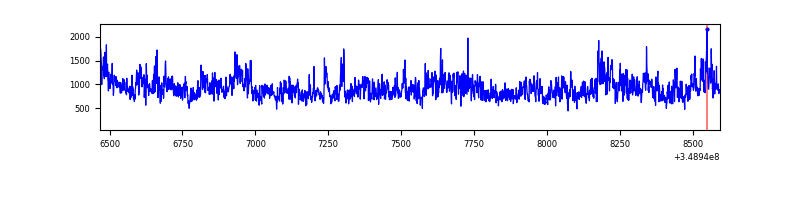 |
| D | 2127 | 2127 | 193 | 193 | 9.07% | 9.07% | 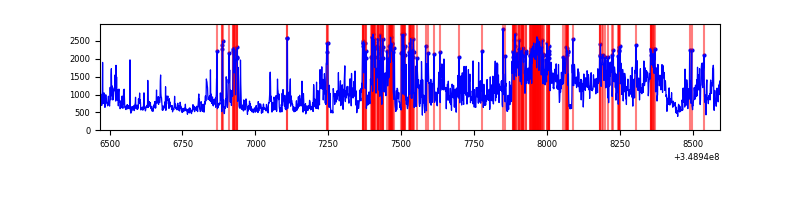 |
Top three noisy pixels from each quadrant. If the there are fewer than three noisy pixels in the level2.evt file, extra rows are filled as -1
| Pixel properties | Quadrant properties | ||||||
|---|---|---|---|---|---|---|---|
| Quadrant | DetID | PixID | Counts | Sigma | Mean | Median | Sigma |
| A | 15 | 174 | 105989 | 1881.95 | 265 | 257 | 56.2 |
| A | 12 | 16 | 9734 | 168.68 | 265 | 257 | 56.2 |
| A | 13 | 254 | 4163 | 69.52 | 265 | 257 | 56.2 |
| B | 5 | 255 | 36932 | 709.47 | 262 | 256 | 51.7 |
| B | 4 | 80 | 21904 | 418.76 | 262 | 256 | 51.7 |
| B | 10 | 245 | 8601 | 161.43 | 262 | 256 | 51.7 |
| C | 3 | 233 | 899853 | 14776.77 | 253 | 253 | 60.9 |
| C | 14 | 238 | 43649 | 712.82 | 253 | 253 | 60.9 |
| C | 0 | 207 | 25256 | 410.7 | 253 | 253 | 60.9 |
| D | 8 | 195 | 887358 | 14152.78 | 253 | 245 | 62.7 |
| D | 1 | 52 | 478387 | 7628.16 | 253 | 245 | 62.7 |
| D | 2 | 250 | 47184 | 748.85 | 253 | 245 | 62.7 |
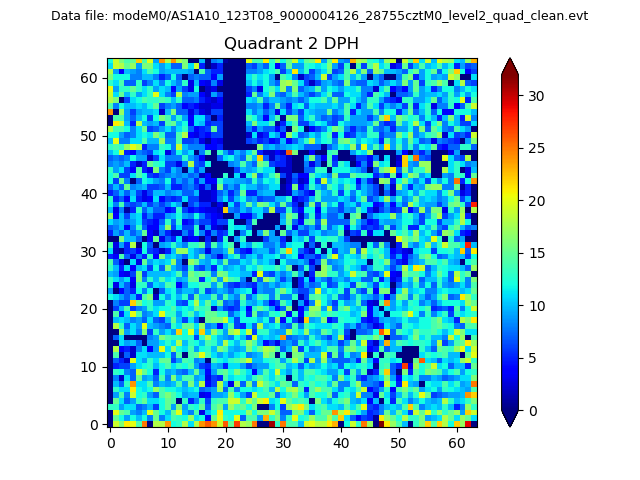
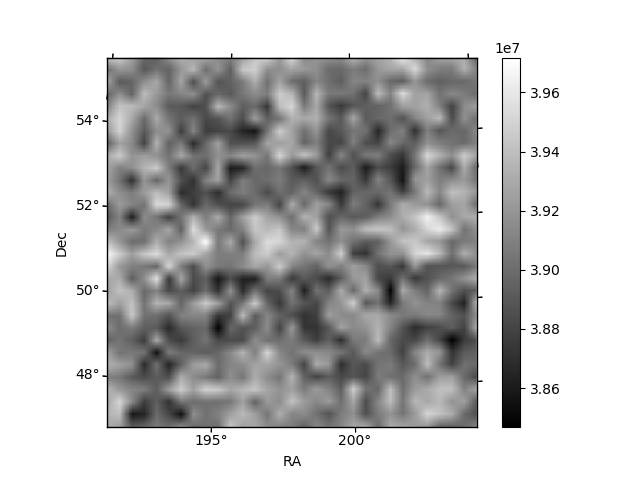
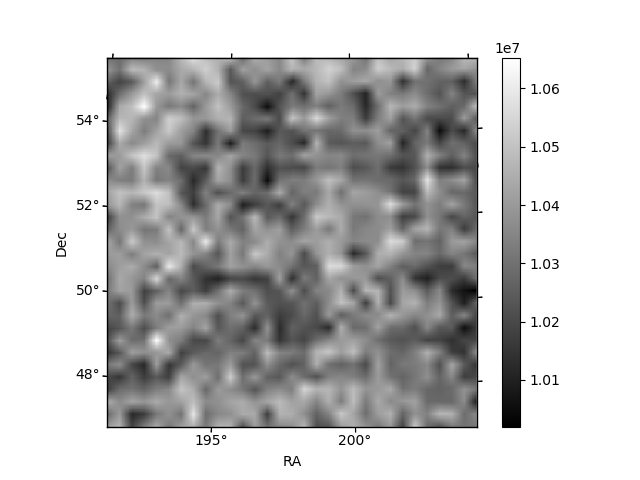
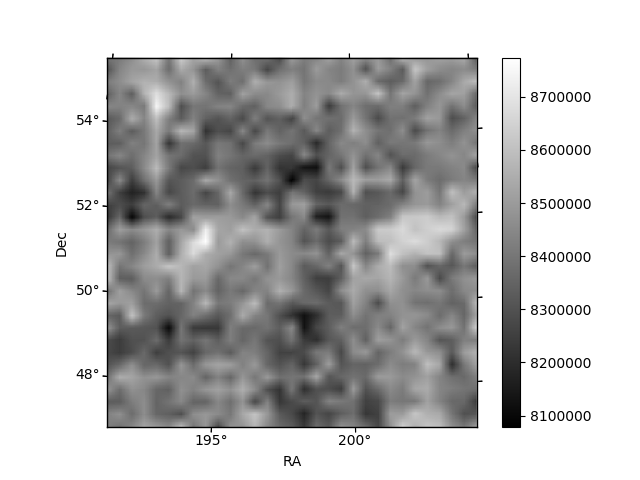
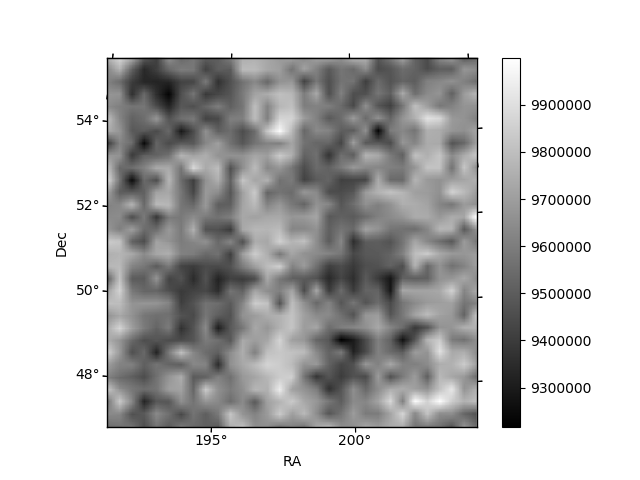
Histogram calculated using DETX and DETY for each event in the final _common_clean file
| Quadrant A | 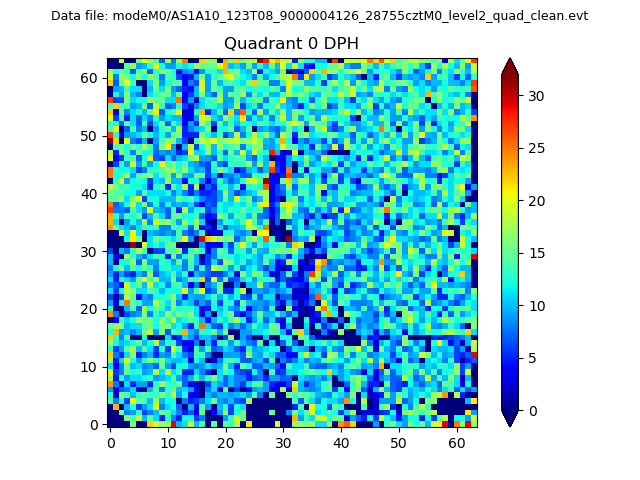 |
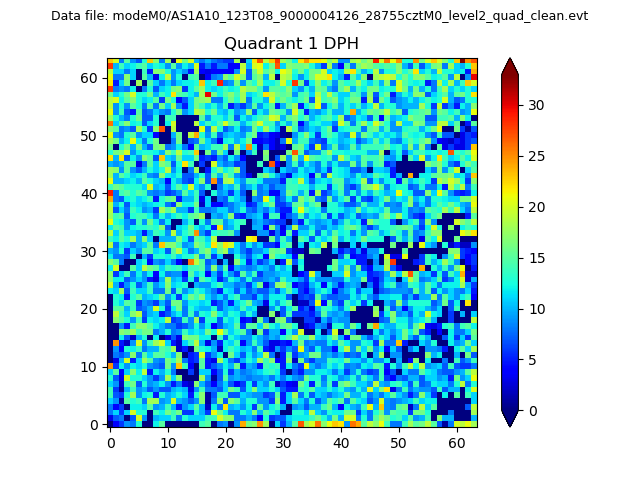 |
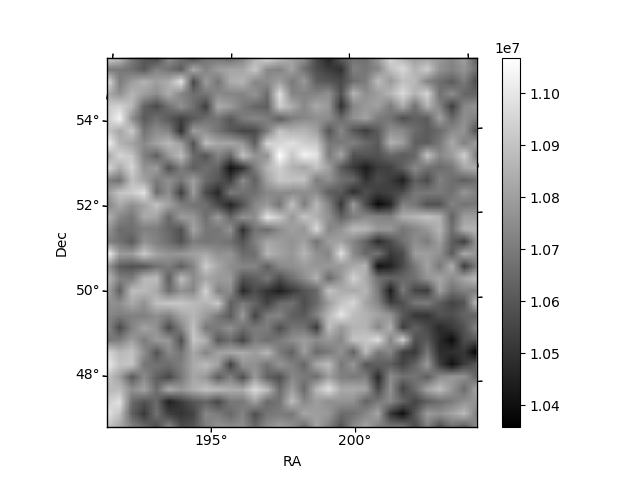
Quadrant B |
|---|---|---|---|
| Quadrant D | 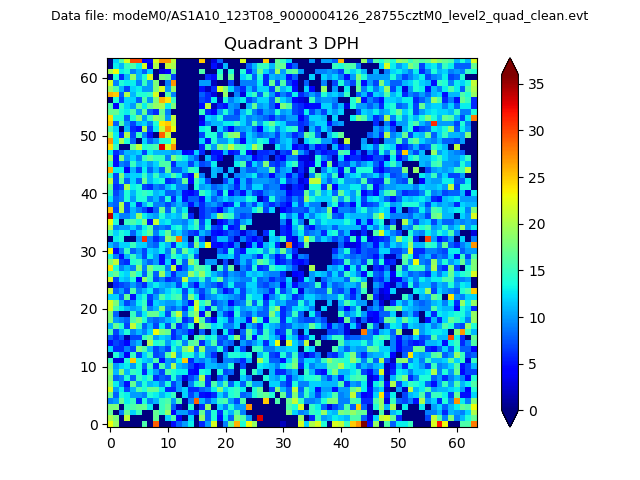 |
 |
Quadrant C |
| Plot type | Count rate plots | Images |
|---|---|---|
| Comparison with Poisson distribution Blue bars denote a histogram of data divided into 1 sec bins. Red curve is a Poisson curve with rate = median count rate of data. |
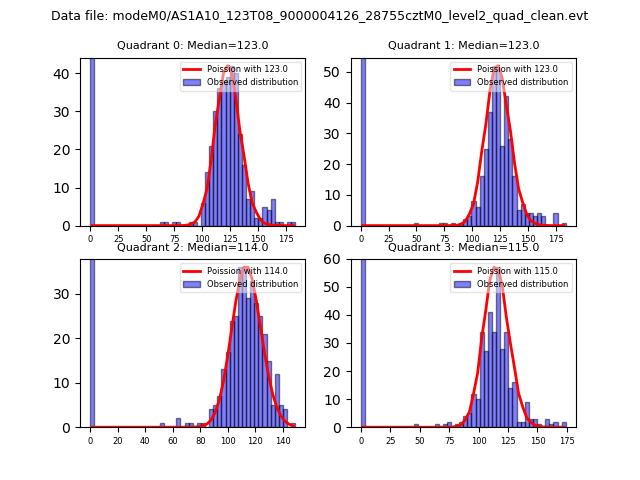 |
 |
| Quadrant-wise count rates Data is divided into 100 sec bins |
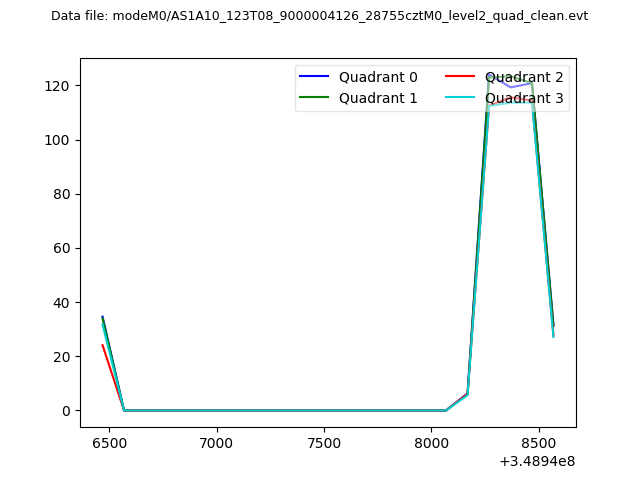 |
|
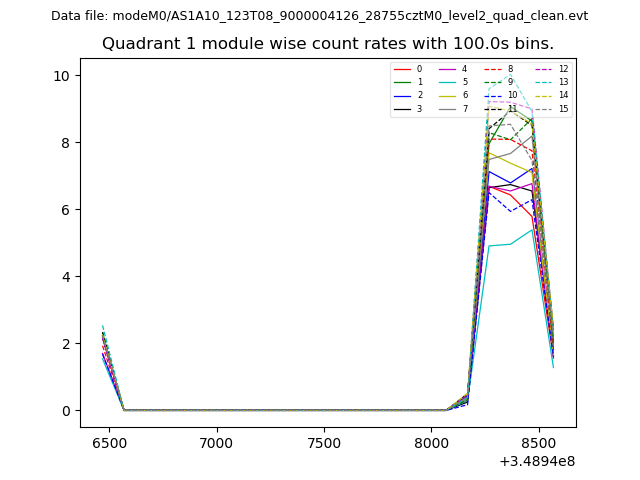
| Module-wise count rates for Quadrant A Data is divided into 100 sec bins |
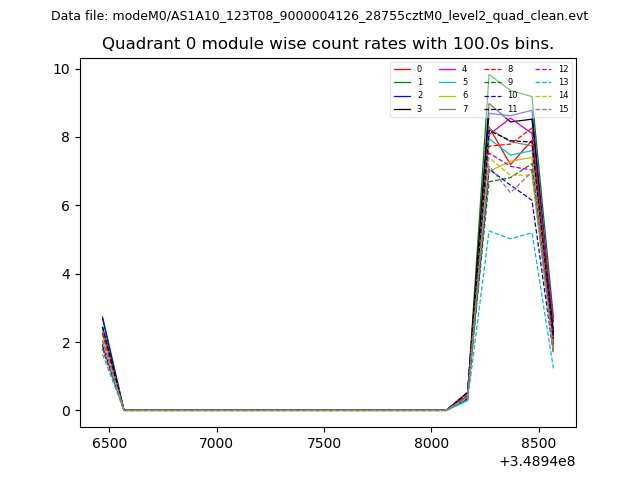 |
 |
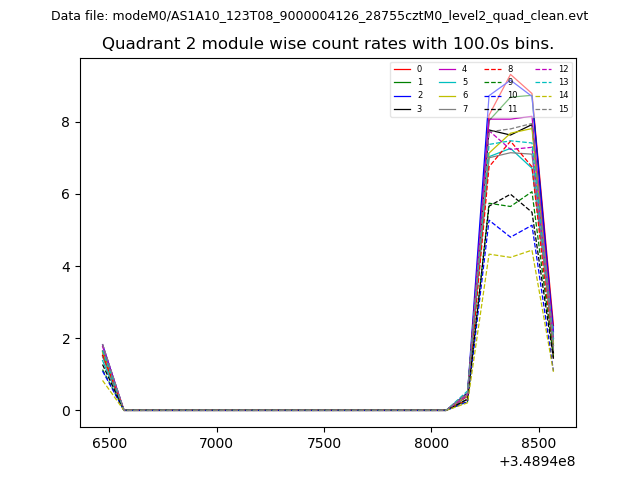
| Module-wise count rates for Quadrant B Data is divided into 100 sec bins |
 |
 |
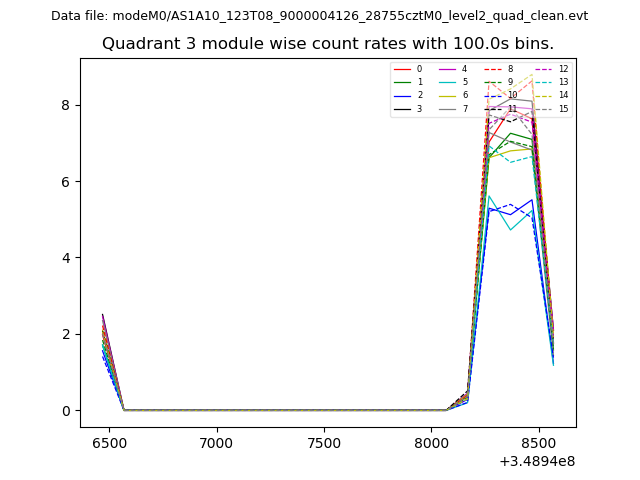
| Module-wise count rates for Quadrant C Data is divided into 100 sec bins |
 |
 |
| Module-wise count rates for Quadrant D Data is divided into 100 sec bins |
 |
 |
| Parameter | Plot |
|---|---|
| CZT HV Monitor | 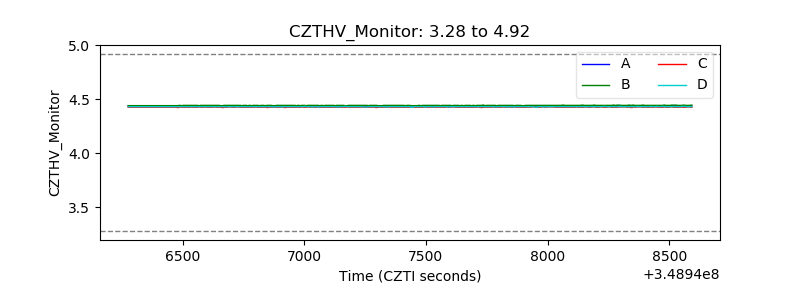 |
| D_VDD | 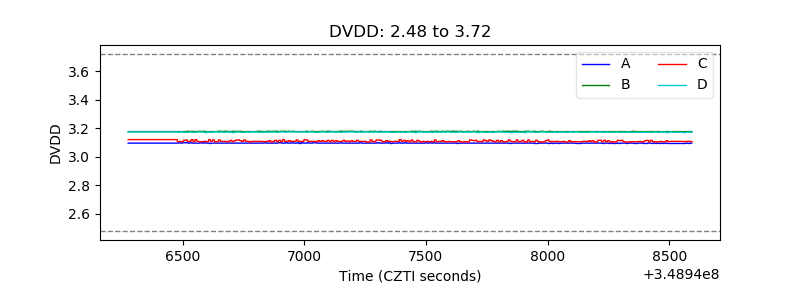 |
| Temperature 1 |  |
| Veto HV Monitor | 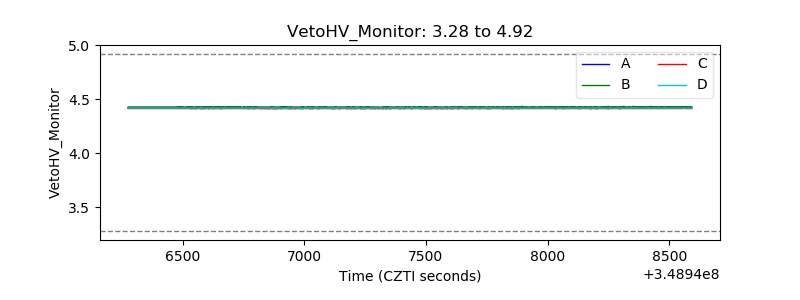 |
| Veto LLD |  |
| Alpha Counter | 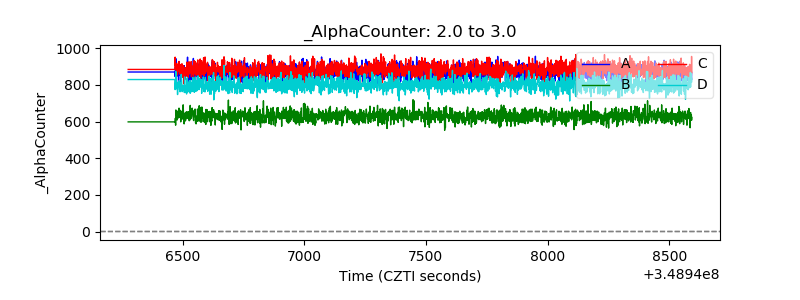 |
| _CPM_Rate | 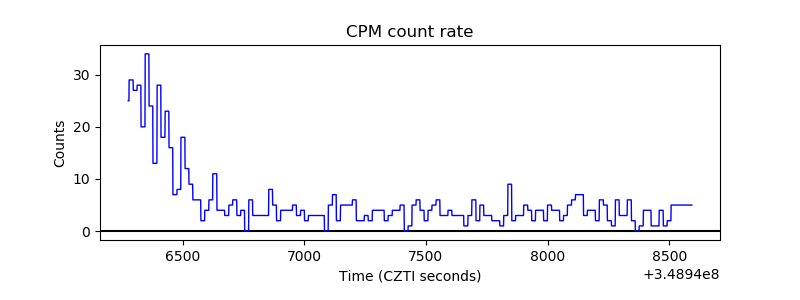 |
| CZT Counter | 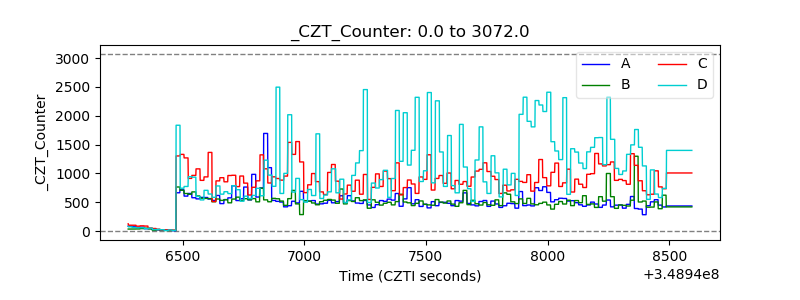 |
| +2.5 Volts monitor |  |
| +5 Volts monitor |  |
| _ROLL_ROT | 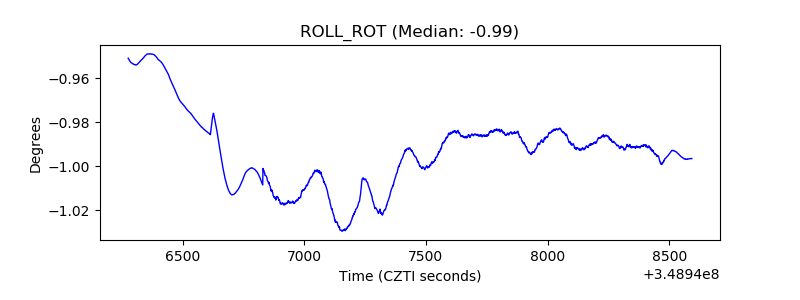 |
| _Roll_DEC | 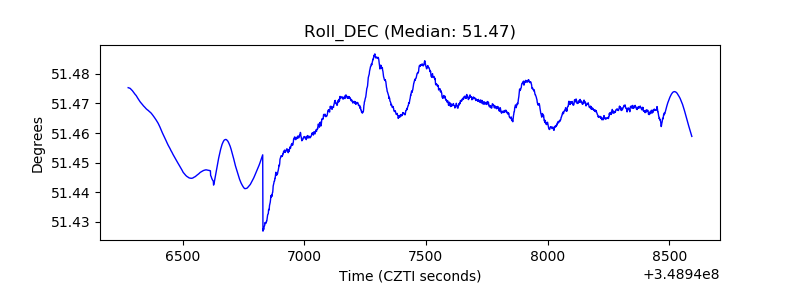 |
| _Roll_RA | 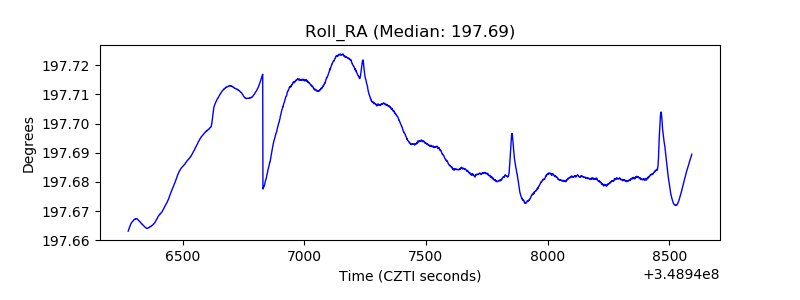 |
| Veto Counter | 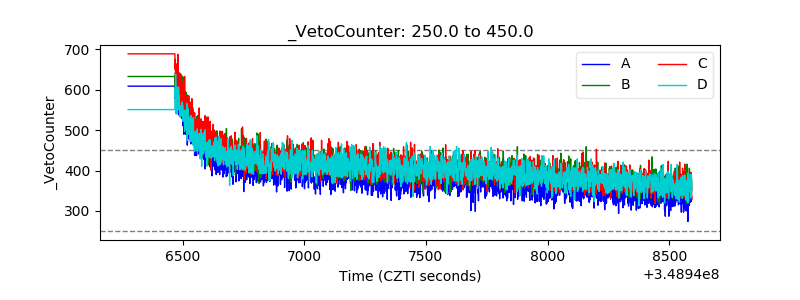 |