| Param | Original file | Final file |
|---|---|---|
| Filename | modeM0/AS1A10_093T01_9000004128_28755cztM0_level2.evt | modeM0/AS1A10_093T01_9000004128_28755cztM0_level2_quad_clean.evt |
| Size (bytes) | 966,617,280 | 118,080,000 |
| Size | 921.8 MB | 112.6 MB |
| Events in quadrant A | 4,774,959 | 762,122 |
| Events in quadrant B | 5,200,369 | 765,440 |
| Events in quadrant C | 9,398,223 | 695,429 |
| Events in quadrant D | 9,235,672 | 668,838 |
| Mode M9 | |||
|---|---|---|---|
| Quadrant | BADHDUFLAG | Total packets | Discarded packets |
| A | 0 | 13 | 0 |
| B | 0 | 13 | 0 |
| C | 0 | 13 | 0 |
| D | 0 | 13 | 0 |
| Mode M0 | |||
|---|---|---|---|
| Quadrant | BADHDUFLAG | Total packets | Discarded packets |
| A | 0 | 20662 | 2 |
| B | 0 | 21750 | 2 |
| C | 0 | 35124 | 2 |
| D | 0 | 34108 | 3 |
| Mode SS | |||
|---|---|---|---|
| Quadrant | BADHDUFLAG | Total packets | Discarded packets |
| A | 0 | 200 | 0 |
| B | 0 | 200 | 0 |
| C | 0 | 200 | 0 |
| D | 0 | 200 | 0 |
| Quadrant | Total seconds | Saturated seconds | Saturation percentage |
|---|---|---|---|
| A | 9866 | 96 | 0.973039% |
| B | 9866 | 172 | 1.743361% |
| C | 9866 | 745 | 7.551186% |
| D | 9865 | 1170 | 11.860112% |
Noise dominated data is calculated using 1-second bins in cleaned event files. If a bin has >2000 counts, and if more than 50% of those come from <1% of pixels, then it is considered to be noise-dominated and hence unusable.
| Quadrant | # 1 sec bins | Bins with >0 counts | Bins with >2000 counts | High rate bins dominated by noise | Noise dominated (total time) | Noise dominated (detector-on time) | Marked lightcurve |
|---|---|---|---|---|---|---|---|
| A | 11111 | 9866 | 8 | 8 | 0.07% | 0.08% | 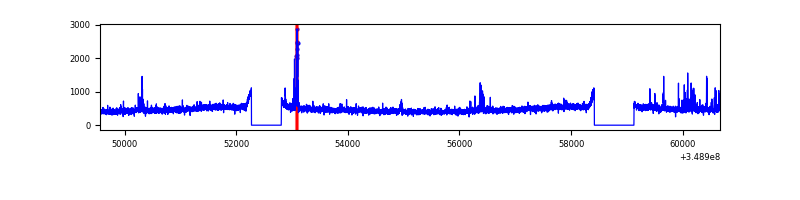 |
| B | 11111 | 9866 | 69 | 69 | 0.62% | 0.70% | 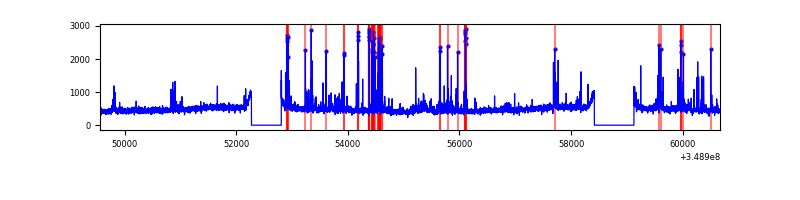 |
| C | 11111 | 9866 | 64 | 64 | 0.58% | 0.65% | 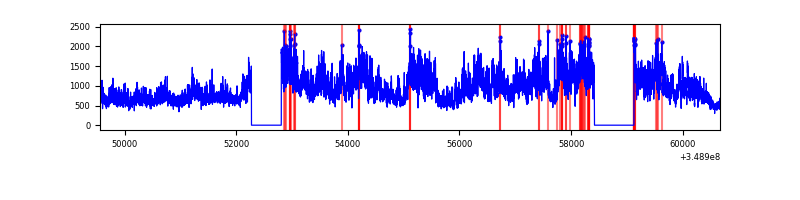 |
| D | 11110 | 9865 | 953 | 953 | 8.58% | 9.66% | 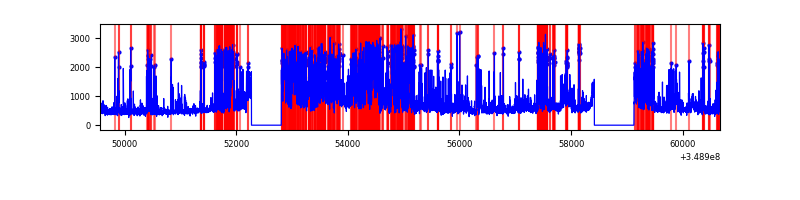 |
Top three noisy pixels from each quadrant. If the there are fewer than three noisy pixels in the level2.evt file, extra rows are filled as -1
| Pixel properties | Quadrant properties | ||||||
|---|---|---|---|---|---|---|---|
| Quadrant | DetID | PixID | Counts | Sigma | Mean | Median | Sigma |
| A | 15 | 174 | 87070 | 356.05 | 1190 | 1162 | 241.3 |
| A | 14 | 239 | 86554 | 353.92 | 1190 | 1162 | 241.3 |
| A | 13 | 254 | 17397 | 67.29 | 1190 | 1162 | 241.3 |
| B | 5 | 255 | 401293 | 1764.8 | 1176 | 1145 | 226.7 |
| B | 4 | 80 | 118456 | 517.38 | 1176 | 1145 | 226.7 |
| B | 0 | 183 | 37920 | 162.19 | 1176 | 1145 | 226.7 |
| C | 3 | 233 | 4773554 | 18220.08 | 1117 | 1122 | 261.9 |
| C | 14 | 238 | 201433 | 764.74 | 1117 | 1122 | 261.9 |
| C | 14 | 254 | 37186 | 137.68 | 1117 | 1122 | 261.9 |
| D | 1 | 52 | 2903264 | 11053.21 | 1102 | 1069 | 262.6 |
| D | 8 | 195 | 1879268 | 7153.25 | 1102 | 1069 | 262.6 |
| D | 12 | 233 | 93776 | 353.08 | 1102 | 1069 | 262.6 |
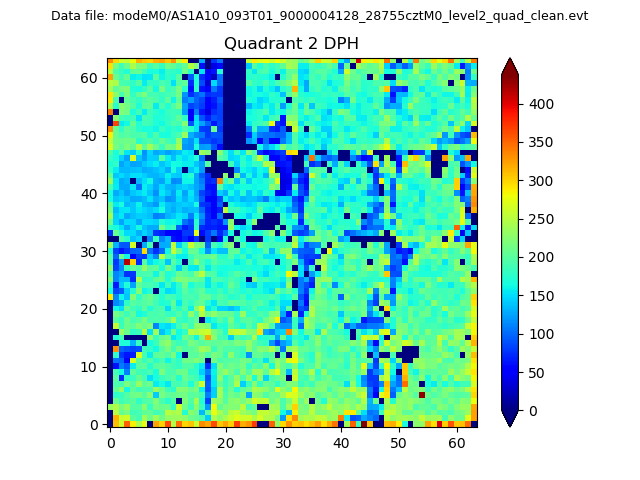
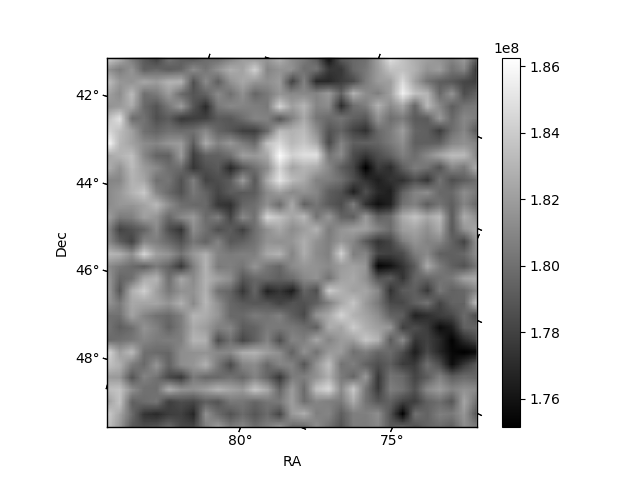
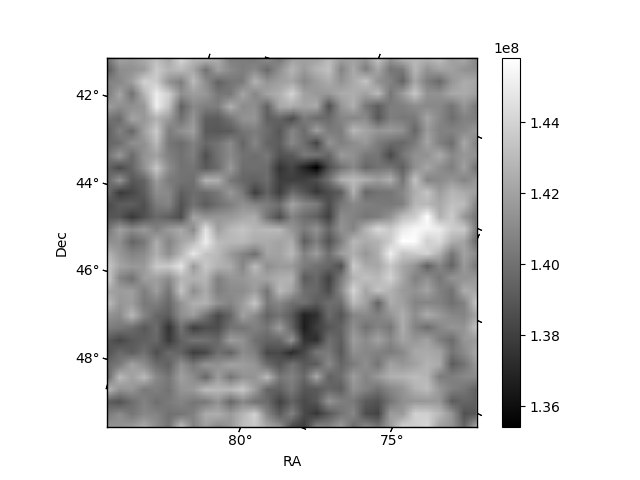
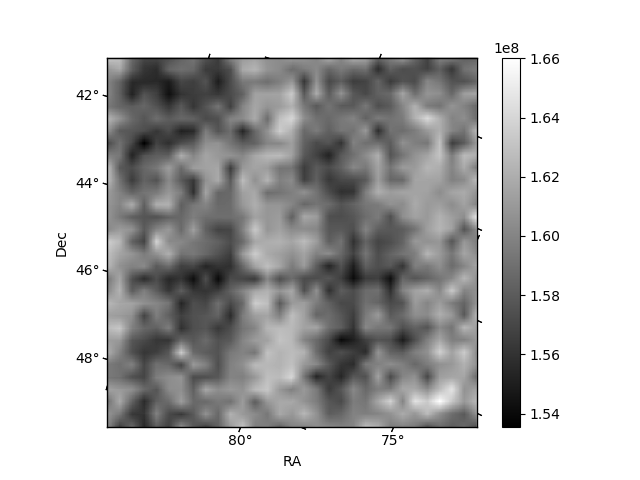
Histogram calculated using DETX and DETY for each event in the final _common_clean file
| Quadrant A | 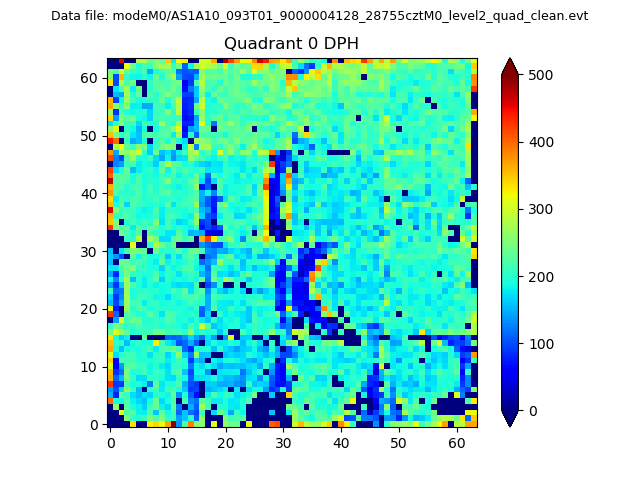 |
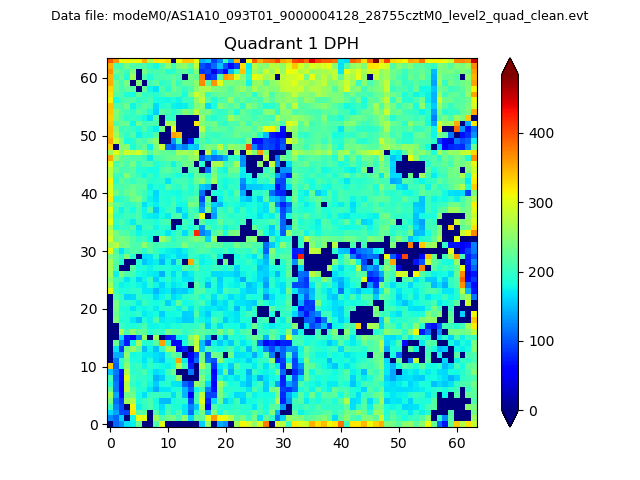 |
Quadrant B |
|---|---|---|---|
| Quadrant D | 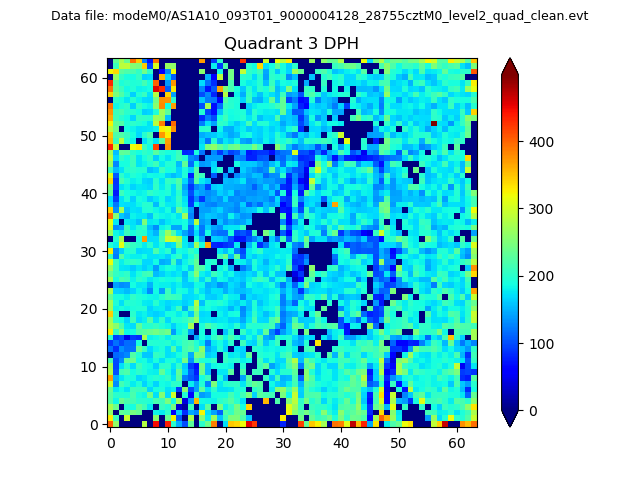 |
 |
Quadrant C |
| Plot type | Count rate plots | Images |
|---|---|---|
| Comparison with Poisson distribution Blue bars denote a histogram of data divided into 1 sec bins. Red curve is a Poisson curve with rate = median count rate of data. |
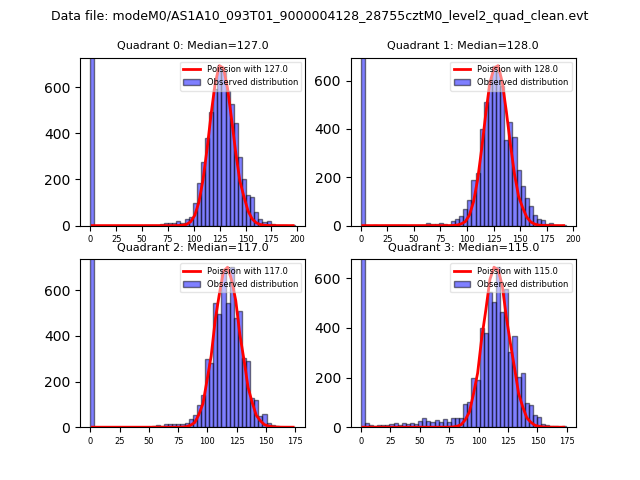 |
 |
| Quadrant-wise count rates Data is divided into 100 sec bins |
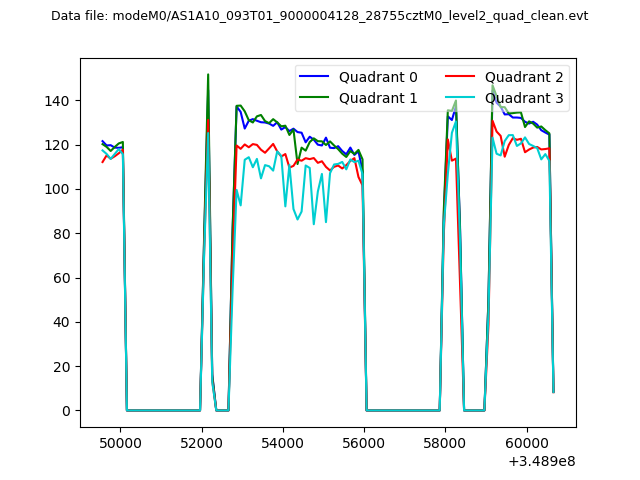 |
|
| Module-wise count rates for Quadrant A Data is divided into 100 sec bins |
 |
 |
| Module-wise count rates for Quadrant B Data is divided into 100 sec bins |
 |
 |
| Module-wise count rates for Quadrant C Data is divided into 100 sec bins |
 |
 |
| Module-wise count rates for Quadrant D Data is divided into 100 sec bins |
 |
 |
| Parameter | Plot |
|---|---|
| CZT HV Monitor |  |
| D_VDD | 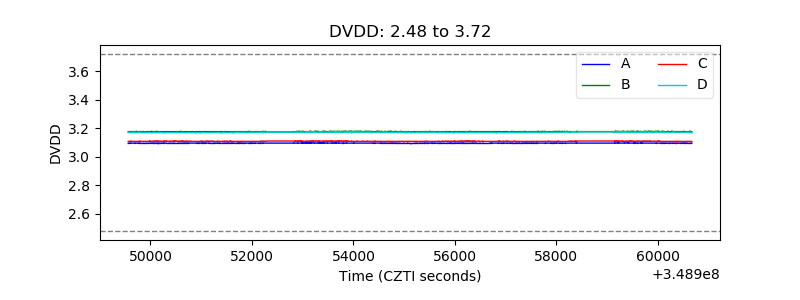 |
| Temperature 1 | 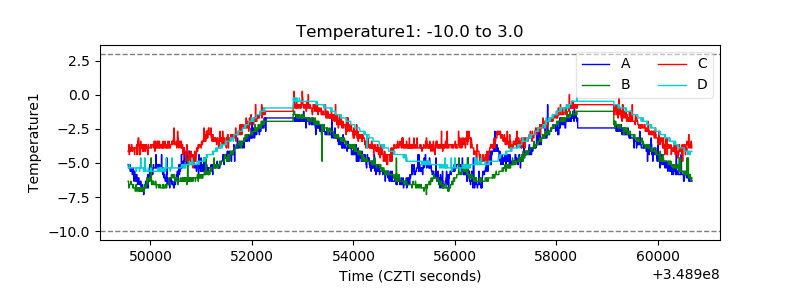 |
| Veto HV Monitor | 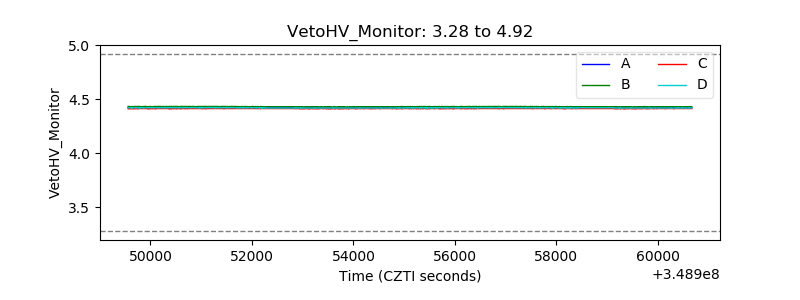 |
| Veto LLD | 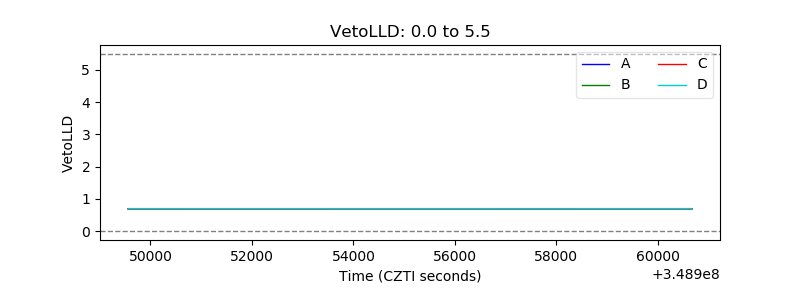 |
| Alpha Counter | 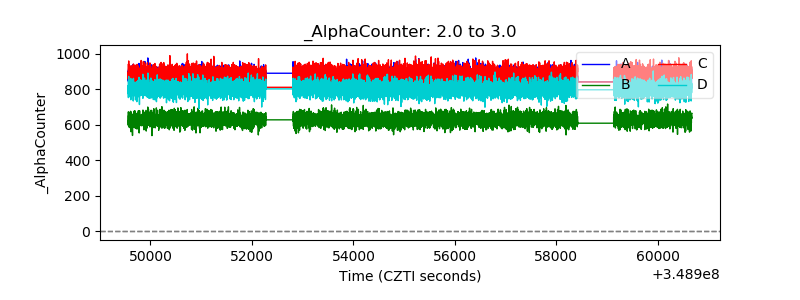 |
| _CPM_Rate | 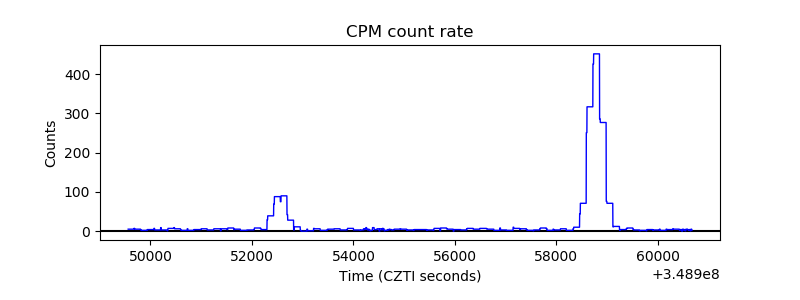 |
| CZT Counter |  |
| +2.5 Volts monitor |  |
| +5 Volts monitor |  |
| _ROLL_ROT | 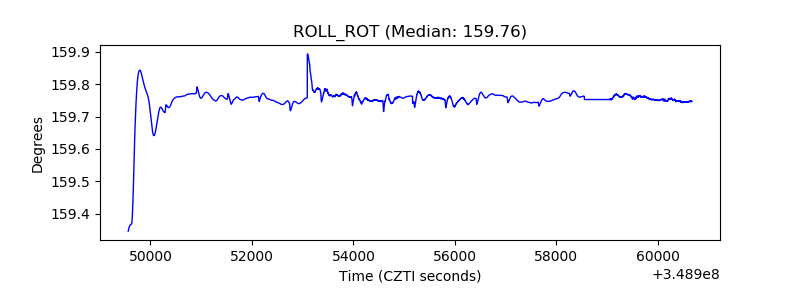 |
| _Roll_DEC | 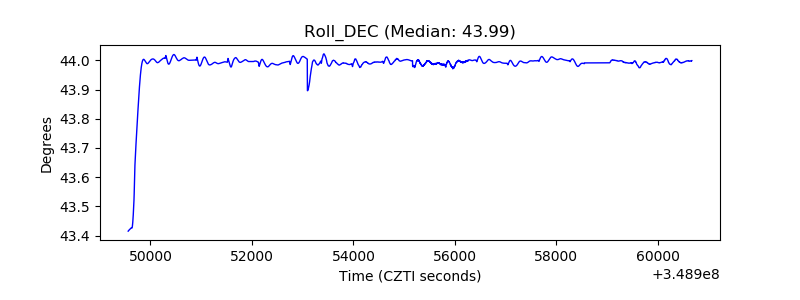 |
| _Roll_RA | 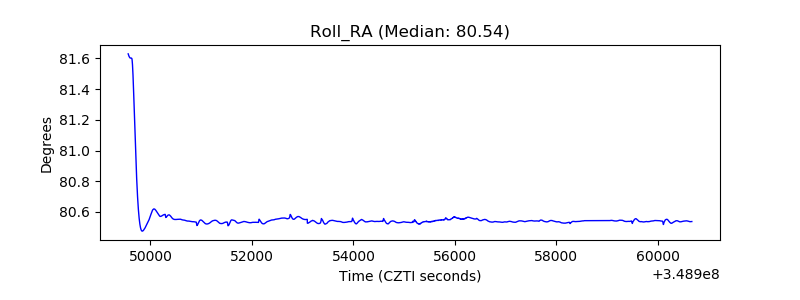 |
| Veto Counter |  |