| Param | Original file | Final file |
|---|---|---|
| Filename | modeM0/AS1A10_093T01_9000004128_28756cztM0_level2.evt | modeM0/AS1A10_093T01_9000004128_28756cztM0_level2_quad_clean.evt |
| Size (bytes) | 671,650,560 | 96,667,200 |
| Size | 640.5 MB | 92.2 MB |
| Events in quadrant A | 3,393,603 | 645,426 |
| Events in quadrant B | 3,530,924 | 654,702 |
| Events in quadrant C | 6,547,648 | 596,271 |
| Events in quadrant D | 6,407,807 | 555,199 |
| Mode M9 | |||
|---|---|---|---|
| Quadrant | BADHDUFLAG | Total packets | Discarded packets |
| A | 0 | 14 | 0 |
| B | 0 | 15 | 0 |
| C | 0 | 15 | 0 |
| D | 0 | 15 | 0 |
| Mode M0 | |||
|---|---|---|---|
| Quadrant | BADHDUFLAG | Total packets | Discarded packets |
| A | 0 | 14556 | 2 |
| B | 0 | 14958 | 2 |
| C | 0 | 24333 | 3 |
| D | 0 | 23772 | 2 |
| Mode SS | |||
|---|---|---|---|
| Quadrant | BADHDUFLAG | Total packets | Discarded packets |
| A | 0 | 138 | 0 |
| B | 0 | 138 | 0 |
| C | 0 | 138 | 0 |
| D | 0 | 138 | 0 |
| Quadrant | Total seconds | Saturated seconds | Saturation percentage |
|---|---|---|---|
| A | 6824 | 34 | 0.498242% |
| B | 6824 | 93 | 1.362837% |
| C | 6823 | 564 | 8.266159% |
| D | 6823 | 794 | 11.637110% |
Noise dominated data is calculated using 1-second bins in cleaned event files. If a bin has >2000 counts, and if more than 50% of those come from <1% of pixels, then it is considered to be noise-dominated and hence unusable.
| Quadrant | # 1 sec bins | Bins with >0 counts | Bins with >2000 counts | High rate bins dominated by noise | Noise dominated (total time) | Noise dominated (detector-on time) | Marked lightcurve |
|---|---|---|---|---|---|---|---|
| A | 7709 | 6824 | 9 | 9 | 0.12% | 0.13% | 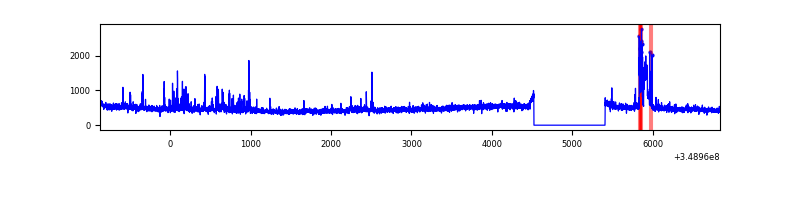 |
| B | 7709 | 6824 | 39 | 39 | 0.51% | 0.57% | 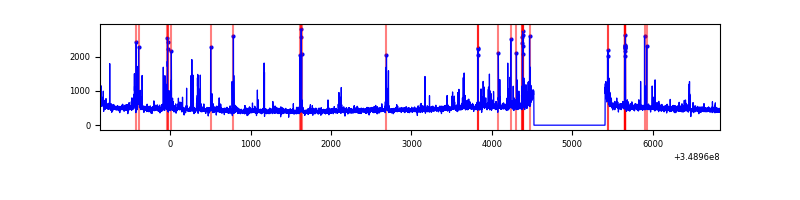 |
| C | 7708 | 6823 | 175 | 175 | 2.27% | 2.56% | 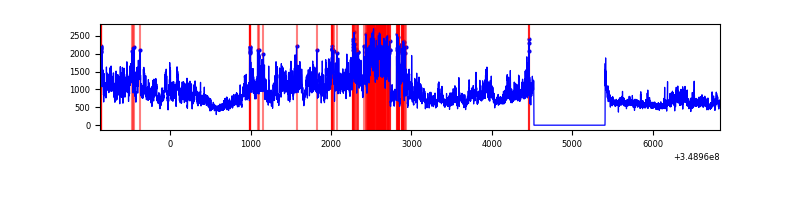 |
| D | 7708 | 6824 | 665 | 665 | 8.63% | 9.75% | 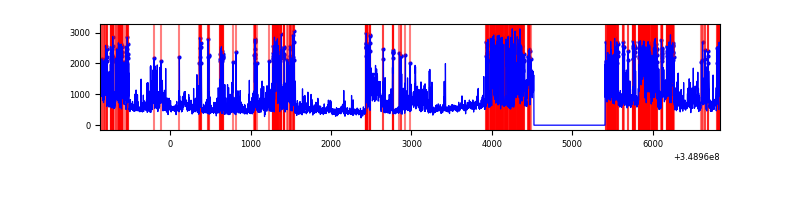 |
Top three noisy pixels from each quadrant. If the there are fewer than three noisy pixels in the level2.evt file, extra rows are filled as -1
| Pixel properties | Quadrant properties | ||||||
|---|---|---|---|---|---|---|---|
| Quadrant | DetID | PixID | Counts | Sigma | Mean | Median | Sigma |
| A | 15 | 174 | 137638 | 834.95 | 811 | 794 | 163.9 |
| A | 14 | 239 | 111192 | 673.59 | 811 | 794 | 163.9 |
| A | 13 | 254 | 13444 | 77.18 | 811 | 794 | 163.9 |
| B | 5 | 255 | 266107 | 1714.76 | 807 | 786 | 154.7 |
| B | 4 | 80 | 43449 | 275.73 | 807 | 786 | 154.7 |
| B | 10 | 245 | 26735 | 167.71 | 807 | 786 | 154.7 |
| C | 3 | 233 | 3328564 | 18584.38 | 767 | 773 | 179.1 |
| C | 14 | 238 | 148812 | 826.74 | 767 | 773 | 179.1 |
| C | 14 | 254 | 37234 | 203.62 | 767 | 773 | 179.1 |
| D | 1 | 52 | 2609186 | 14515.39 | 749 | 728 | 179.7 |
| D | 8 | 195 | 600014 | 3334.87 | 749 | 728 | 179.7 |
| D | 13 | 104 | 217992 | 1209.02 | 749 | 728 | 179.7 |
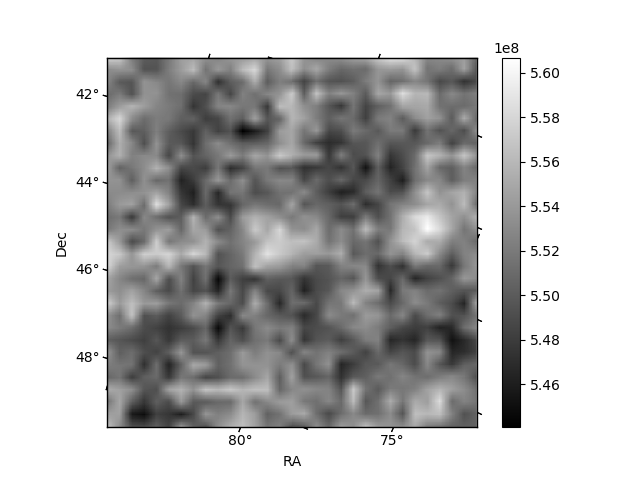
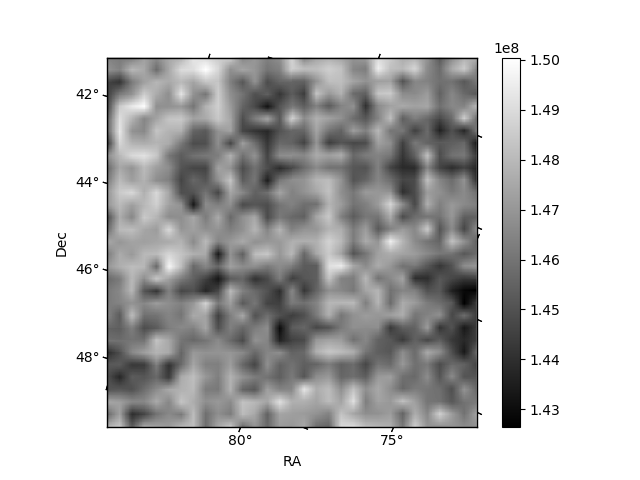
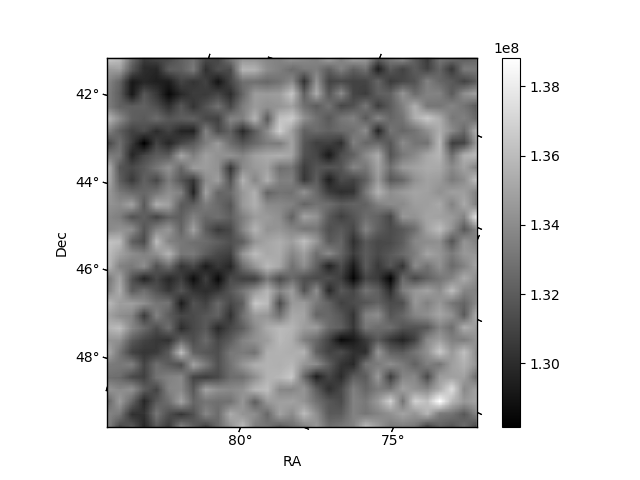
Histogram calculated using DETX and DETY for each event in the final _common_clean file
| Quadrant A | 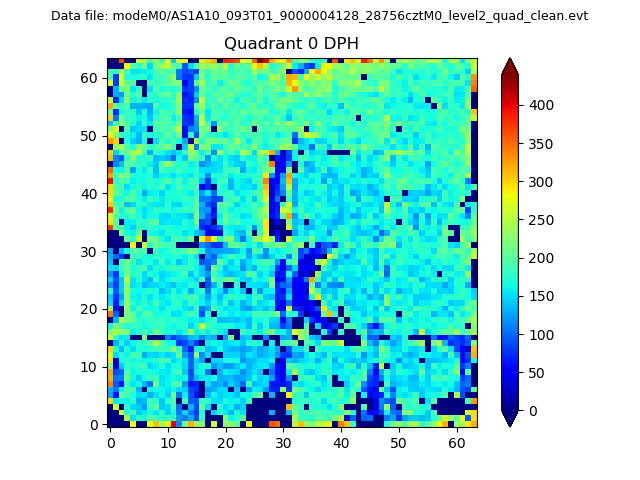 |
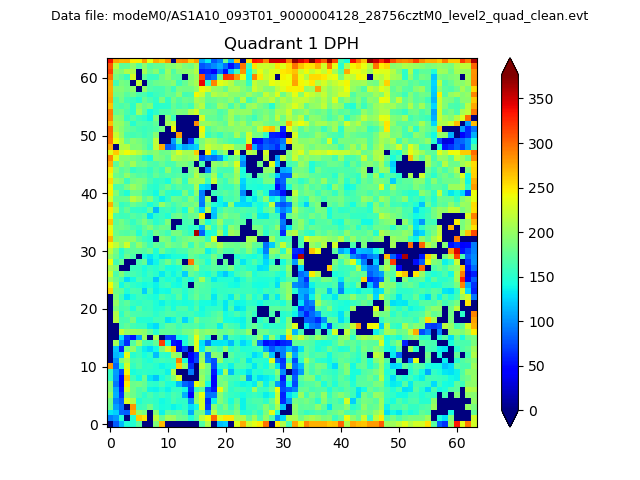 |
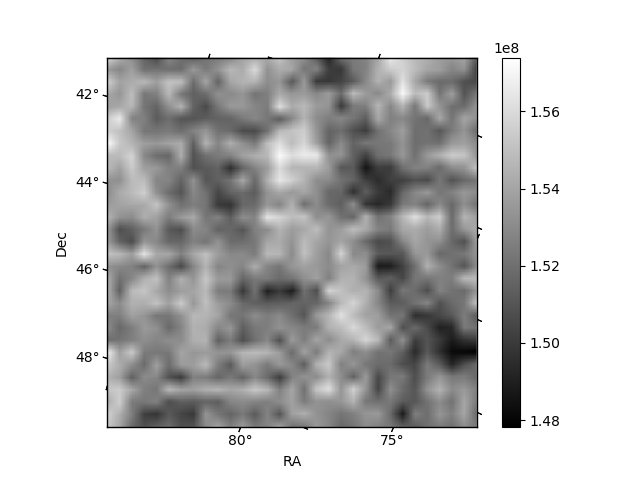
Quadrant B |
|---|---|---|---|
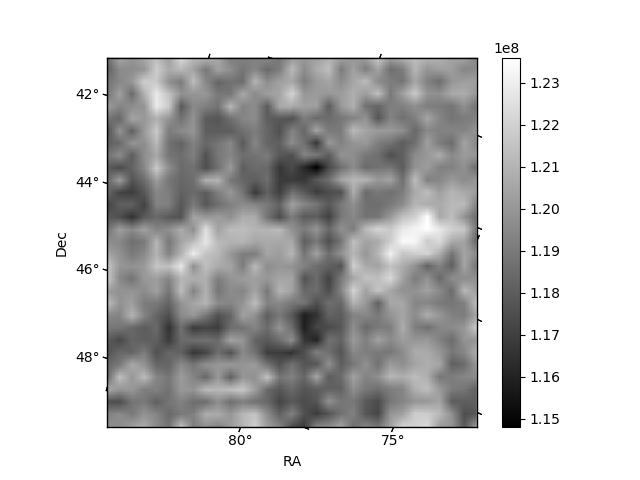
| Quadrant D | 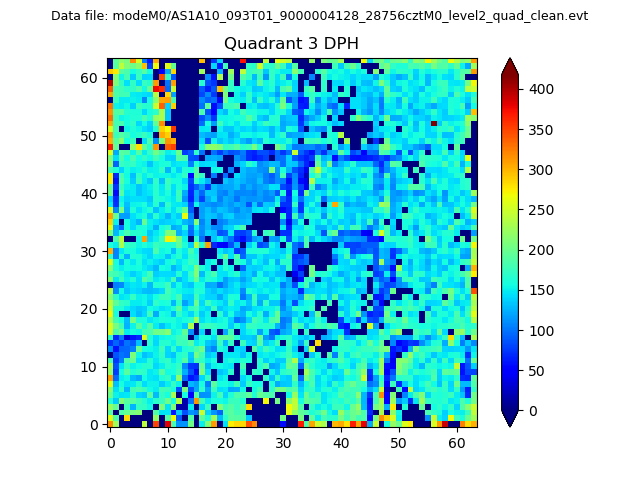 |
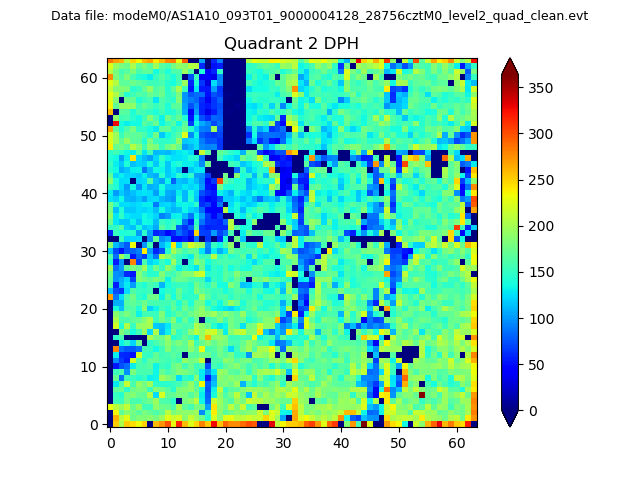 |
Quadrant C |
| Plot type | Count rate plots | Images |
|---|---|---|
| Comparison with Poisson distribution Blue bars denote a histogram of data divided into 1 sec bins. Red curve is a Poisson curve with rate = median count rate of data. |
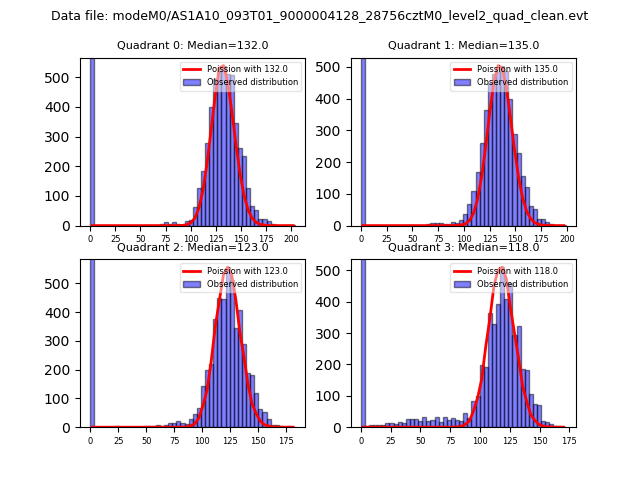 |
 |
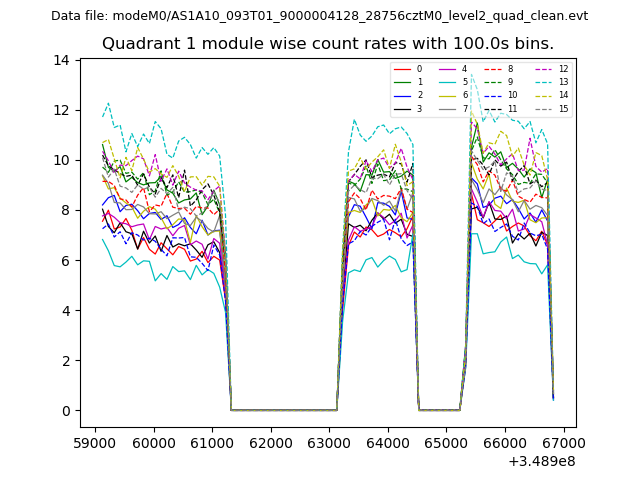
| Quadrant-wise count rates Data is divided into 100 sec bins |
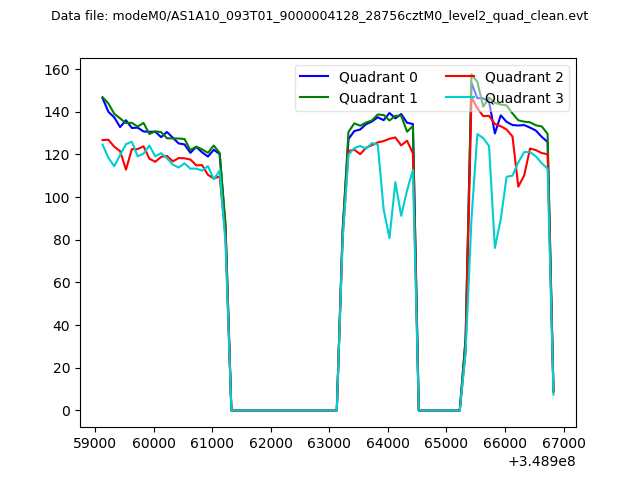 |
|
| Module-wise count rates for Quadrant A Data is divided into 100 sec bins |
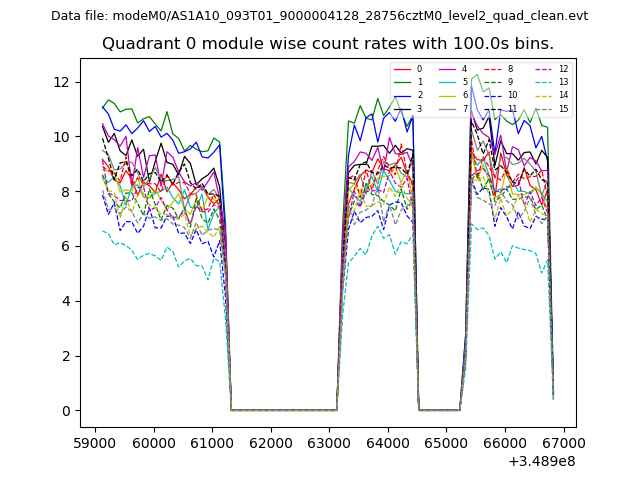 |
 |
| Module-wise count rates for Quadrant B Data is divided into 100 sec bins |
 |
 |
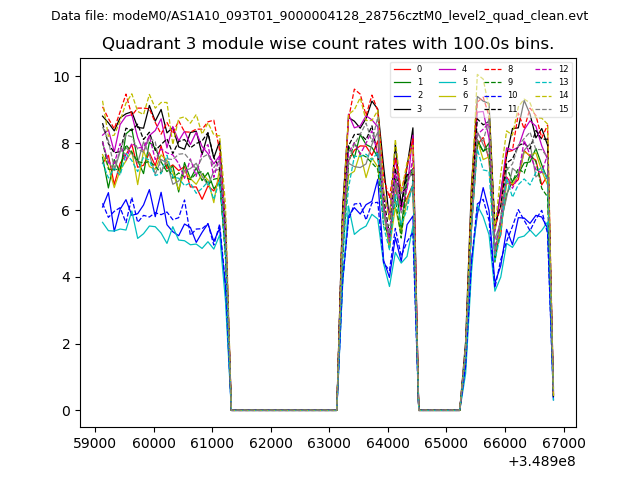
| Module-wise count rates for Quadrant C Data is divided into 100 sec bins |
 |
 |
| Module-wise count rates for Quadrant D Data is divided into 100 sec bins |
 |
 |
| Parameter | Plot |
|---|---|
| CZT HV Monitor | 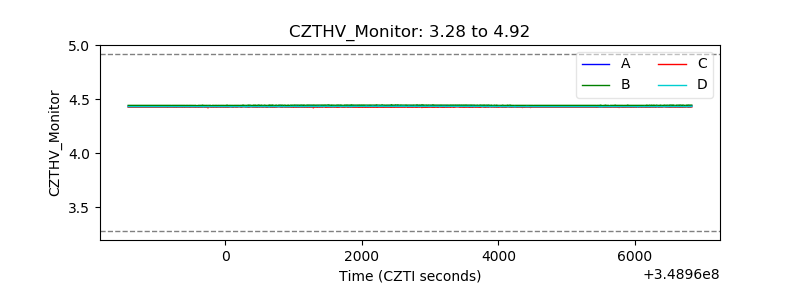 |
| D_VDD | 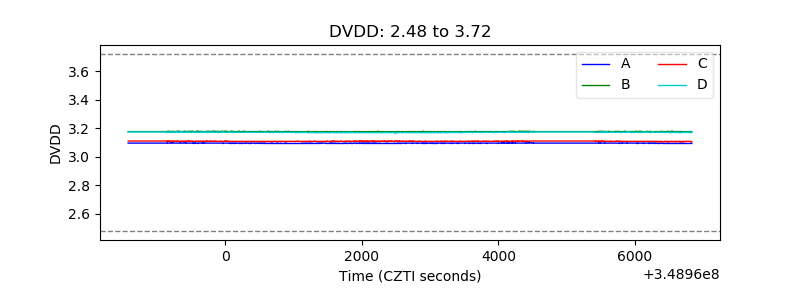 |
| Temperature 1 | 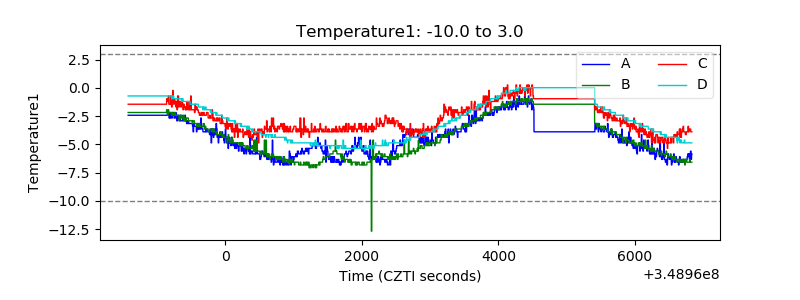 |
| Veto HV Monitor |  |
| Veto LLD | 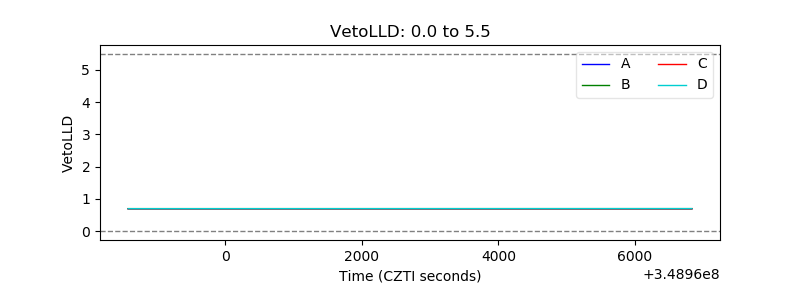 |
| Alpha Counter | 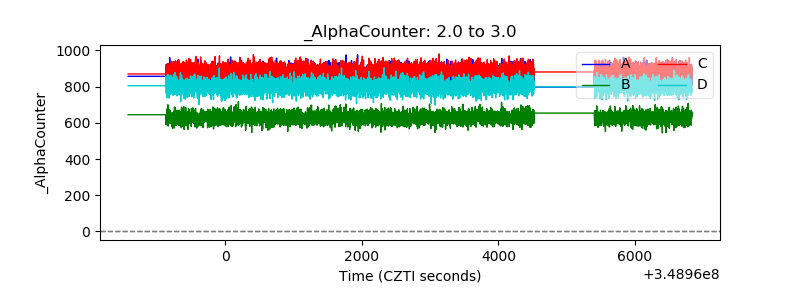 |
| _CPM_Rate | 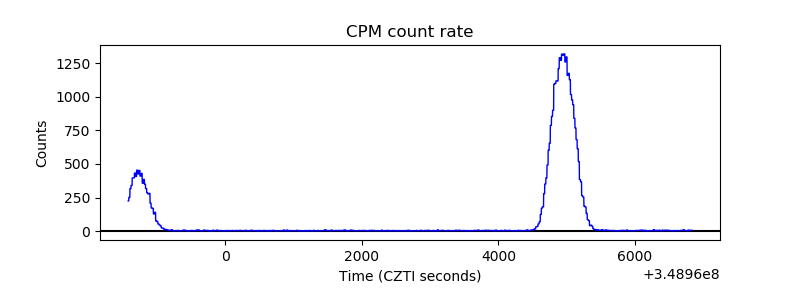 |
| CZT Counter | 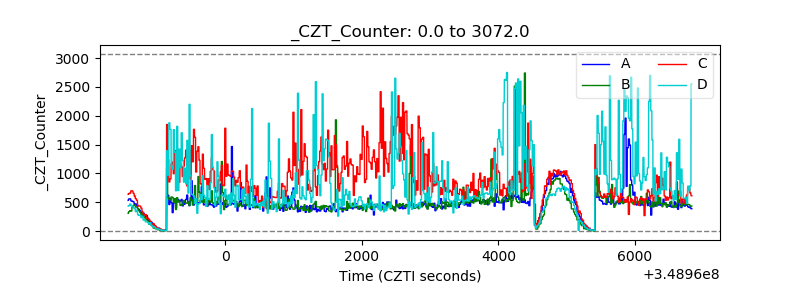 |
| +2.5 Volts monitor |  |
| +5 Volts monitor |  |
| _ROLL_ROT | 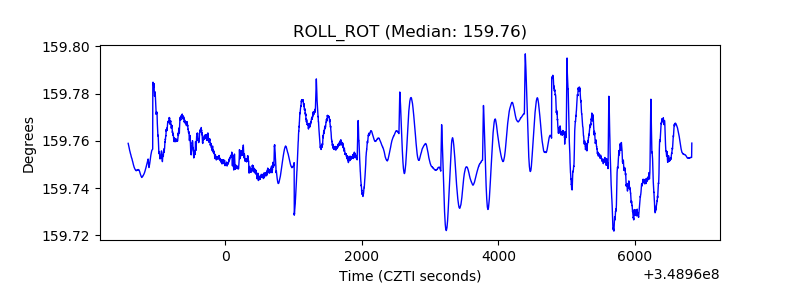 |
| _Roll_DEC | 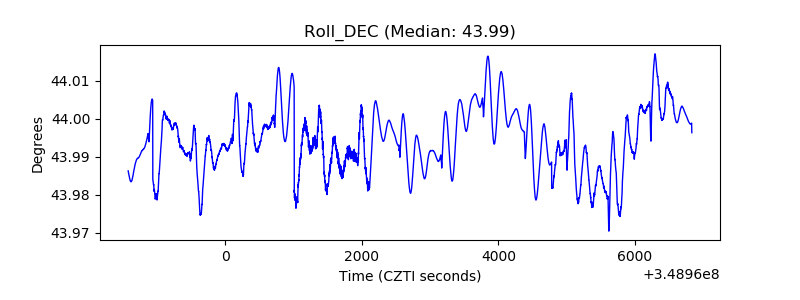 |
| _Roll_RA | 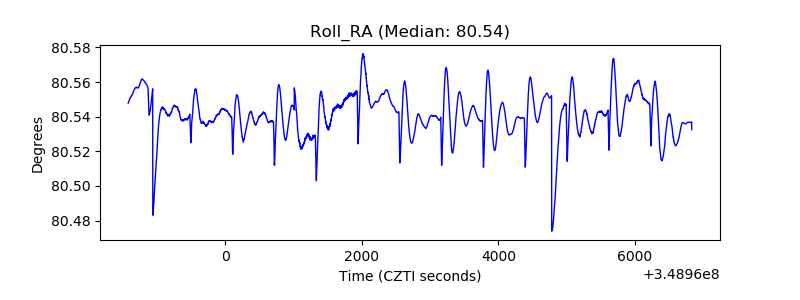 |
| Veto Counter | 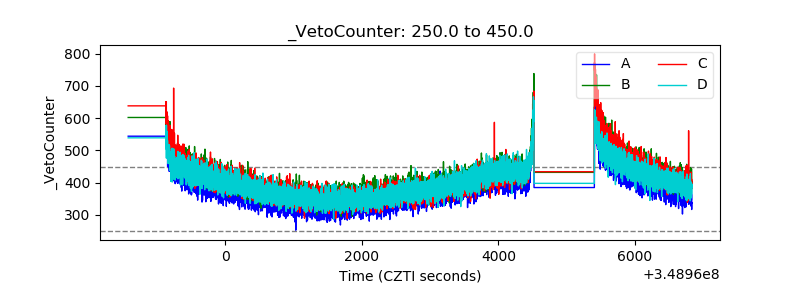 |