| Param | Original file | Final file |
|---|---|---|
| Filename | modeM0/AS1A10_093T01_9000004128_28757cztM0_level2.evt | modeM0/AS1A10_093T01_9000004128_28757cztM0_level2_quad_clean.evt |
| Size (bytes) | 576,757,440 | 95,045,760 |
| Size | 550.0 MB | 90.6 MB |
| Events in quadrant A | 3,195,174 | 633,615 |
| Events in quadrant B | 3,472,909 | 647,791 |
| Events in quadrant C | 4,197,335 | 589,599 |
| Events in quadrant D | 6,159,299 | 551,568 |
| Mode M9 | |||
|---|---|---|---|
| Quadrant | BADHDUFLAG | Total packets | Discarded packets |
| A | 0 | 12 | 0 |
| B | 0 | 13 | 0 |
| C | 0 | 13 | 0 |
| D | 0 | 13 | 0 |
| Mode M0 | |||
|---|---|---|---|
| Quadrant | BADHDUFLAG | Total packets | Discarded packets |
| A | 0 | 13775 | 2 |
| B | 0 | 14613 | 2 |
| C | 0 | 16911 | 2 |
| D | 0 | 22968 | 2 |
| Mode SS | |||
|---|---|---|---|
| Quadrant | BADHDUFLAG | Total packets | Discarded packets |
| A | 0 | 132 | 0 |
| B | 0 | 132 | 0 |
| C | 0 | 132 | 0 |
| D | 0 | 132 | 0 |
| Quadrant | Total seconds | Saturated seconds | Saturation percentage |
|---|---|---|---|
| A | 6534 | 33 | 0.505051% |
| B | 6534 | 86 | 1.316192% |
| C | 6534 | 318 | 4.866850% |
| D | 6534 | 499 | 7.636976% |
Noise dominated data is calculated using 1-second bins in cleaned event files. If a bin has >2000 counts, and if more than 50% of those come from <1% of pixels, then it is considered to be noise-dominated and hence unusable.
| Quadrant | # 1 sec bins | Bins with >0 counts | Bins with >2000 counts | High rate bins dominated by noise | Noise dominated (total time) | Noise dominated (detector-on time) | Marked lightcurve |
|---|---|---|---|---|---|---|---|
| A | 7594 | 6535 | 10 | 10 | 0.13% | 0.15% | 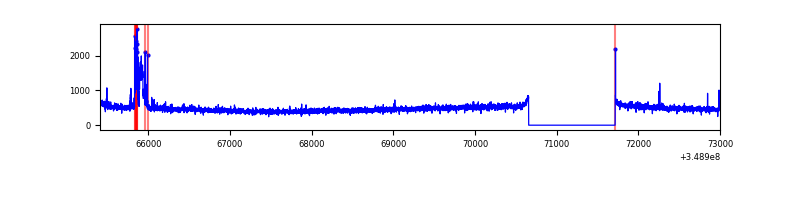 |
| B | 7594 | 6535 | 30 | 30 | 0.40% | 0.46% | 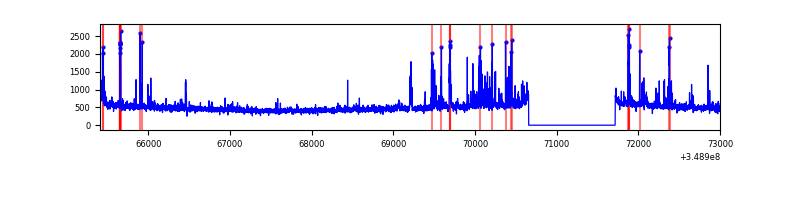 |
| C | 7594 | 6534 | 16 | 16 | 0.21% | 0.24% | 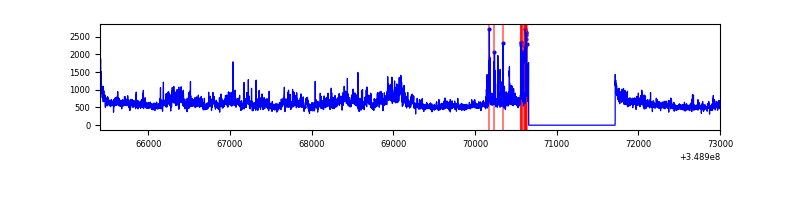 |
| D | 7594 | 6535 | 413 | 413 | 5.44% | 6.32% | 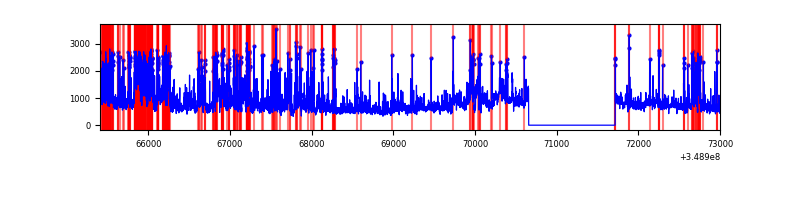 |
Top three noisy pixels from each quadrant. If the there are fewer than three noisy pixels in the level2.evt file, extra rows are filled as -1
| Pixel properties | Quadrant properties | ||||||
|---|---|---|---|---|---|---|---|
| Quadrant | DetID | PixID | Counts | Sigma | Mean | Median | Sigma |
| A | 15 | 174 | 127066 | 794.72 | 788 | 771 | 158.9 |
| A | 14 | 239 | 17565 | 105.68 | 788 | 771 | 158.9 |
| A | 13 | 254 | 12790 | 75.63 | 788 | 771 | 158.9 |
| B | 4 | 80 | 170768 | 1132.62 | 790 | 770 | 150.1 |
| B | 5 | 255 | 145428 | 963.79 | 790 | 770 | 150.1 |
| B | 10 | 245 | 32074 | 208.56 | 790 | 770 | 150.1 |
| C | 3 | 233 | 879129 | 4971.57 | 751 | 755 | 176.7 |
| C | 14 | 238 | 175642 | 989.85 | 751 | 755 | 176.7 |
| C | 0 | 207 | 118013 | 663.67 | 751 | 755 | 176.7 |
| D | 1 | 52 | 1839913 | 10333.38 | 737 | 714 | 178.0 |
| D | 8 | 195 | 1269987 | 7131.3 | 737 | 714 | 178.0 |
| D | 12 | 233 | 155034 | 867.03 | 737 | 714 | 178.0 |
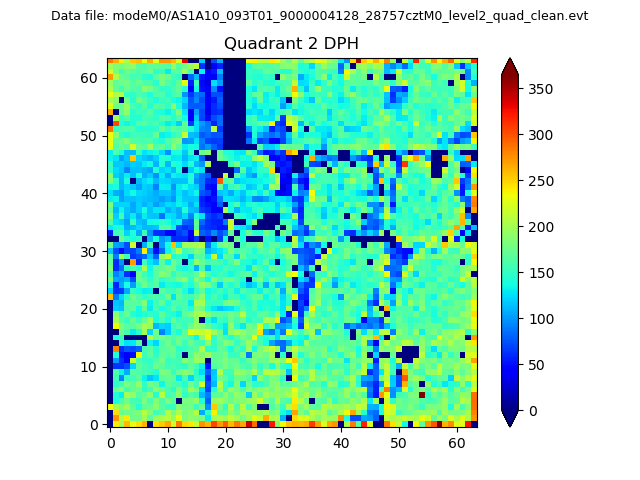
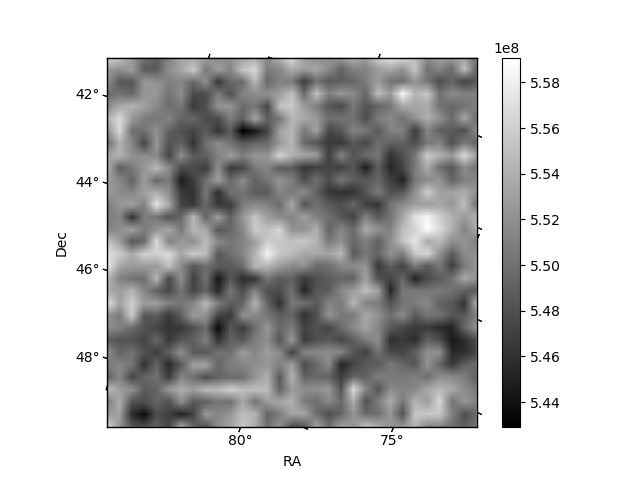
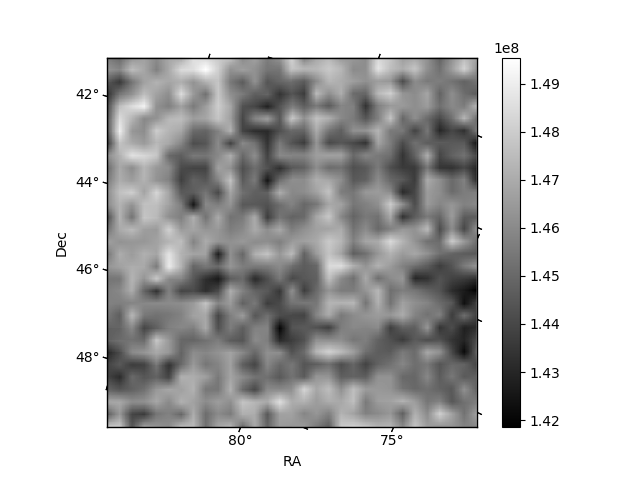
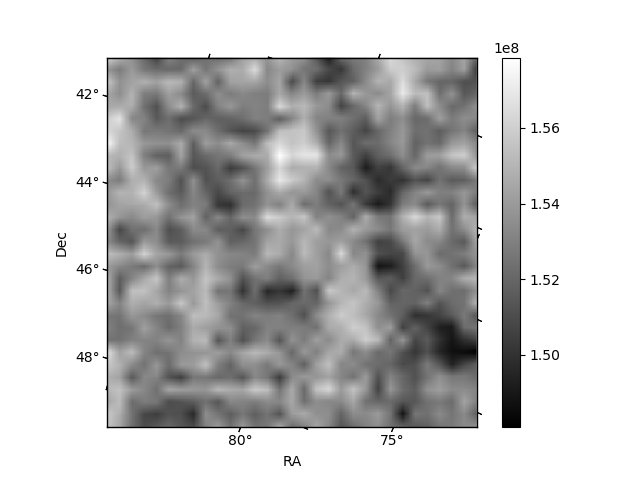
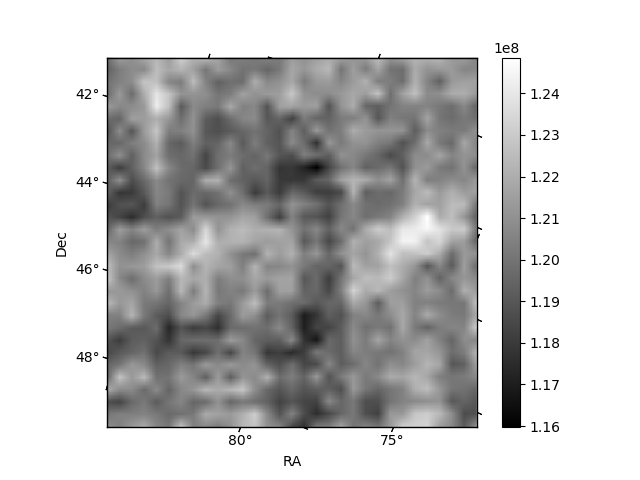
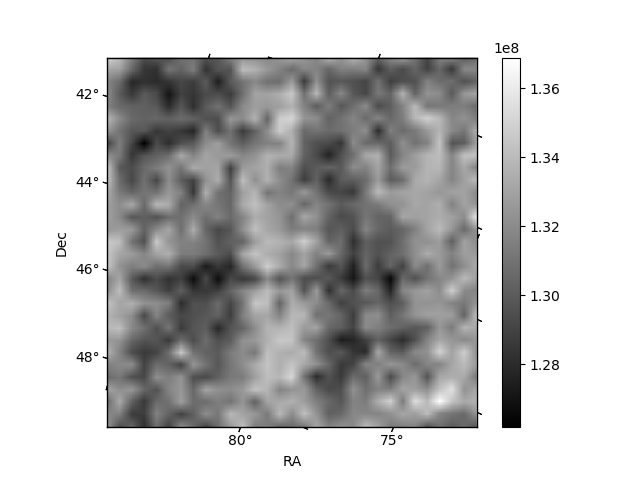
Histogram calculated using DETX and DETY for each event in the final _common_clean file
| Quadrant A | 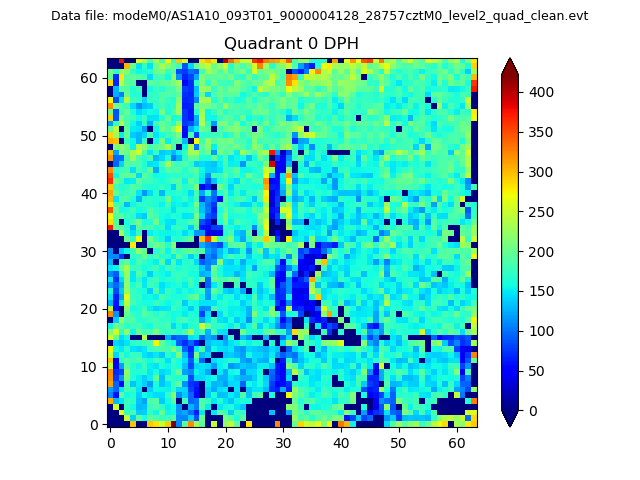 |
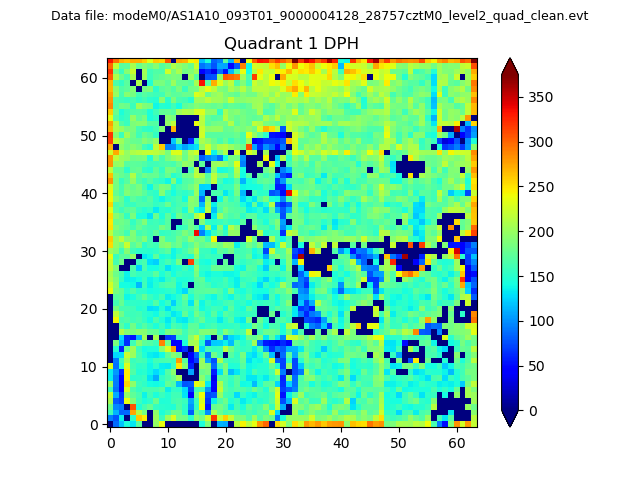 |
Quadrant B |
|---|---|---|---|
| Quadrant D | 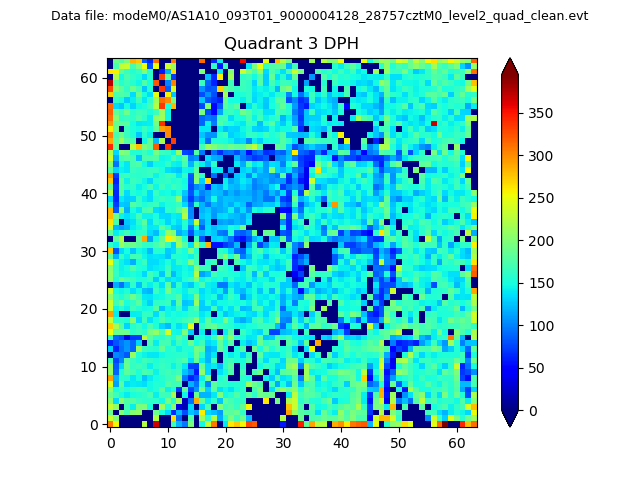 |
 |
Quadrant C |
| Plot type | Count rate plots | Images |
|---|---|---|
| Comparison with Poisson distribution Blue bars denote a histogram of data divided into 1 sec bins. Red curve is a Poisson curve with rate = median count rate of data. |
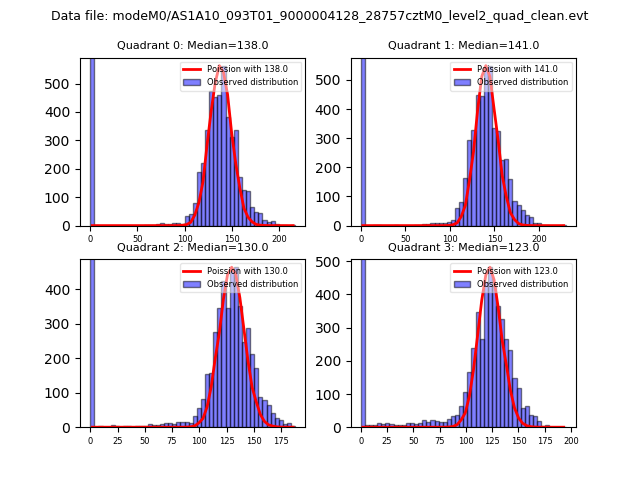 |
 |
| Quadrant-wise count rates Data is divided into 100 sec bins |
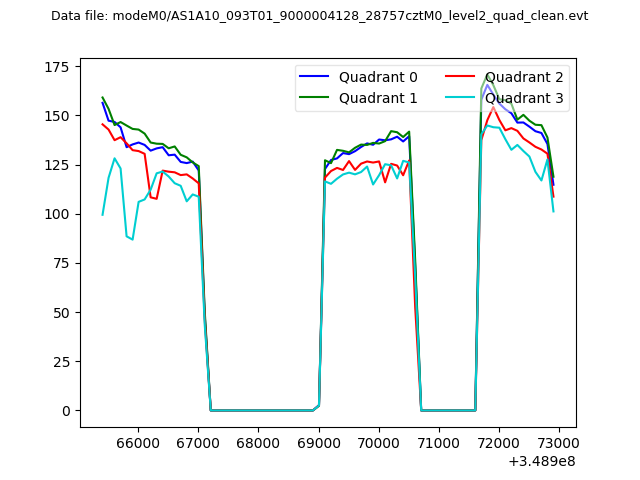 |
|
| Module-wise count rates for Quadrant A Data is divided into 100 sec bins |
 |
 |
| Module-wise count rates for Quadrant B Data is divided into 100 sec bins |
 |
 |
| Module-wise count rates for Quadrant C Data is divided into 100 sec bins |
 |
 |
| Module-wise count rates for Quadrant D Data is divided into 100 sec bins |
 |
 |
| Parameter | Plot |
|---|---|
| CZT HV Monitor |  |
| D_VDD | 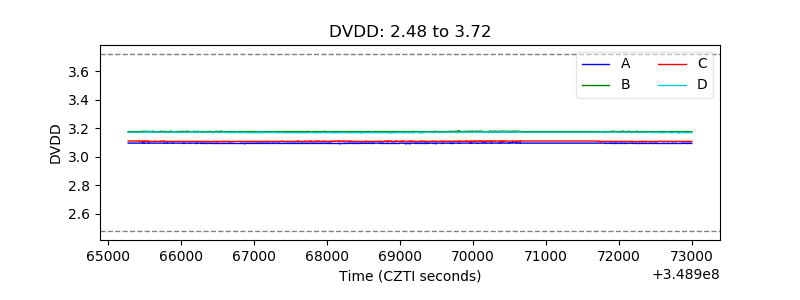 |
| Temperature 1 | 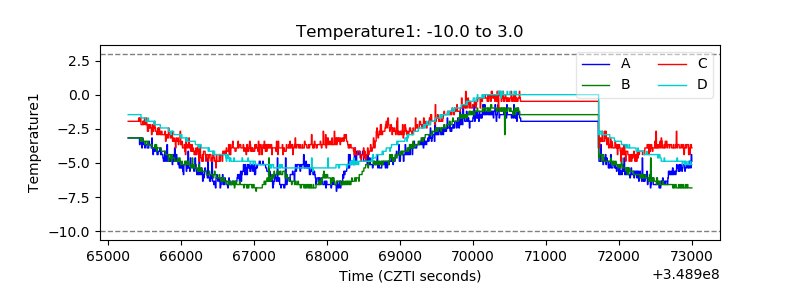 |
| Veto HV Monitor | 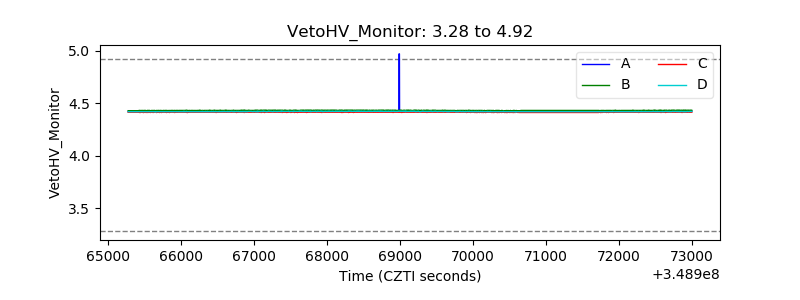 |
| Veto LLD | 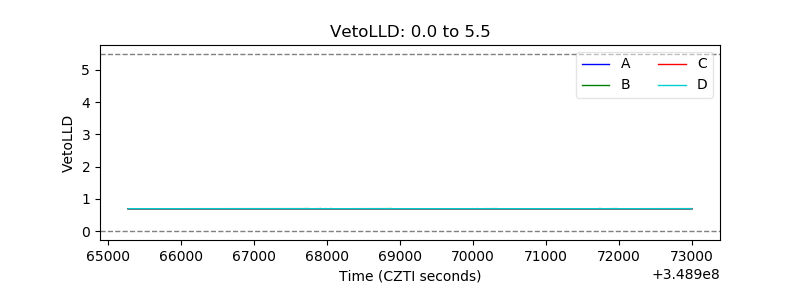 |
| Alpha Counter | 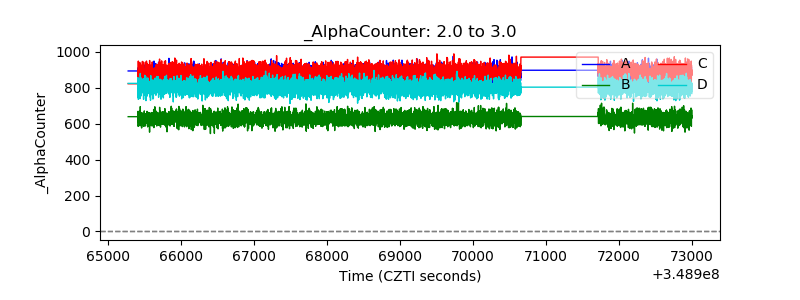 |
| _CPM_Rate | 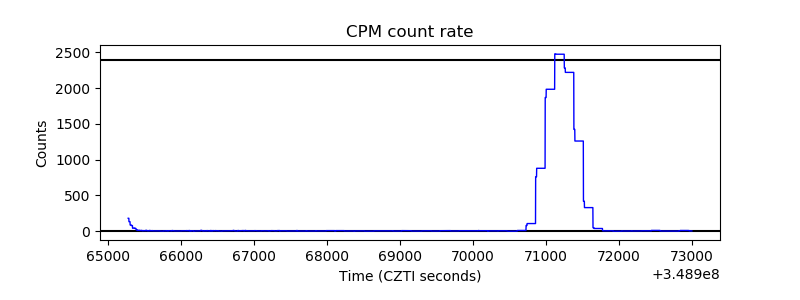 |
| CZT Counter | 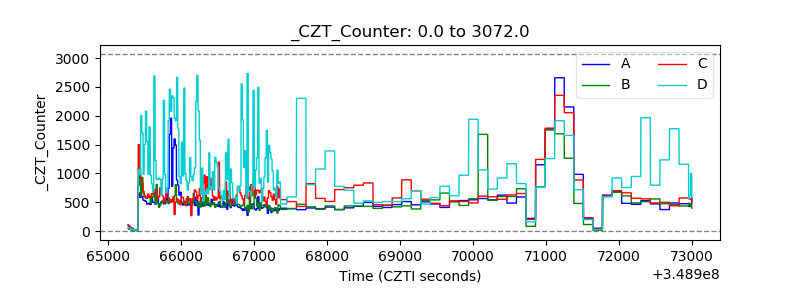 |
| +2.5 Volts monitor |  |
| +5 Volts monitor |  |
| _ROLL_ROT | 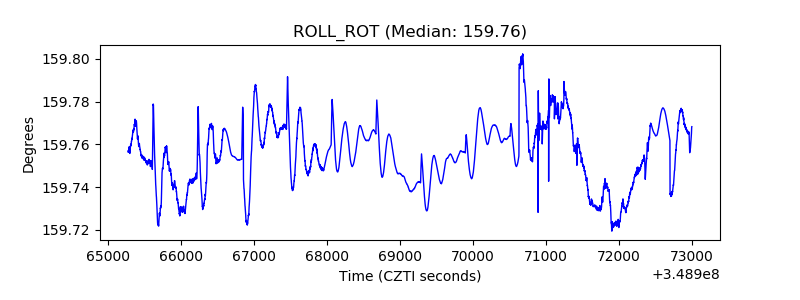 |
| _Roll_DEC | 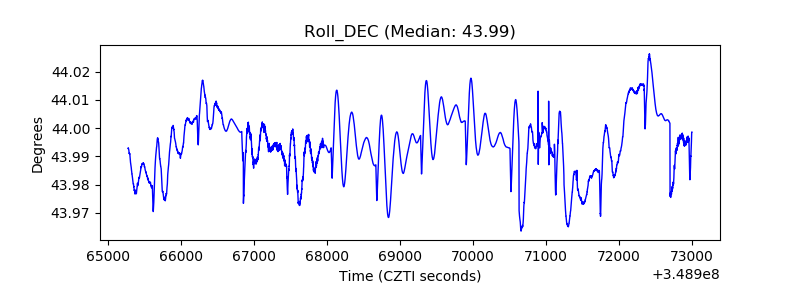 |
| _Roll_RA |  |
| Veto Counter |  |