| Param | Original file | Final file |
|---|---|---|
| Filename | modeM0/AS1A10_093T01_9000004128_28760cztM0_level2.evt | modeM0/AS1A10_093T01_9000004128_28760cztM0_level2_quad_clean.evt |
| Size (bytes) | 539,763,840 | 81,783,360 |
| Size | 514.8 MB | 78.0 MB |
| Events in quadrant A | 3,298,336 | 529,007 |
| Events in quadrant B | 3,685,664 | 541,974 |
| Events in quadrant C | 4,113,464 | 494,682 |
| Events in quadrant D | 4,816,526 | 464,982 |
| Mode M9 | |||
|---|---|---|---|
| Quadrant | BADHDUFLAG | Total packets | Discarded packets |
| A | 0 | 19 | 0 |
| B | 0 | 20 | 0 |
| C | 0 | 20 | 0 |
| D | 0 | 20 | 0 |
| Mode M0 | |||
|---|---|---|---|
| Quadrant | BADHDUFLAG | Total packets | Discarded packets |
| A | 0 | 13728 | 2 |
| B | 0 | 14961 | 2 |
| C | 0 | 16840 | 2 |
| D | 0 | 18569 | 3 |
| Mode SS | |||
|---|---|---|---|
| Quadrant | BADHDUFLAG | Total packets | Discarded packets |
| A | 0 | 128 | 0 |
| B | 0 | 128 | 0 |
| C | 0 | 128 | 0 |
| D | 0 | 128 | 0 |
| Quadrant | Total seconds | Saturated seconds | Saturation percentage |
|---|---|---|---|
| A | 6395 | 10 | 0.156372% |
| B | 6395 | 90 | 1.407349% |
| C | 6395 | 89 | 1.391712% |
| D | 6394 | 307 | 4.801376% |
Noise dominated data is calculated using 1-second bins in cleaned event files. If a bin has >2000 counts, and if more than 50% of those come from <1% of pixels, then it is considered to be noise-dominated and hence unusable.
| Quadrant | # 1 sec bins | Bins with >0 counts | Bins with >2000 counts | High rate bins dominated by noise | Noise dominated (total time) | Noise dominated (detector-on time) | Marked lightcurve |
|---|---|---|---|---|---|---|---|
| A | 7740 | 6396 | 1 | 1 | 0.01% | 0.02% | 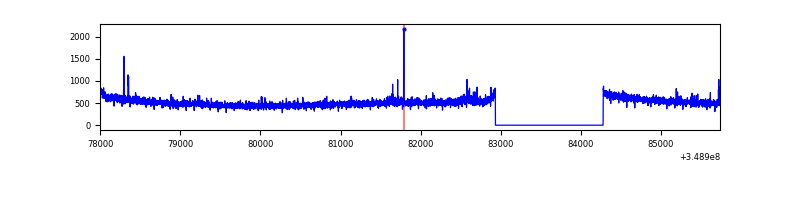 |
| B | 7740 | 6396 | 59 | 59 | 0.76% | 0.92% | 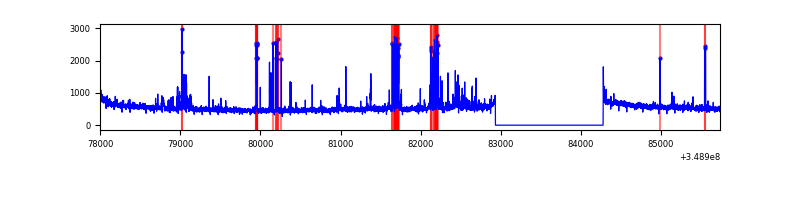 |
| C | 7740 | 6396 | 0 | 0 | 0.00% | 0.00% | 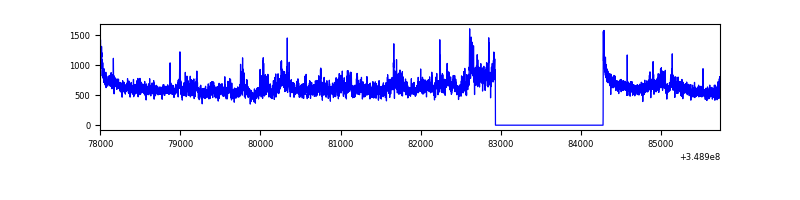 |
| D | 7739 | 6395 | 300 | 300 | 3.88% | 4.69% | 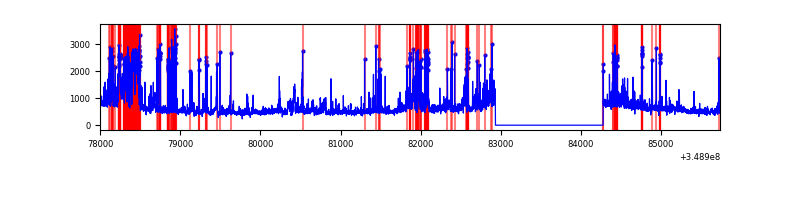 |
Top three noisy pixels from each quadrant. If the there are fewer than three noisy pixels in the level2.evt file, extra rows are filled as -1
| Pixel properties | Quadrant properties | ||||||
|---|---|---|---|---|---|---|---|
| Quadrant | DetID | PixID | Counts | Sigma | Mean | Median | Sigma |
| A | 14 | 239 | 31565 | 183.3 | 843 | 830 | 167.7 |
| A | 13 | 254 | 11696 | 64.8 | 843 | 830 | 167.7 |
| A | 15 | 174 | 10807 | 59.5 | 843 | 830 | 167.7 |
| B | 5 | 255 | 288803 | 1830.47 | 842 | 823 | 157.3 |
| B | 4 | 80 | 61117 | 383.24 | 842 | 823 | 157.3 |
| B | 12 | 111 | 18637 | 113.23 | 842 | 823 | 157.3 |
| C | 3 | 233 | 824316 | 4500.53 | 801 | 811 | 183.0 |
| C | 14 | 238 | 135716 | 737.27 | 801 | 811 | 183.0 |
| C | 4 | 254 | 9979 | 50.1 | 801 | 811 | 183.0 |
| D | 1 | 52 | 1131638 | 6033.82 | 787 | 767 | 187.4 |
| D | 8 | 195 | 564750 | 3009.16 | 787 | 767 | 187.4 |
| D | 12 | 233 | 66640 | 351.47 | 787 | 767 | 187.4 |
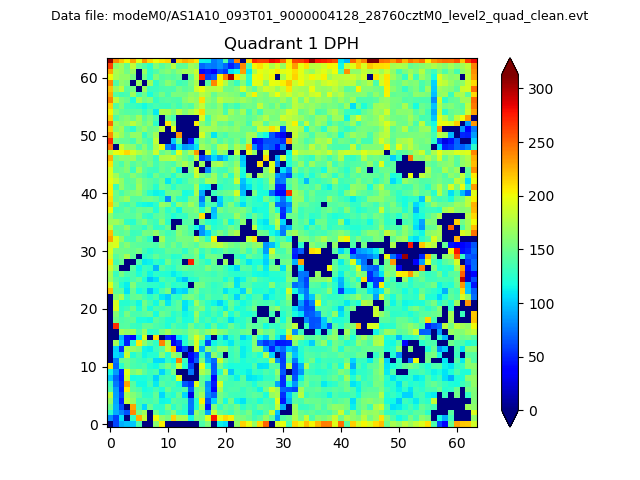
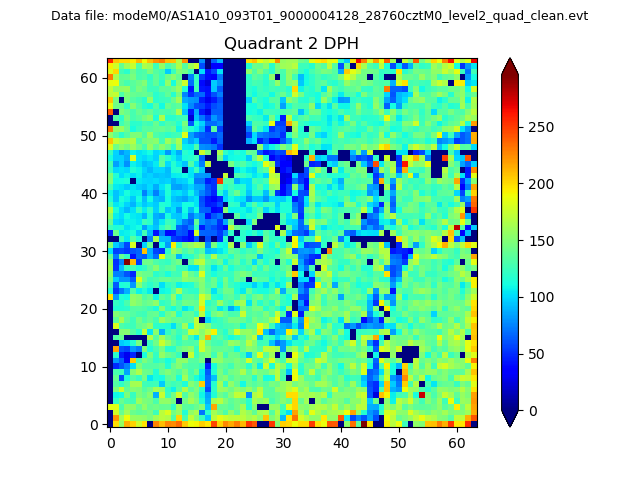
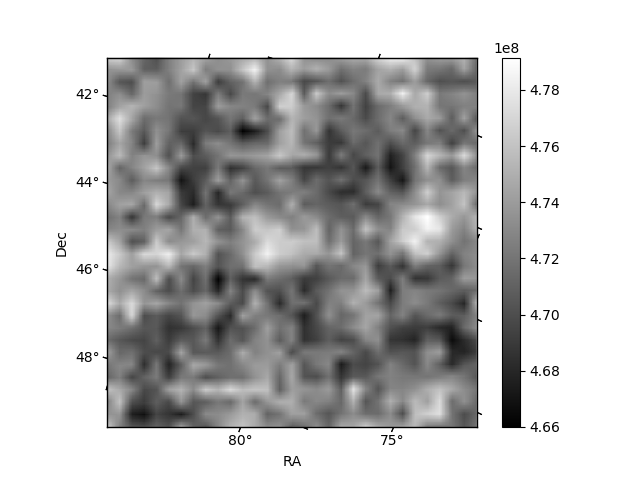
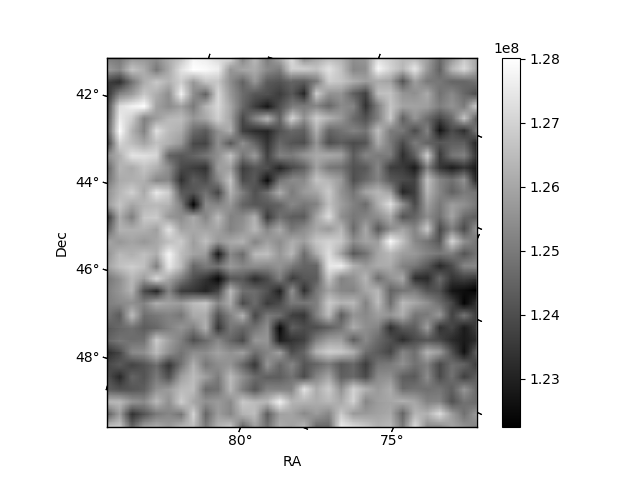
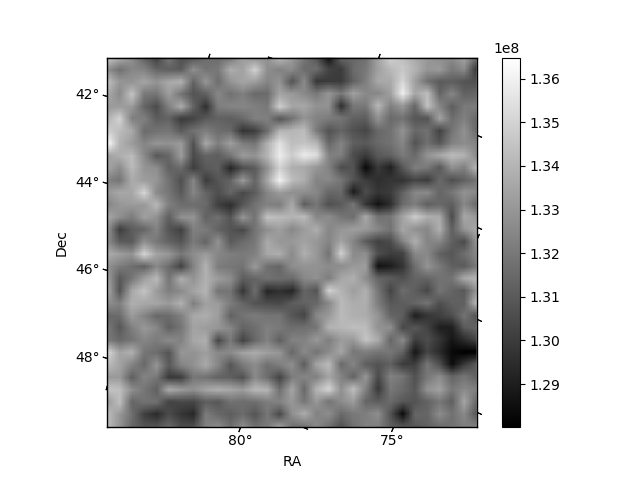
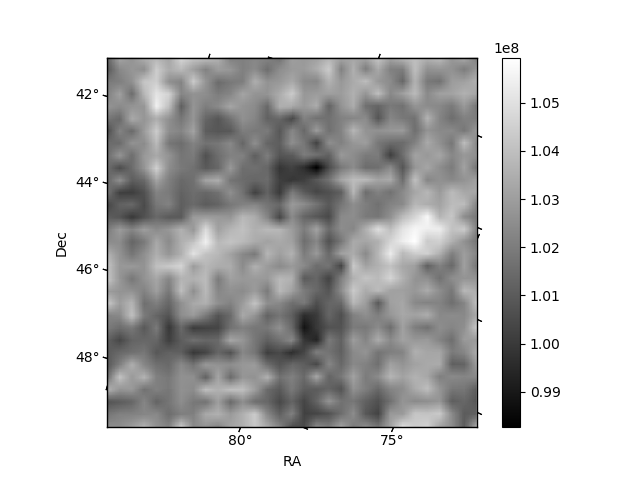
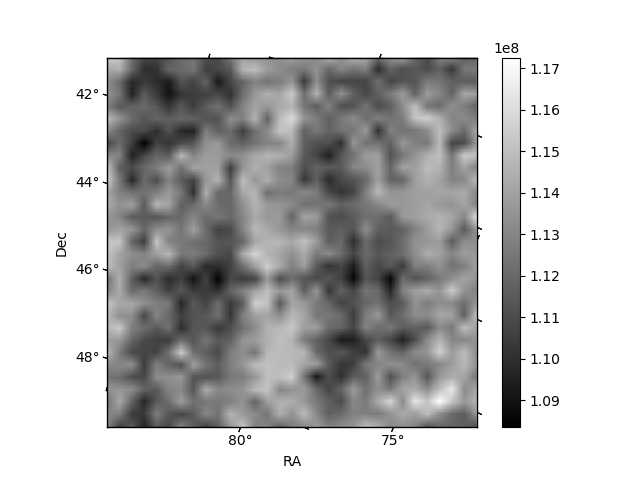
Histogram calculated using DETX and DETY for each event in the final _common_clean file
| Quadrant A |  |
 |
Quadrant B |
|---|---|---|---|
| Quadrant D | 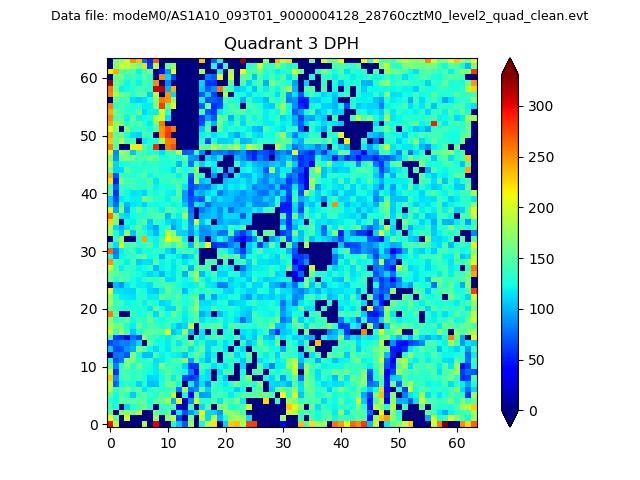 |
 |
Quadrant C |
| Plot type | Count rate plots | Images |
|---|---|---|
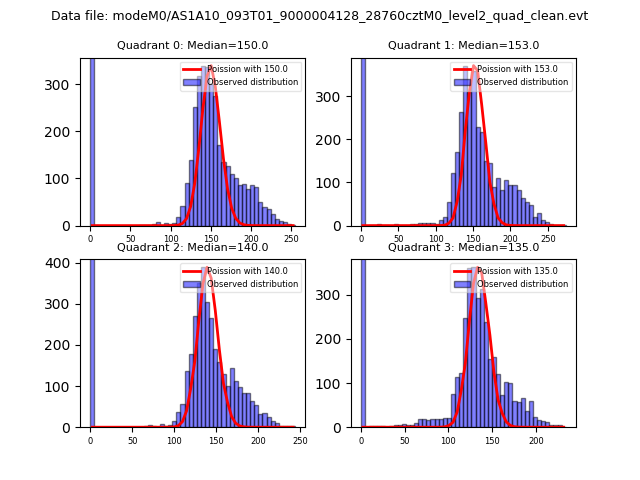
| Comparison with Poisson distribution Blue bars denote a histogram of data divided into 1 sec bins. Red curve is a Poisson curve with rate = median count rate of data. |
 |
 |
| Quadrant-wise count rates Data is divided into 100 sec bins |
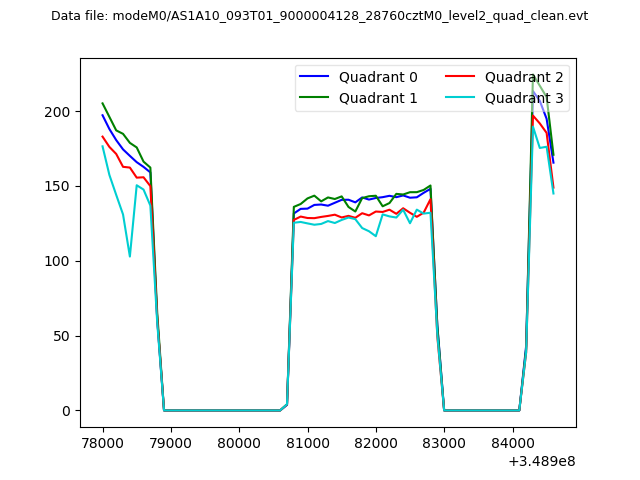 |
|
| Module-wise count rates for Quadrant A Data is divided into 100 sec bins |
 |
 |
| Module-wise count rates for Quadrant B Data is divided into 100 sec bins |
 |
 |
| Module-wise count rates for Quadrant C Data is divided into 100 sec bins |
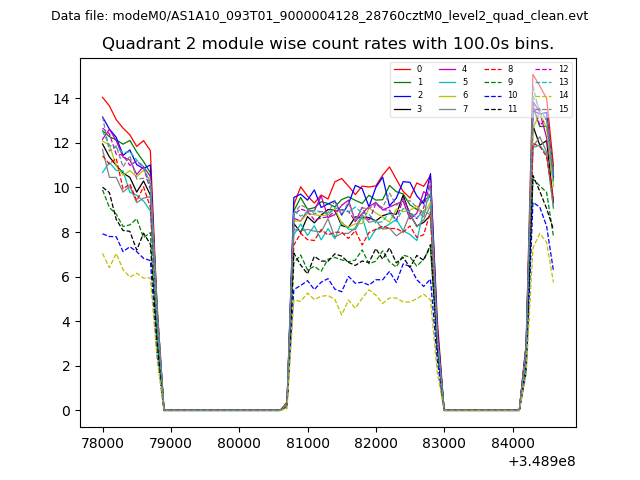 |
 |
| Module-wise count rates for Quadrant D Data is divided into 100 sec bins |
 |
 |
| Parameter | Plot |
|---|---|
| CZT HV Monitor | 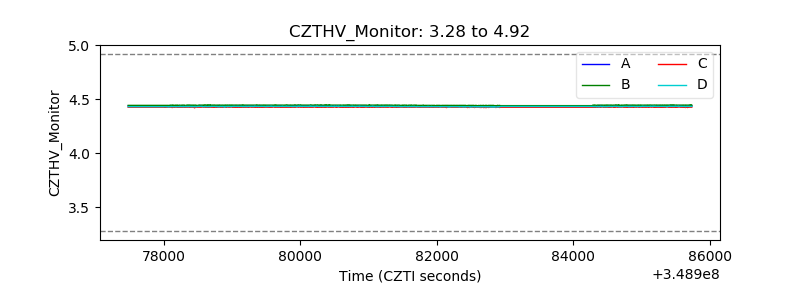 |
| D_VDD | 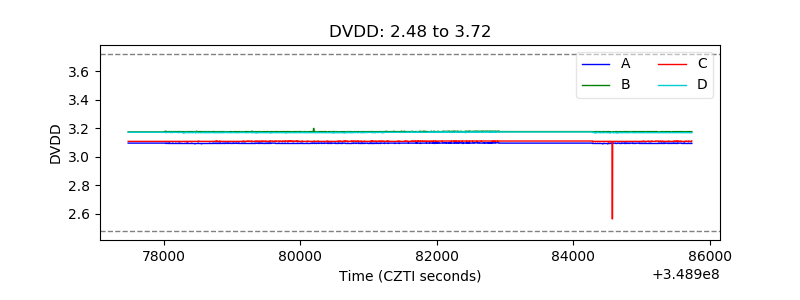 |
| Temperature 1 | 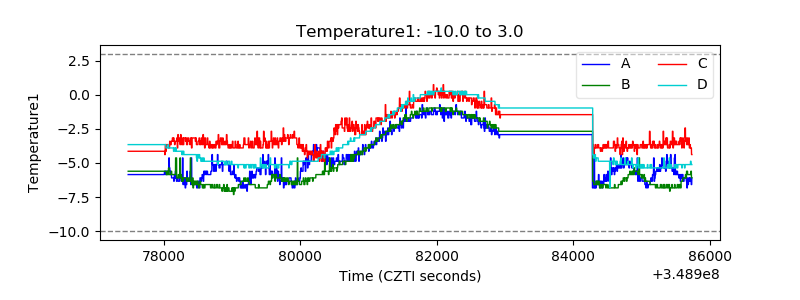 |
| Veto HV Monitor | 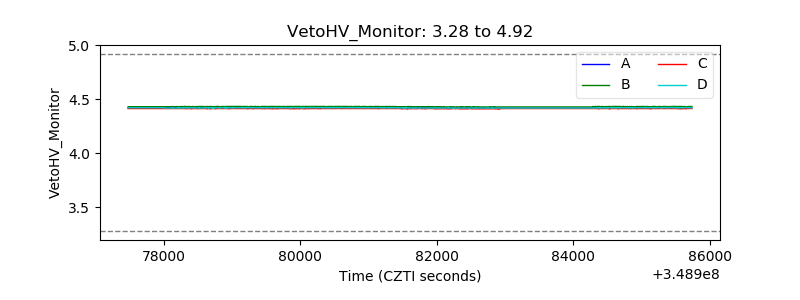 |
| Veto LLD | 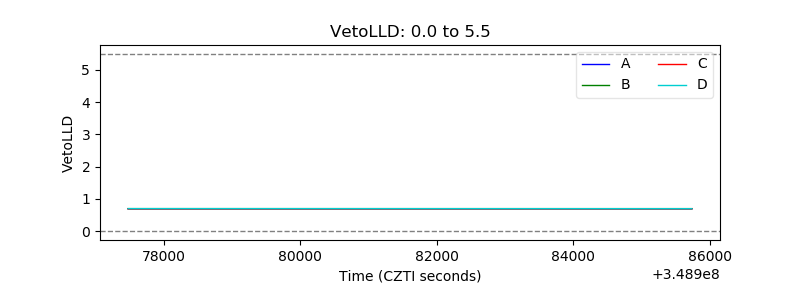 |
| Alpha Counter | 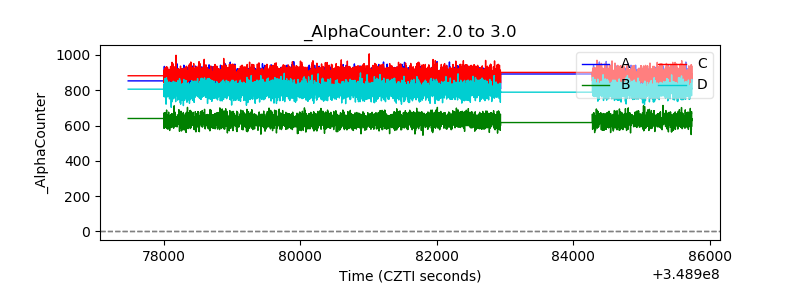 |
| _CPM_Rate | 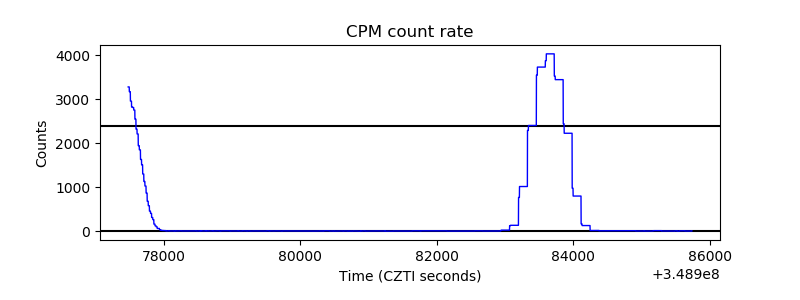 |
| CZT Counter | 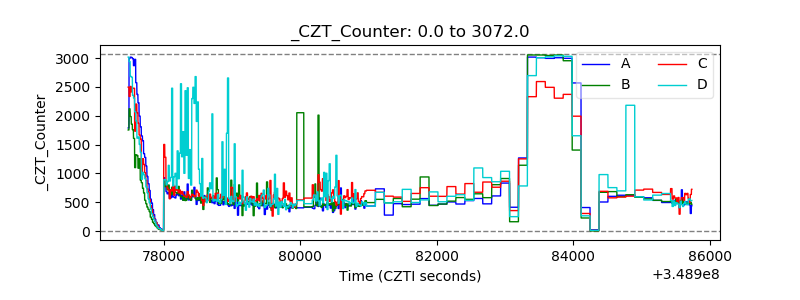 |
| +2.5 Volts monitor | 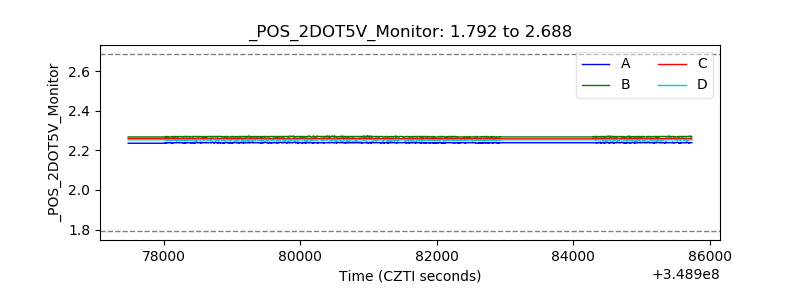 |
| +5 Volts monitor | 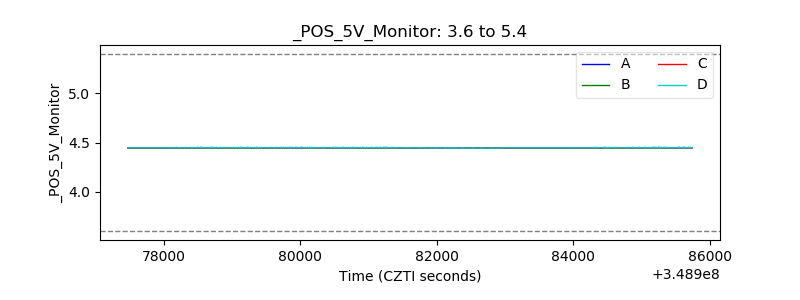 |
| _ROLL_ROT |  |
| _Roll_DEC | 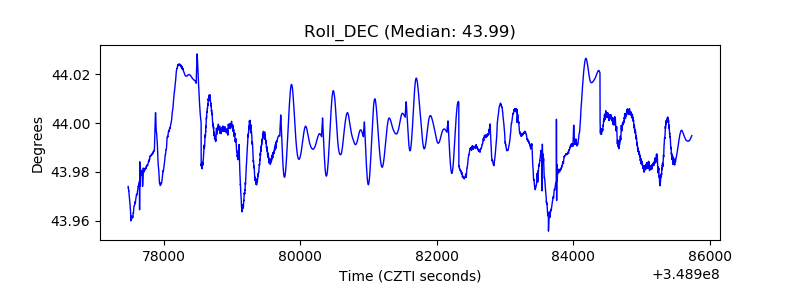 |
| _Roll_RA | 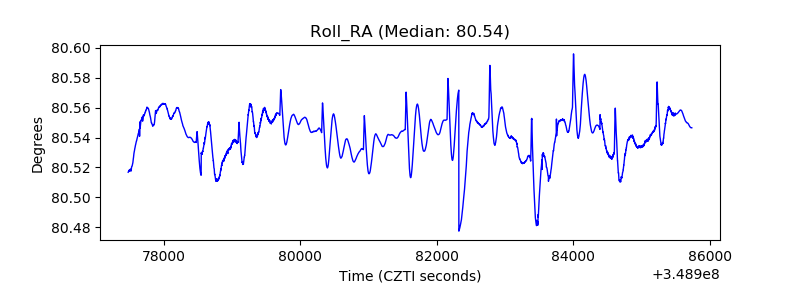 |
| Veto Counter | 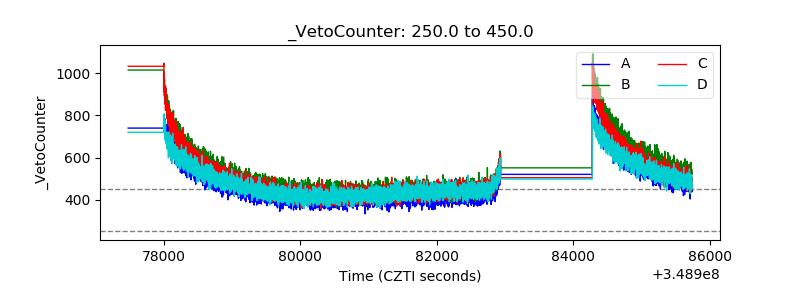 |