| Param | Original file | Final file |
|---|---|---|
| Filename | modeM0/AS1A10_093T01_9000004128_28761cztM0_level2.evt | modeM0/AS1A10_093T01_9000004128_28761cztM0_level2_quad_clean.evt |
| Size (bytes) | 567,904,320 | 72,429,120 |
| Size | 541.6 MB | 69.1 MB |
| Events in quadrant A | 3,421,827 | 459,744 |
| Events in quadrant B | 4,155,077 | 468,594 |
| Events in quadrant C | 4,015,019 | 426,194 |
| Events in quadrant D | 5,178,275 | 396,416 |
| Mode M9 | |||
|---|---|---|---|
| Quadrant | BADHDUFLAG | Total packets | Discarded packets |
| A | 0 | 16 | 0 |
| B | 0 | 17 | 0 |
| C | 0 | 17 | 0 |
| D | 0 | 17 | 0 |
| Mode M0 | |||
|---|---|---|---|
| Quadrant | BADHDUFLAG | Total packets | Discarded packets |
| A | 0 | 13949 | 2 |
| B | 0 | 16398 | 2 |
| C | 0 | 16312 | 2 |
| D | 0 | 19654 | 2 |
| Mode SS | |||
|---|---|---|---|
| Quadrant | BADHDUFLAG | Total packets | Discarded packets |
| A | 0 | 128 | 0 |
| B | 0 | 128 | 0 |
| C | 0 | 128 | 0 |
| D | 0 | 128 | 0 |
| Quadrant | Total seconds | Saturated seconds | Saturation percentage |
|---|---|---|---|
| A | 6337 | 39 | 0.615433% |
| B | 6337 | 218 | 3.440114% |
| C | 6337 | 138 | 2.177687% |
| D | 6337 | 330 | 5.207511% |
Noise dominated data is calculated using 1-second bins in cleaned event files. If a bin has >2000 counts, and if more than 50% of those come from <1% of pixels, then it is considered to be noise-dominated and hence unusable.
| Quadrant | # 1 sec bins | Bins with >0 counts | Bins with >2000 counts | High rate bins dominated by noise | Noise dominated (total time) | Noise dominated (detector-on time) | Marked lightcurve |
|---|---|---|---|---|---|---|---|
| A | 7702 | 6337 | 2 | 2 | 0.03% | 0.03% | 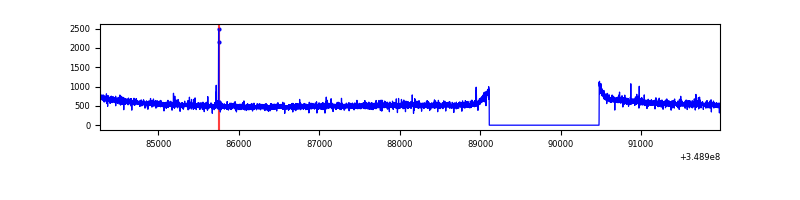 |
| B | 7702 | 6337 | 117 | 117 | 1.52% | 1.85% | 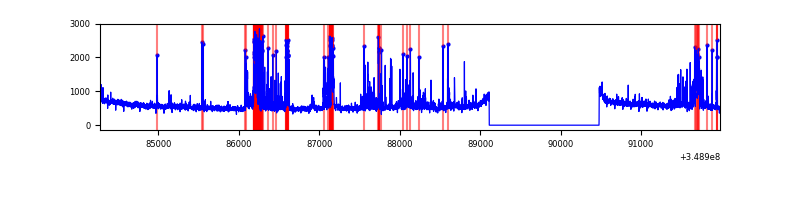 |
| C | 7702 | 6337 | 5 | 5 | 0.06% | 0.08% | 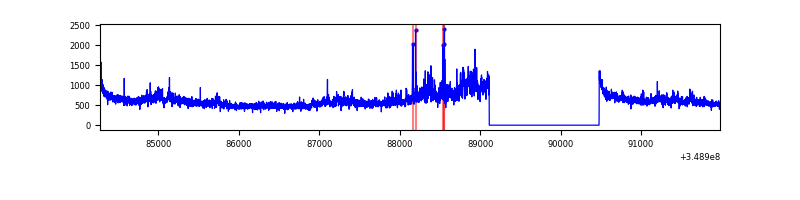 |
| D | 7702 | 6337 | 282 | 282 | 3.66% | 4.45% | 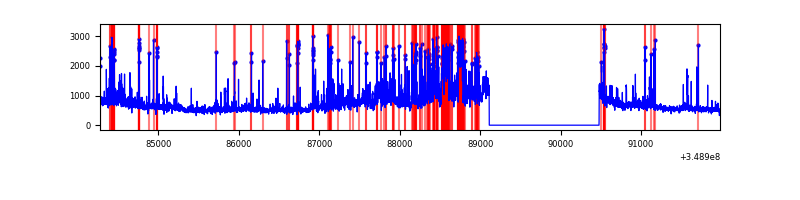 |
Top three noisy pixels from each quadrant. If the there are fewer than three noisy pixels in the level2.evt file, extra rows are filled as -1
| Pixel properties | Quadrant properties | ||||||
|---|---|---|---|---|---|---|---|
| Quadrant | DetID | PixID | Counts | Sigma | Mean | Median | Sigma |
| A | 14 | 239 | 14968 | 81.63 | 882 | 869 | 172.7 |
| A | 13 | 254 | 10903 | 58.09 | 882 | 869 | 172.7 |
| A | 0 | 226 | 7694 | 39.51 | 882 | 869 | 172.7 |
| B | 5 | 255 | 501873 | 3104.36 | 874 | 857 | 161.4 |
| B | 4 | 80 | 211104 | 1302.72 | 874 | 857 | 161.4 |
| B | 12 | 111 | 18780 | 111.05 | 874 | 857 | 161.4 |
| C | 3 | 233 | 578784 | 3054.23 | 828 | 834 | 189.2 |
| C | 14 | 238 | 139175 | 731.08 | 828 | 834 | 189.2 |
| C | 4 | 254 | 48667 | 252.78 | 828 | 834 | 189.2 |
| D | 1 | 52 | 984363 | 5103.75 | 817 | 798 | 192.7 |
| D | 8 | 195 | 981306 | 5087.88 | 817 | 798 | 192.7 |
| D | 12 | 233 | 50345 | 257.1 | 817 | 798 | 192.7 |
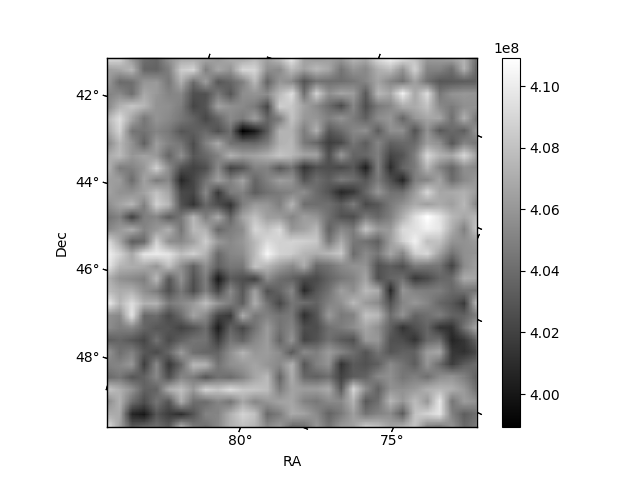
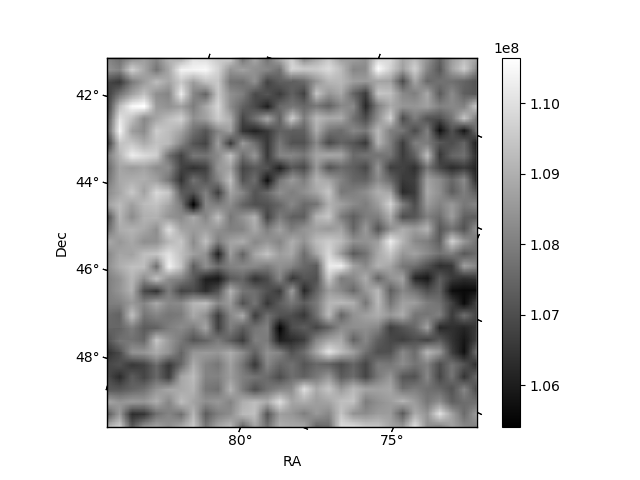
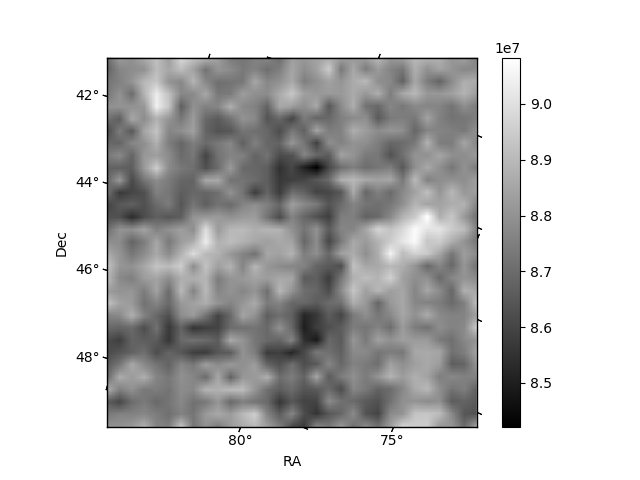
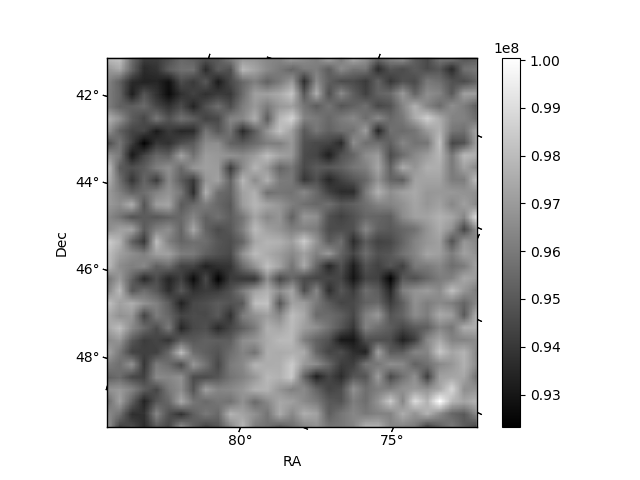
Histogram calculated using DETX and DETY for each event in the final _common_clean file
| Quadrant A | 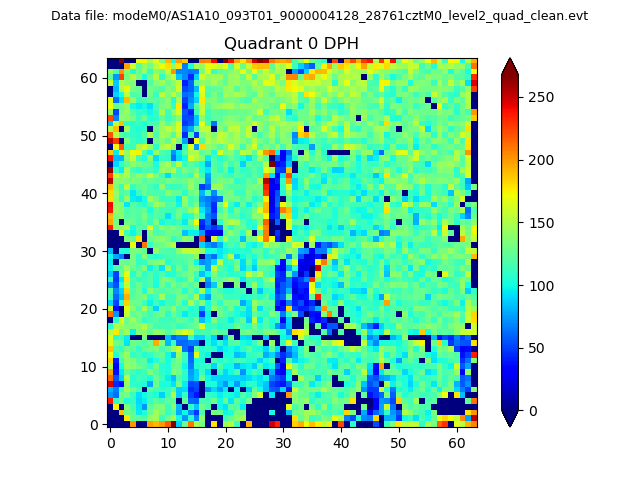 |
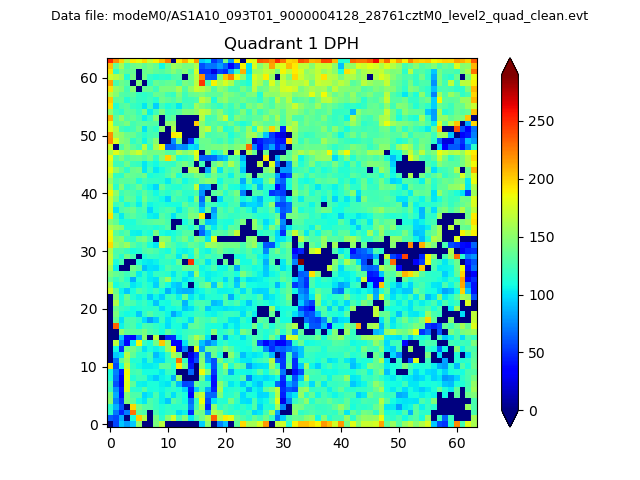 |
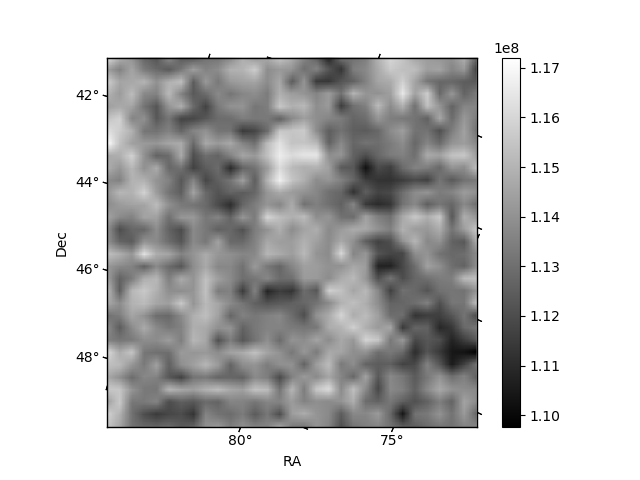
Quadrant B |
|---|---|---|---|
| Quadrant D | 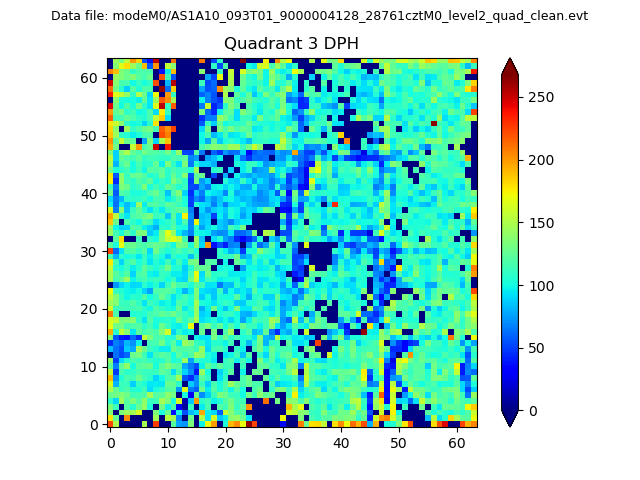 |
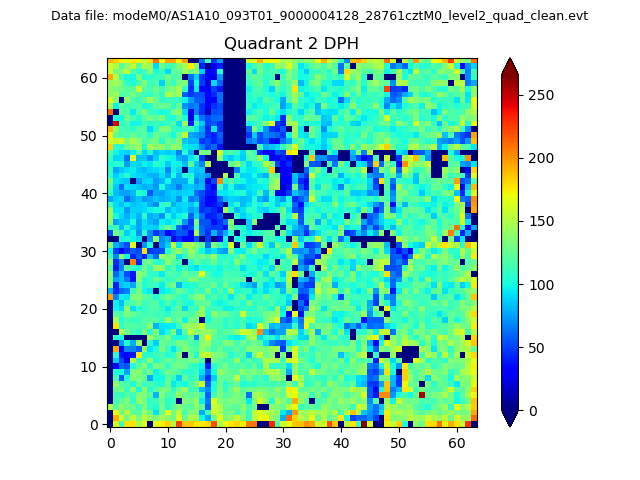 |
Quadrant C |
| Plot type | Count rate plots | Images |
|---|---|---|
| Comparison with Poisson distribution Blue bars denote a histogram of data divided into 1 sec bins. Red curve is a Poisson curve with rate = median count rate of data. |
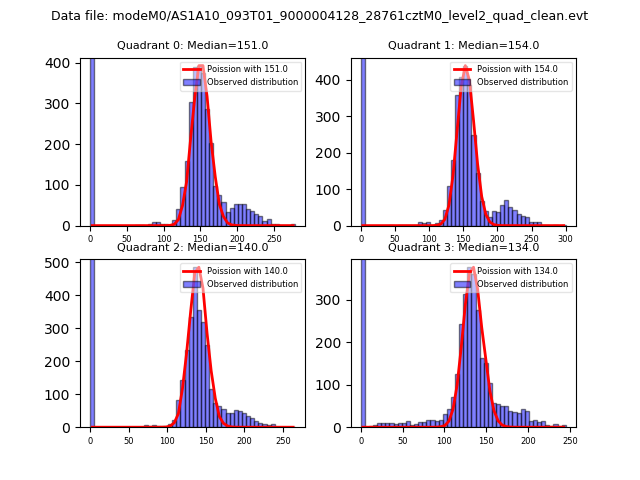 |
 |
| Quadrant-wise count rates Data is divided into 100 sec bins |
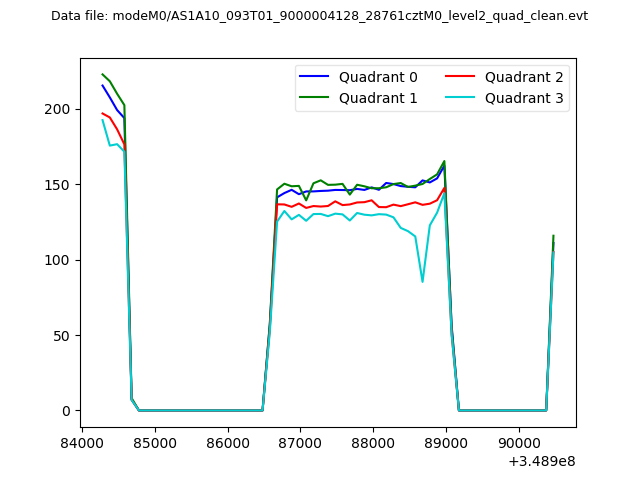 |
|
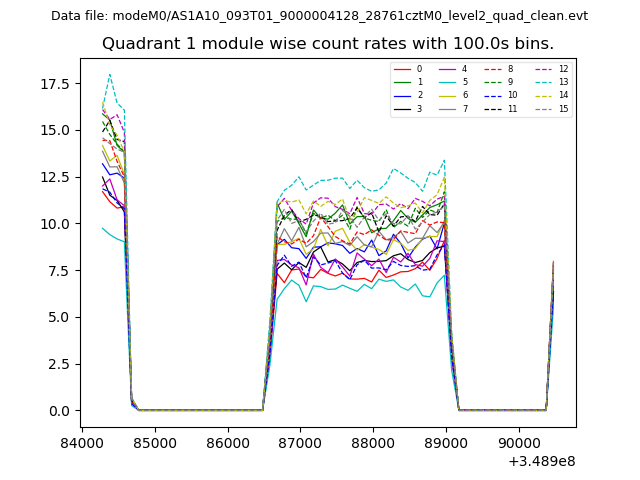
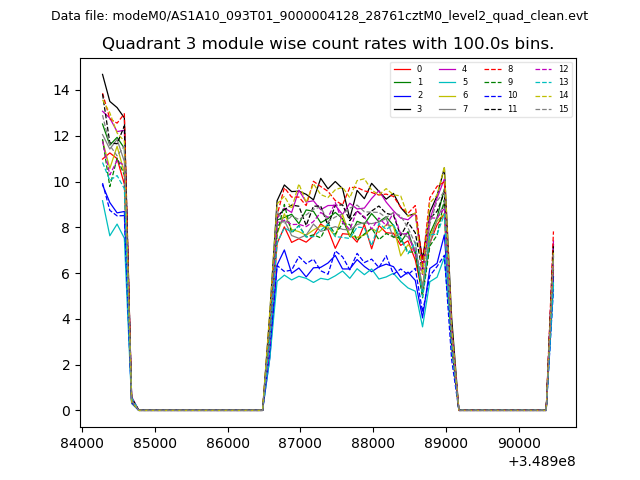
| Module-wise count rates for Quadrant A Data is divided into 100 sec bins |
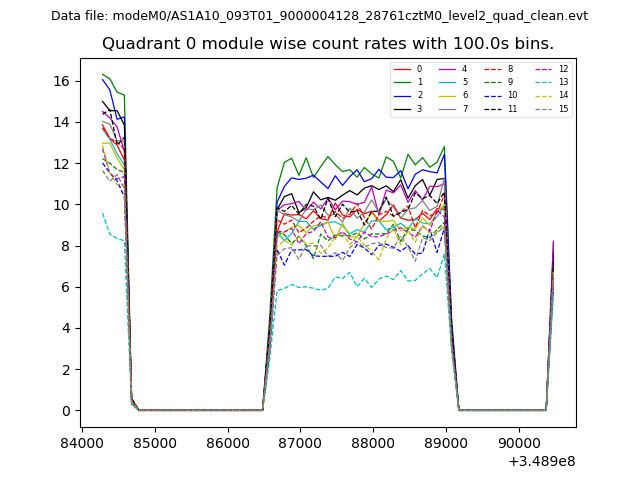 |
 |
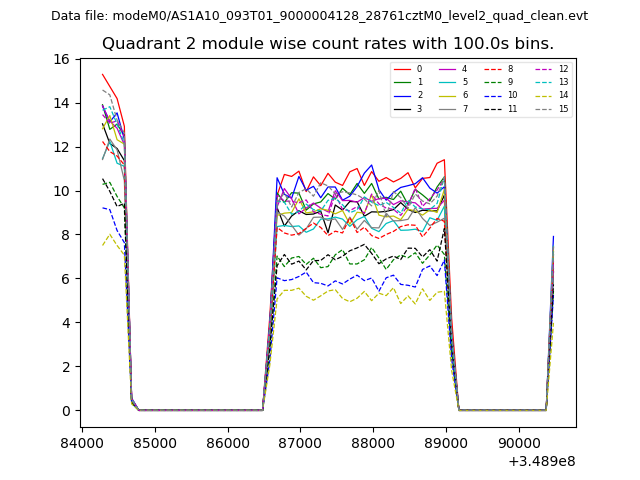
| Module-wise count rates for Quadrant B Data is divided into 100 sec bins |
 |
 |
| Module-wise count rates for Quadrant C Data is divided into 100 sec bins |
 |
 |
| Module-wise count rates for Quadrant D Data is divided into 100 sec bins |
 |
 |
| Parameter | Plot |
|---|---|
| CZT HV Monitor | 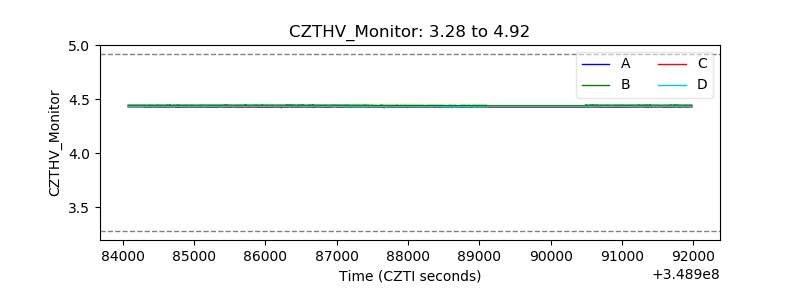 |
| D_VDD | 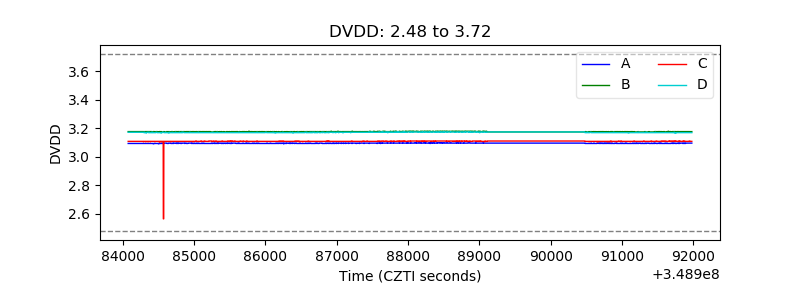 |
| Temperature 1 | 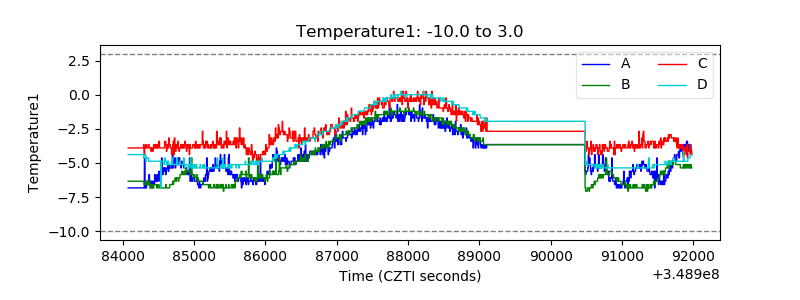 |
| Veto HV Monitor | 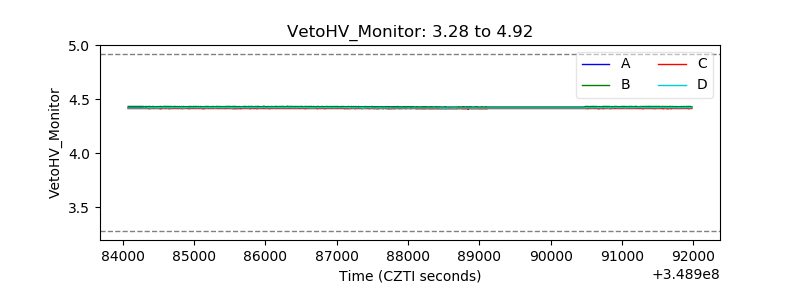 |
| Veto LLD | 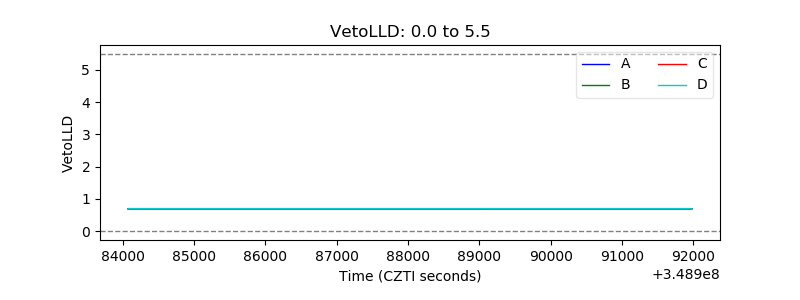 |
| Alpha Counter | 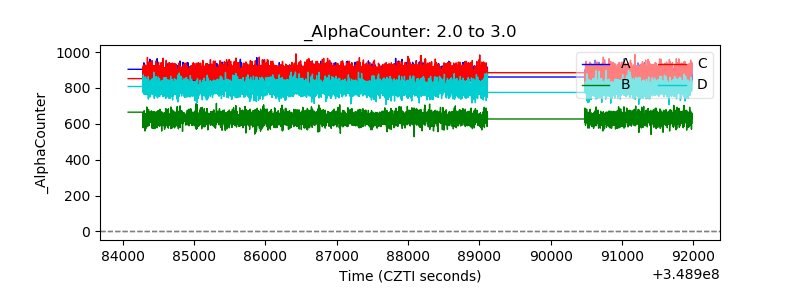 |
| _CPM_Rate | 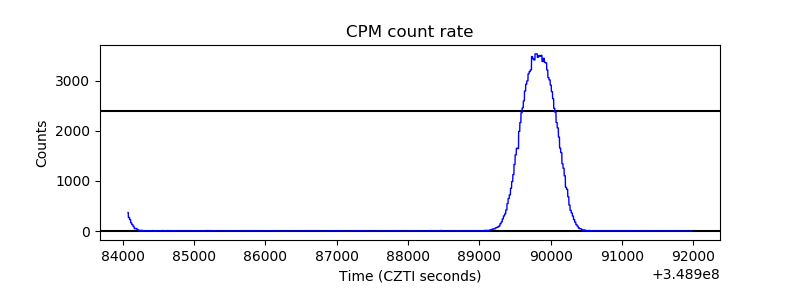 |
| CZT Counter | 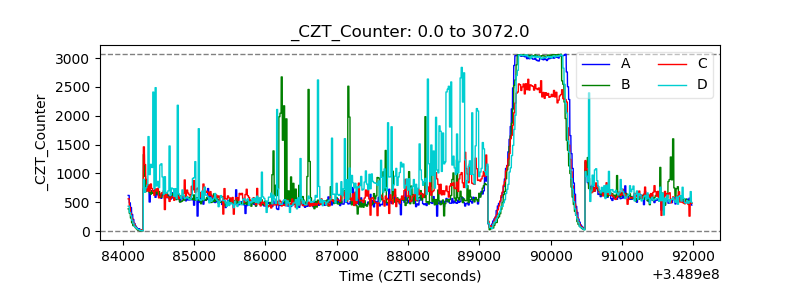 |
| +2.5 Volts monitor |  |
| +5 Volts monitor |  |
| _ROLL_ROT | 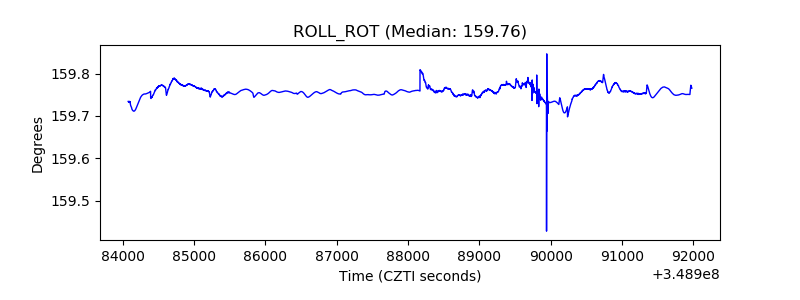 |
| _Roll_DEC | 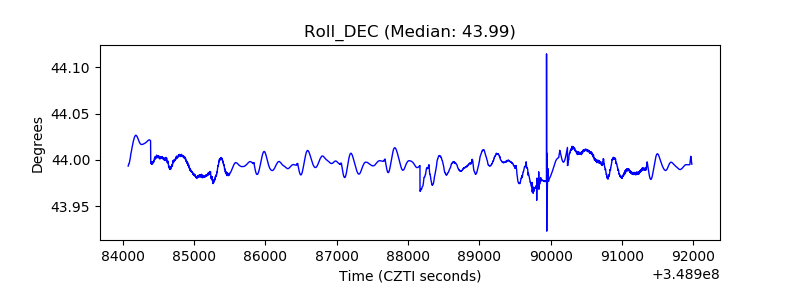 |
| _Roll_RA | 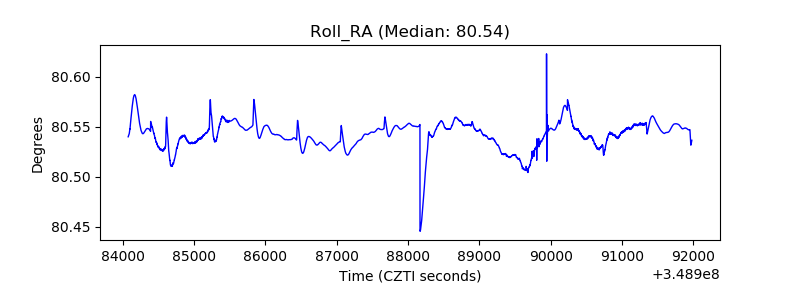 |
| Veto Counter | 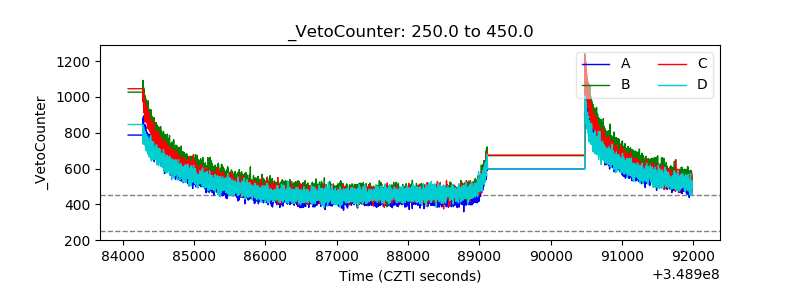 |