| Param | Original file | Final file |
|---|---|---|
| Filename | modeM0/AS1A10_093T01_9000004128_28763cztM0_level2.evt | modeM0/AS1A10_093T01_9000004128_28763cztM0_level2_quad_clean.evt |
| Size (bytes) | 600,834,240 | 80,683,200 |
| Size | 573.0 MB | 76.9 MB |
| Events in quadrant A | 3,411,386 | 530,283 |
| Events in quadrant B | 3,917,609 | 530,319 |
| Events in quadrant C | 4,570,844 | 482,533 |
| Events in quadrant D | 5,867,835 | 457,605 |
| Mode M9 | |||
|---|---|---|---|
| Quadrant | BADHDUFLAG | Total packets | Discarded packets |
| A | 0 | 18 | 0 |
| B | 0 | 19 | 0 |
| C | 0 | 19 | 0 |
| D | 0 | 19 | 0 |
| Mode M0 | |||
|---|---|---|---|
| Quadrant | BADHDUFLAG | Total packets | Discarded packets |
| A | 0 | 13754 | 2 |
| B | 0 | 15407 | 2 |
| C | 0 | 17969 | 2 |
| D | 0 | 21744 | 2 |
| Mode SS | |||
|---|---|---|---|
| Quadrant | BADHDUFLAG | Total packets | Discarded packets |
| A | 0 | 128 | 0 |
| B | 0 | 128 | 0 |
| C | 0 | 128 | 0 |
| D | 0 | 128 | 0 |
| Quadrant | Total seconds | Saturated seconds | Saturation percentage |
|---|---|---|---|
| A | 6336 | 81 | 1.278409% |
| B | 6336 | 253 | 3.993056% |
| C | 6336 | 324 | 5.113636% |
| D | 6336 | 661 | 10.432449% |
Noise dominated data is calculated using 1-second bins in cleaned event files. If a bin has >2000 counts, and if more than 50% of those come from <1% of pixels, then it is considered to be noise-dominated and hence unusable.
| Quadrant | # 1 sec bins | Bins with >0 counts | Bins with >2000 counts | High rate bins dominated by noise | Noise dominated (total time) | Noise dominated (detector-on time) | Marked lightcurve |
|---|---|---|---|---|---|---|---|
| A | 7631 | 6336 | 0 | 0 | 0.00% | 0.00% | 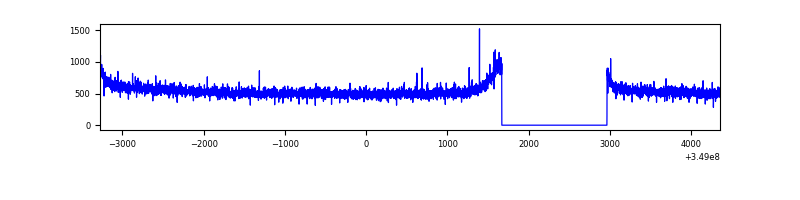 |
| B | 7631 | 6336 | 121 | 121 | 1.59% | 1.91% | 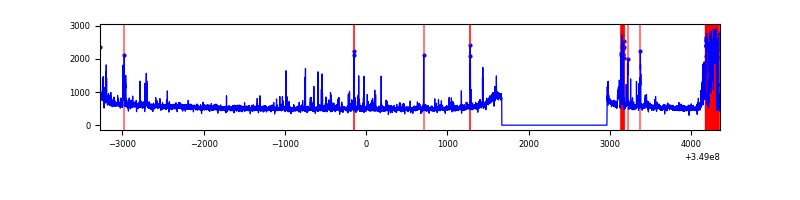 |
| C | 7631 | 6336 | 59 | 59 | 0.77% | 0.93% | 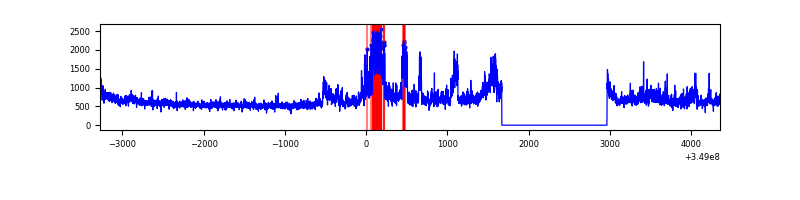 |
| D | 7631 | 6336 | 608 | 608 | 7.97% | 9.60% | 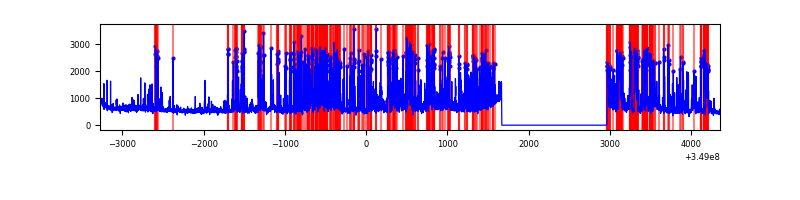 |
Top three noisy pixels from each quadrant. If the there are fewer than three noisy pixels in the level2.evt file, extra rows are filled as -1
| Pixel properties | Quadrant properties | ||||||
|---|---|---|---|---|---|---|---|
| Quadrant | DetID | PixID | Counts | Sigma | Mean | Median | Sigma |
| A | 14 | 239 | 17721 | 96.1 | 878 | 865 | 175.4 |
| A | 13 | 254 | 10627 | 55.65 | 878 | 865 | 175.4 |
| A | 3 | 137 | 7592 | 38.35 | 878 | 865 | 175.4 |
| B | 5 | 255 | 455090 | 2825.44 | 861 | 842 | 160.8 |
| B | 4 | 80 | 77138 | 474.56 | 861 | 842 | 160.8 |
| B | 12 | 111 | 18627 | 110.62 | 861 | 842 | 160.8 |
| C | 3 | 233 | 1209104 | 6467.04 | 811 | 819 | 186.8 |
| C | 14 | 238 | 144536 | 769.21 | 811 | 819 | 186.8 |
| C | 4 | 254 | 28044 | 145.71 | 811 | 819 | 186.8 |
| D | 1 | 52 | 1855807 | 9884.8 | 799 | 778 | 187.7 |
| D | 8 | 195 | 909978 | 4844.81 | 799 | 778 | 187.7 |
| D | 12 | 233 | 39264 | 205.08 | 799 | 778 | 187.7 |
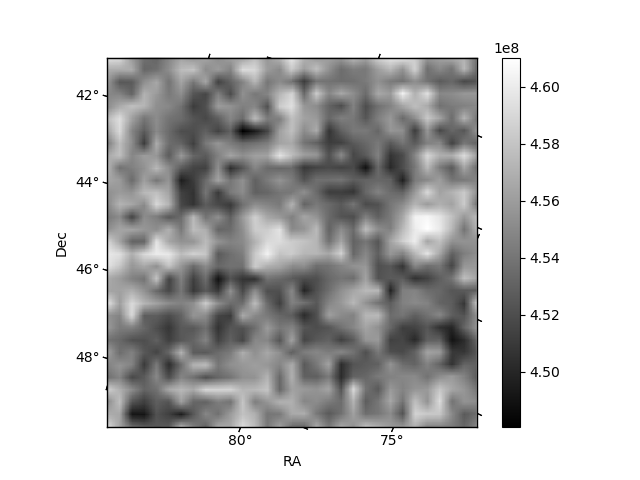
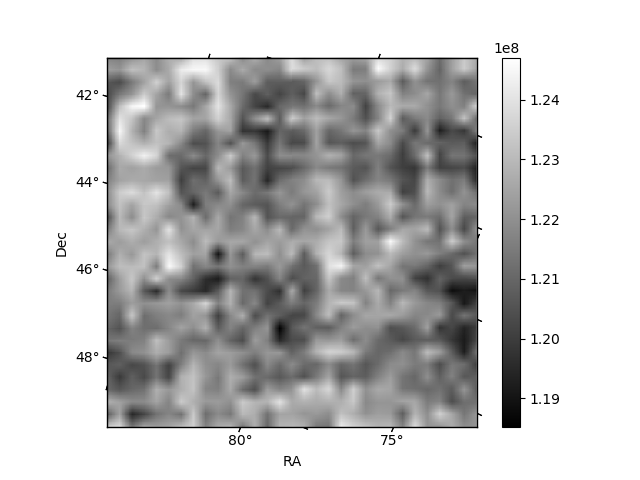
Histogram calculated using DETX and DETY for each event in the final _common_clean file
| Quadrant A | 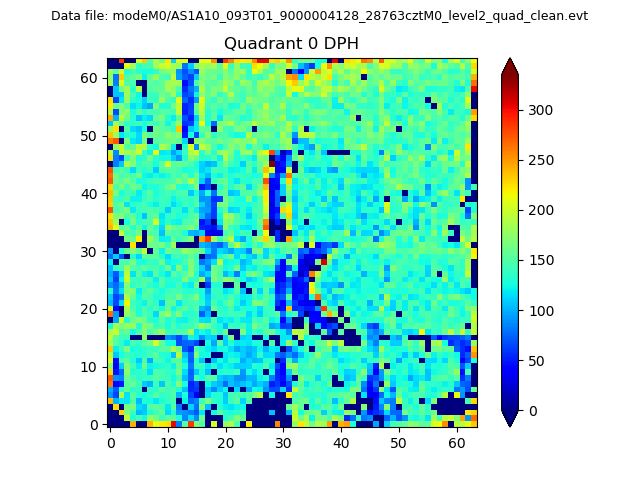 |
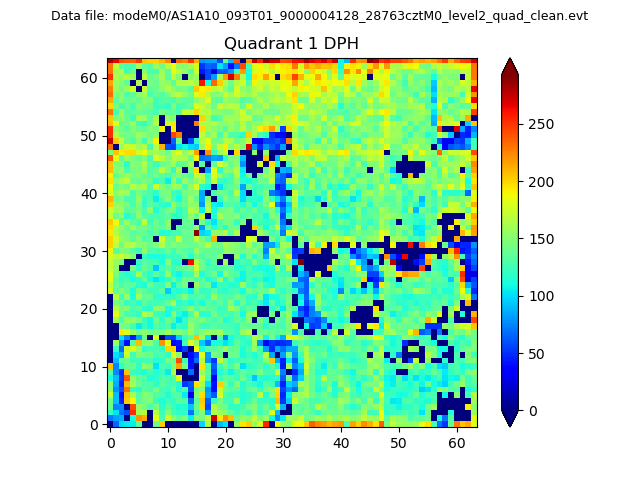 |
Quadrant B |
|---|---|---|---|
| Quadrant D | 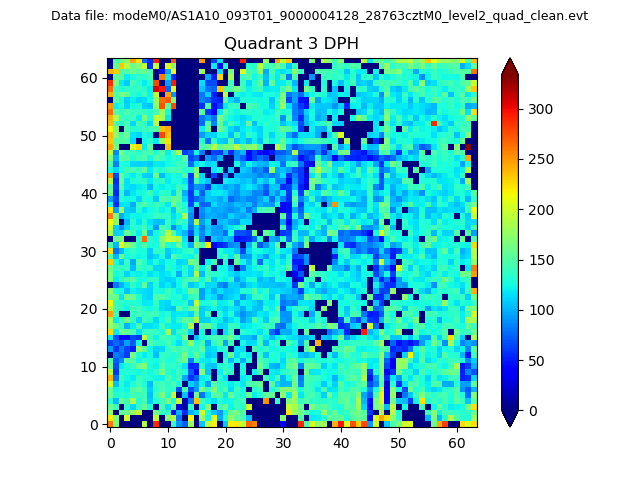 |
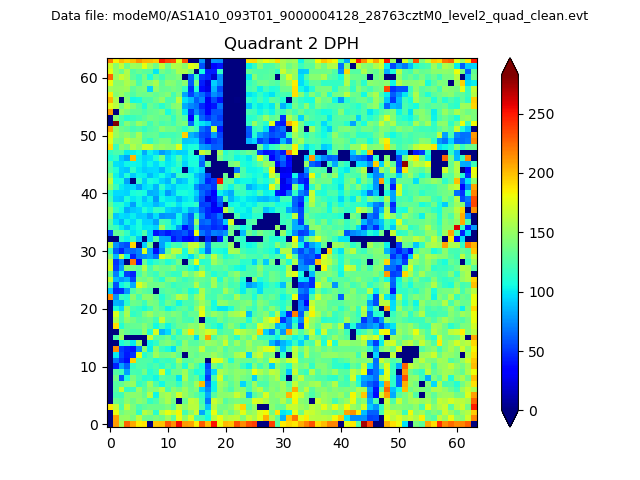 |
Quadrant C |
| Plot type | Count rate plots | Images |
|---|---|---|
| Comparison with Poisson distribution Blue bars denote a histogram of data divided into 1 sec bins. Red curve is a Poisson curve with rate = median count rate of data. |
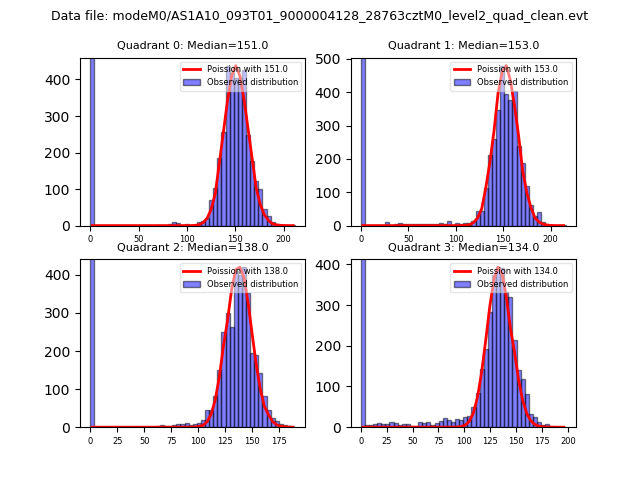 |
 |
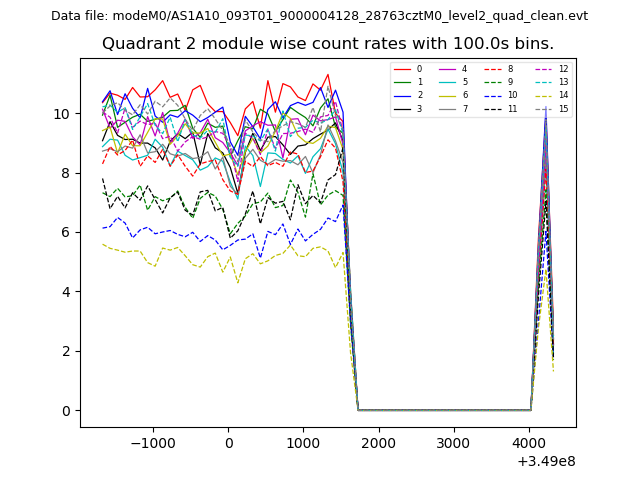
| Quadrant-wise count rates Data is divided into 100 sec bins |
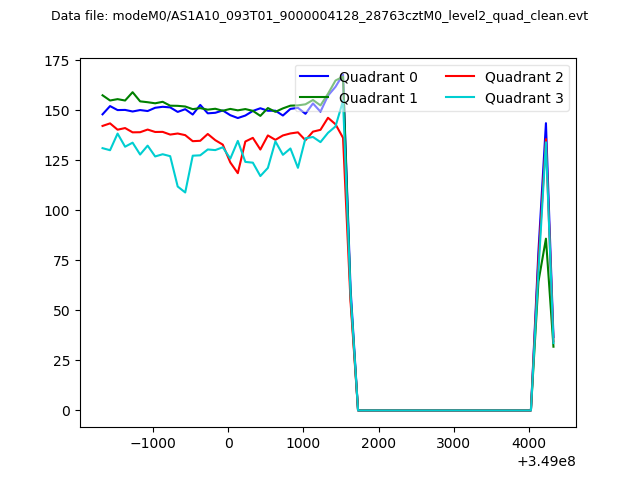 |
|
| Module-wise count rates for Quadrant A Data is divided into 100 sec bins |
 |
 |
| Module-wise count rates for Quadrant B Data is divided into 100 sec bins |
 |
 |
| Module-wise count rates for Quadrant C Data is divided into 100 sec bins |
 |
 |
| Module-wise count rates for Quadrant D Data is divided into 100 sec bins |
 |
 |
| Parameter | Plot |
|---|---|
| CZT HV Monitor | 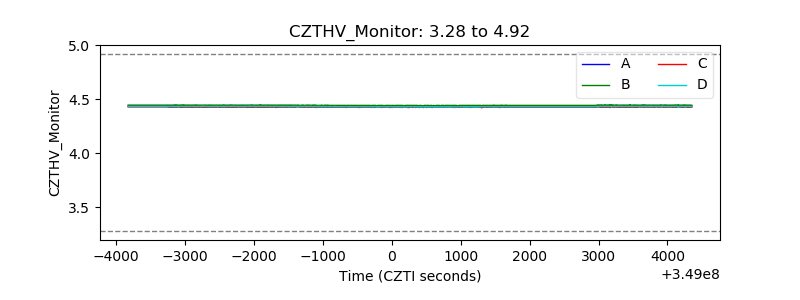 |
| D_VDD | 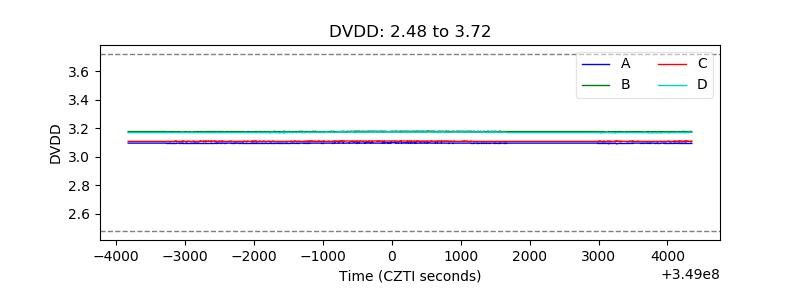 |
| Temperature 1 | 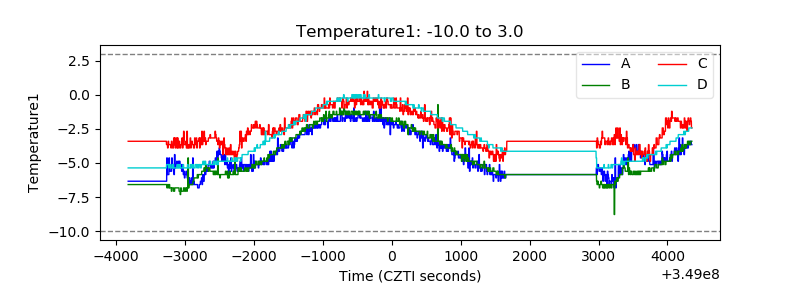 |
| Veto HV Monitor | 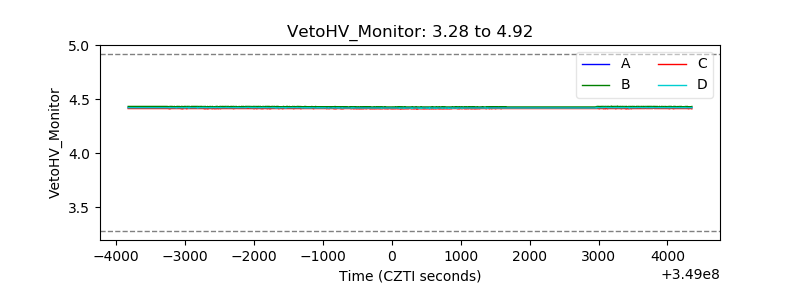 |
| Veto LLD | 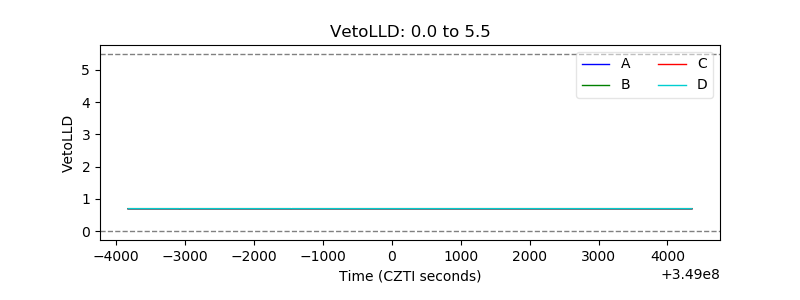 |
| Alpha Counter | 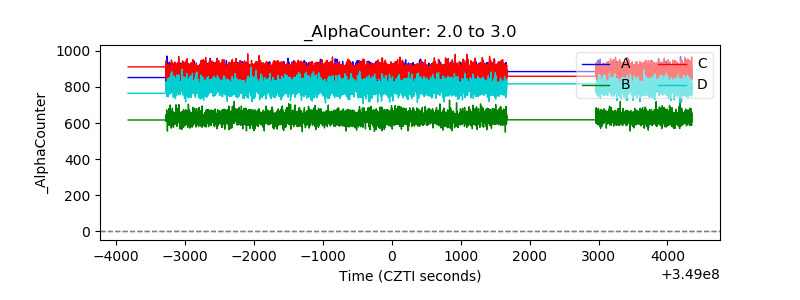 |
| _CPM_Rate | 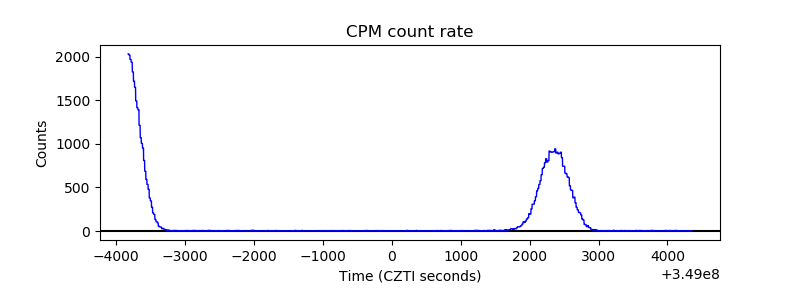 |
| CZT Counter | 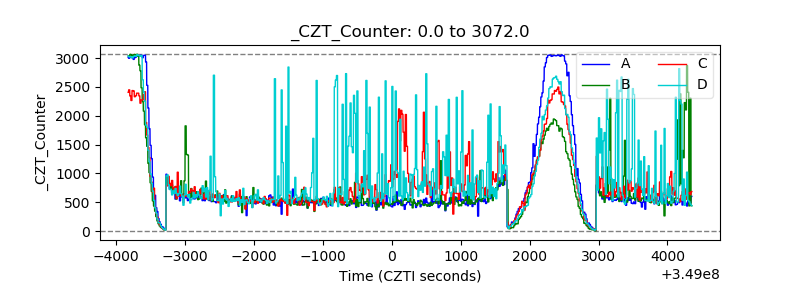 |
| +2.5 Volts monitor | 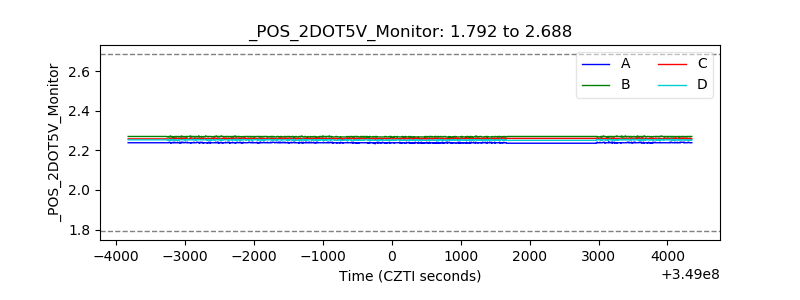 |
| +5 Volts monitor |  |
| _ROLL_ROT |  |
| _Roll_DEC |  |
| _Roll_RA | 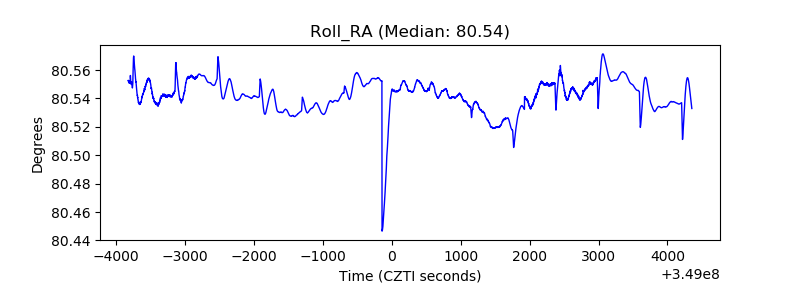 |
| Veto Counter | 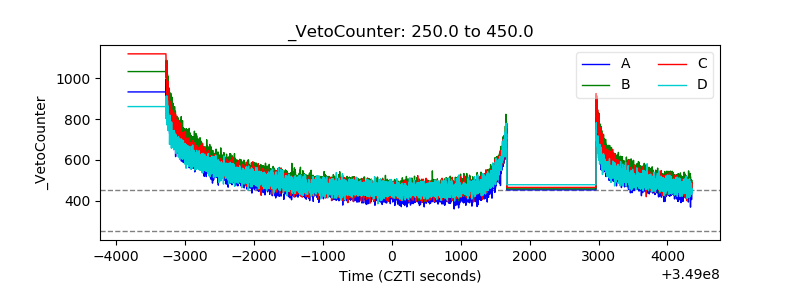 |