| Param | Original file | Final file |
|---|---|---|
| Filename | modeM0/AS1A10_093T01_9000004128_28764cztM0_level2.evt | modeM0/AS1A10_093T01_9000004128_28764cztM0_level2_quad_clean.evt |
| Size (bytes) | 630,959,040 | 93,988,800 |
| Size | 601.7 MB | 89.6 MB |
| Events in quadrant A | 3,335,551 | 633,156 |
| Events in quadrant B | 4,027,838 | 633,203 |
| Events in quadrant C | 4,690,776 | 582,858 |
| Events in quadrant D | 6,613,924 | 542,520 |
| Mode M9 | |||
|---|---|---|---|
| Quadrant | BADHDUFLAG | Total packets | Discarded packets |
| A | 0 | 9 | 0 |
| B | 0 | 9 | 0 |
| C | 0 | 9 | 0 |
| D | 0 | 9 | 0 |
| Mode M0 | |||
|---|---|---|---|
| Quadrant | BADHDUFLAG | Total packets | Discarded packets |
| A | 0 | 13580 | 1 |
| B | 0 | 15813 | 1 |
| C | 0 | 18573 | 1 |
| D | 0 | 24072 | 1 |
| Mode SS | |||
|---|---|---|---|
| Quadrant | BADHDUFLAG | Total packets | Discarded packets |
| A | 0 | 132 | 0 |
| B | 0 | 132 | 0 |
| C | 0 | 132 | 0 |
| D | 0 | 132 | 0 |
| Quadrant | Total seconds | Saturated seconds | Saturation percentage |
|---|---|---|---|
| A | 6515 | 110 | 1.688411% |
| B | 6516 | 304 | 4.665439% |
| C | 6516 | 218 | 3.345611% |
| D | 6516 | 798 | 12.246777% |
Noise dominated data is calculated using 1-second bins in cleaned event files. If a bin has >2000 counts, and if more than 50% of those come from <1% of pixels, then it is considered to be noise-dominated and hence unusable.
| Quadrant | # 1 sec bins | Bins with >0 counts | Bins with >2000 counts | High rate bins dominated by noise | Noise dominated (total time) | Noise dominated (detector-on time) | Marked lightcurve |
|---|---|---|---|---|---|---|---|
| A | 7465 | 6515 | 0 | 0 | 0.00% | 0.00% | 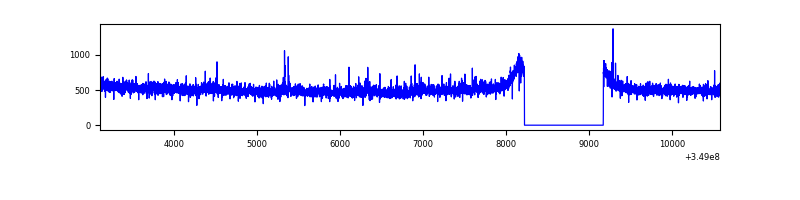 |
| B | 7466 | 6516 | 143 | 143 | 1.92% | 2.19% | 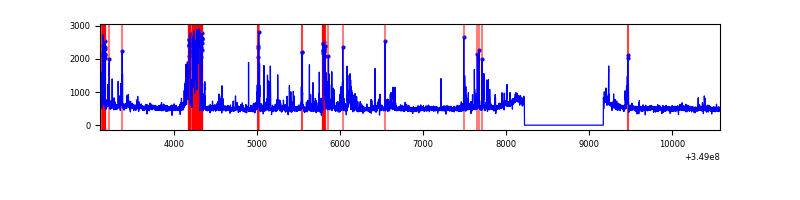 |
| C | 7466 | 6516 | 9 | 9 | 0.12% | 0.14% | 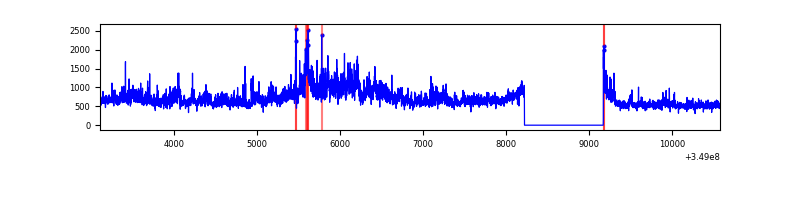 |
| D | 7466 | 6516 | 724 | 724 | 9.70% | 11.11% | 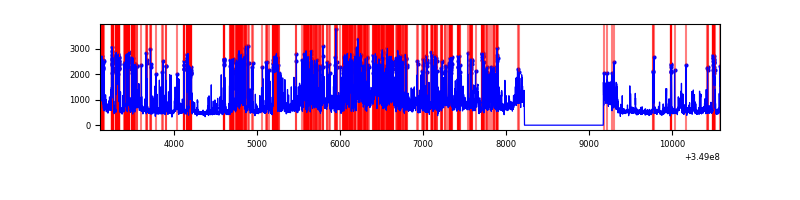 |
Top three noisy pixels from each quadrant. If the there are fewer than three noisy pixels in the level2.evt file, extra rows are filled as -1
| Pixel properties | Quadrant properties | ||||||
|---|---|---|---|---|---|---|---|
| Quadrant | DetID | PixID | Counts | Sigma | Mean | Median | Sigma |
| A | 14 | 239 | 28351 | 161.17 | 850 | 835 | 170.7 |
| A | 15 | 174 | 16897 | 94.08 | 850 | 835 | 170.7 |
| A | 13 | 254 | 11301 | 61.3 | 850 | 835 | 170.7 |
| B | 5 | 255 | 458251 | 2945.98 | 830 | 812 | 155.3 |
| B | 4 | 80 | 223940 | 1436.98 | 830 | 812 | 155.3 |
| B | 0 | 244 | 24276 | 151.11 | 830 | 812 | 155.3 |
| C | 3 | 233 | 1358495 | 7354.04 | 792 | 798 | 184.6 |
| C | 14 | 238 | 133288 | 717.64 | 792 | 798 | 184.6 |
| C | 4 | 254 | 98249 | 527.85 | 792 | 798 | 184.6 |
| D | 1 | 52 | 2182189 | 11876.0 | 775 | 754 | 183.7 |
| D | 8 | 195 | 1150455 | 6259.11 | 775 | 754 | 183.7 |
| D | 12 | 233 | 185500 | 1005.78 | 775 | 754 | 183.7 |
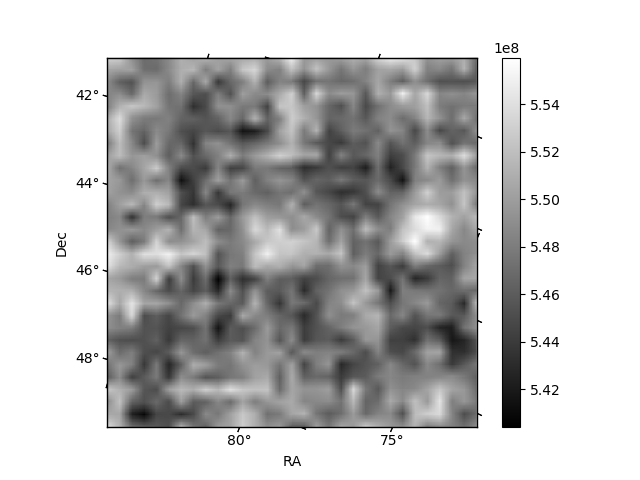
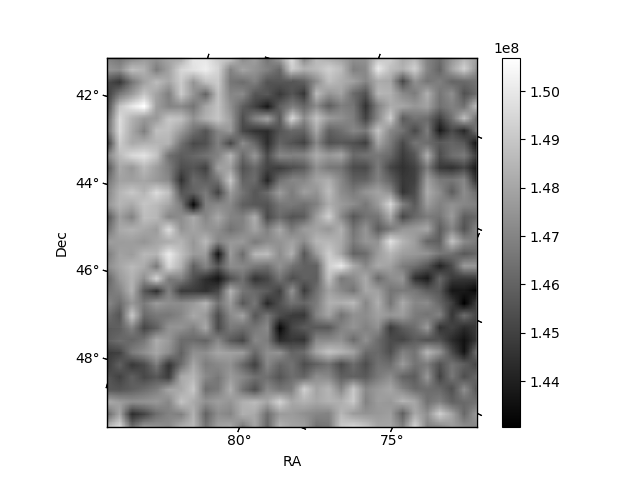
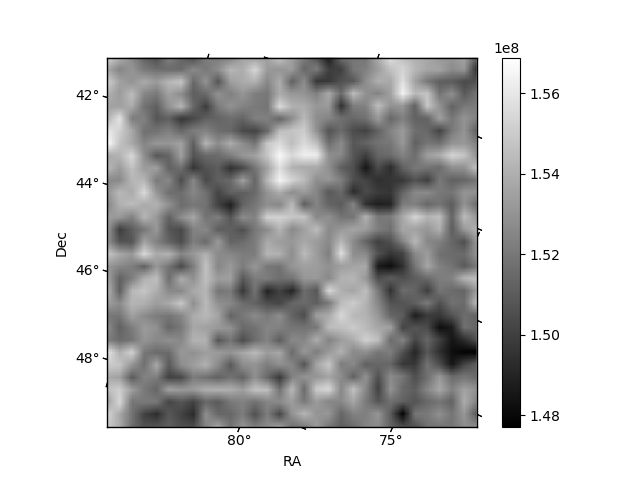
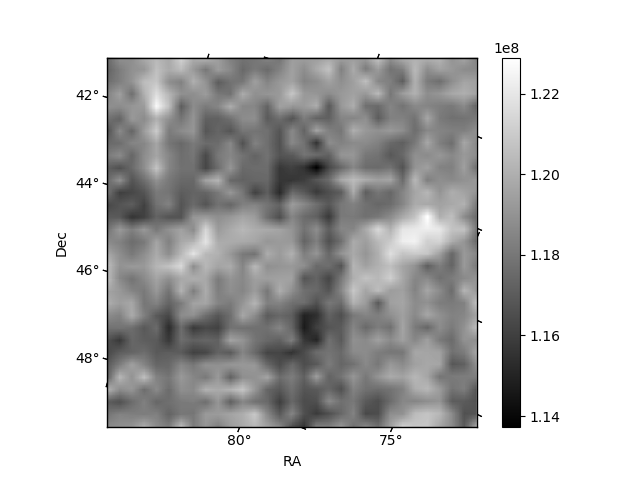
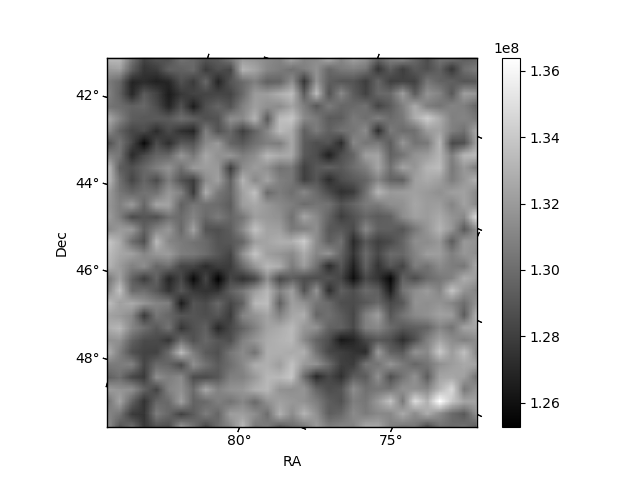
Histogram calculated using DETX and DETY for each event in the final _common_clean file
| Quadrant A | 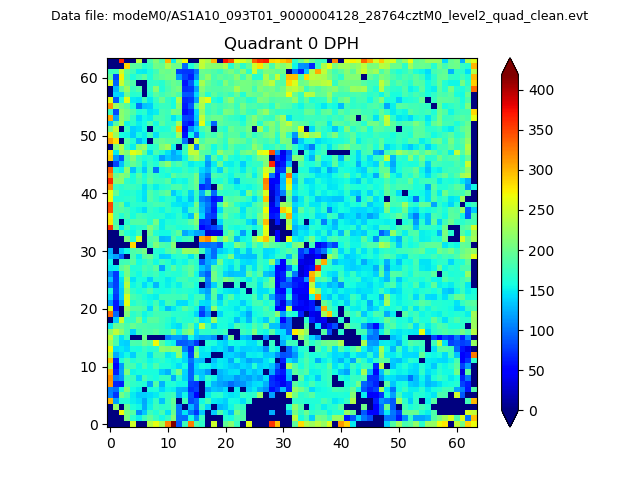 |
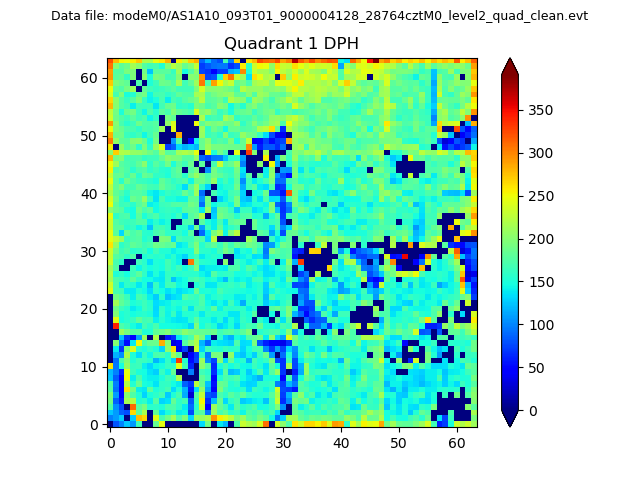 |
Quadrant B |
|---|---|---|---|
| Quadrant D | 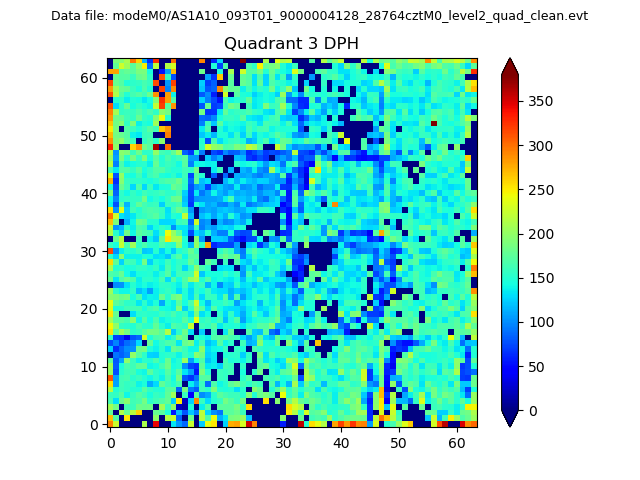 |
 |
Quadrant C |
| Plot type | Count rate plots | Images |
|---|---|---|
| Comparison with Poisson distribution Blue bars denote a histogram of data divided into 1 sec bins. Red curve is a Poisson curve with rate = median count rate of data. |
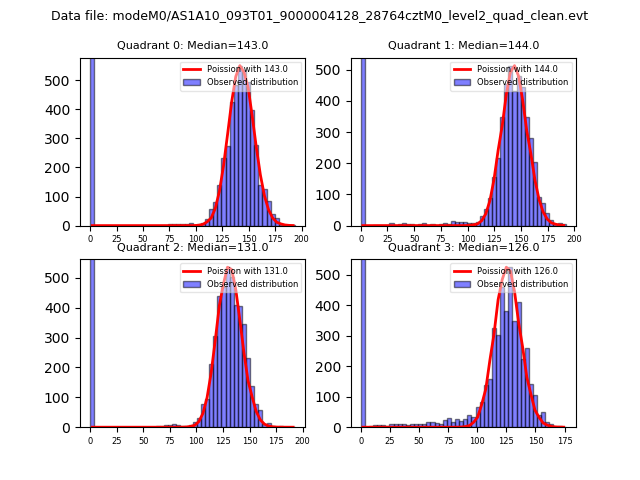 |
 |
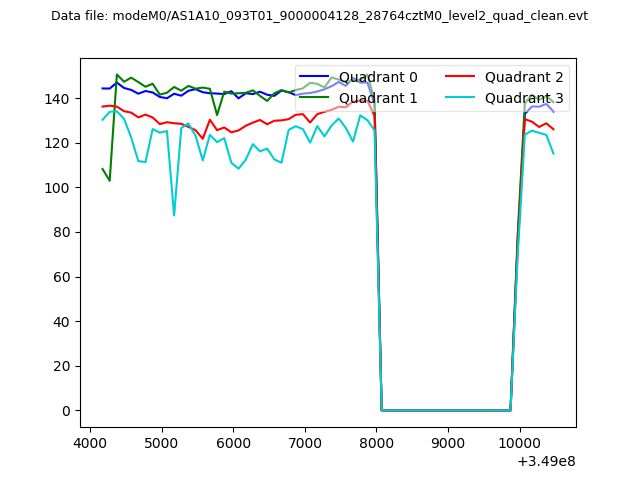
| Quadrant-wise count rates Data is divided into 100 sec bins |
 |
|
| Module-wise count rates for Quadrant A Data is divided into 100 sec bins |
 |
 |
| Module-wise count rates for Quadrant B Data is divided into 100 sec bins |
 |
 |
| Module-wise count rates for Quadrant C Data is divided into 100 sec bins |
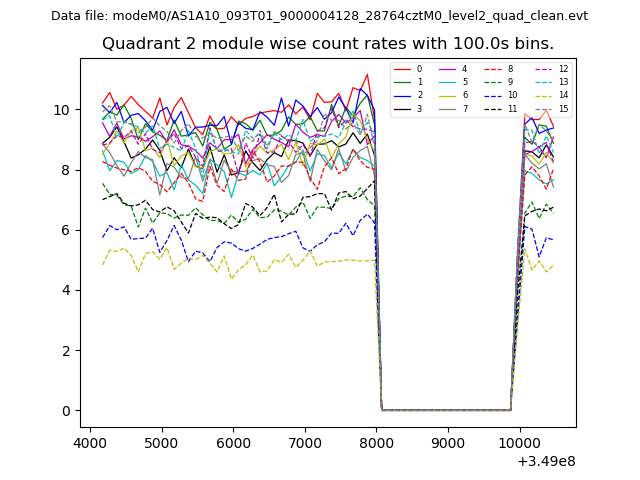 |
 |
| Module-wise count rates for Quadrant D Data is divided into 100 sec bins |
 |
 |
| Parameter | Plot |
|---|---|
| CZT HV Monitor | 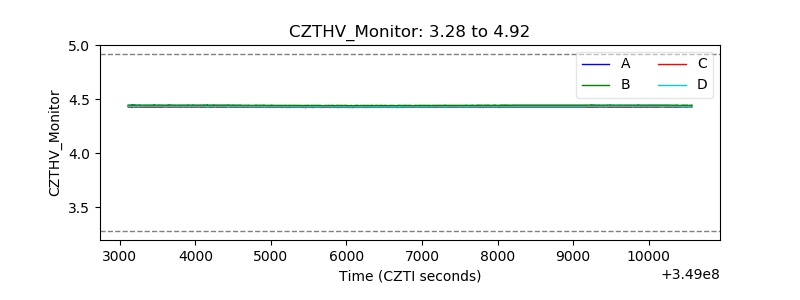 |
| D_VDD | 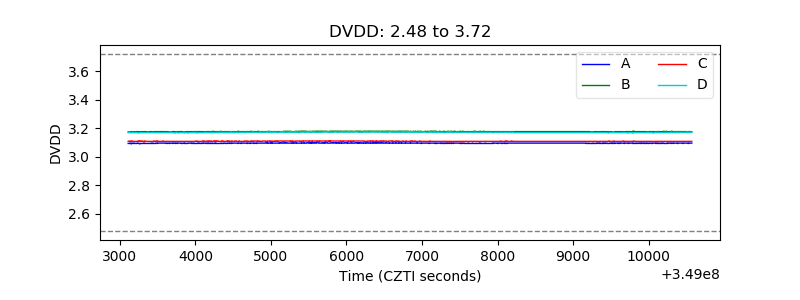 |
| Temperature 1 | 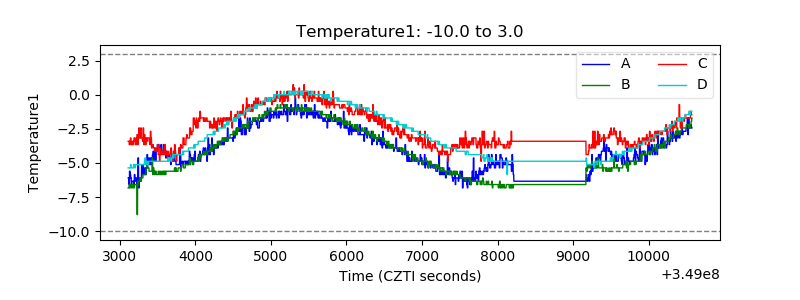 |
| Veto HV Monitor | 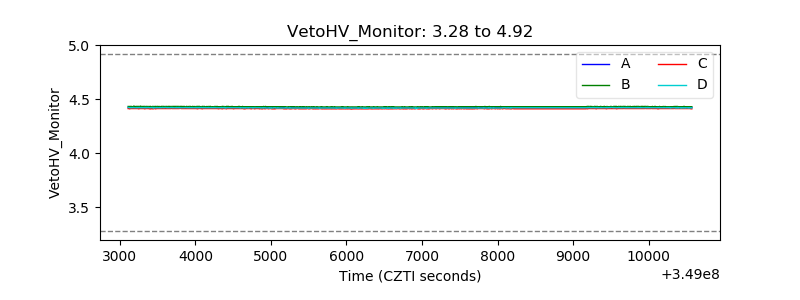 |
| Veto LLD | 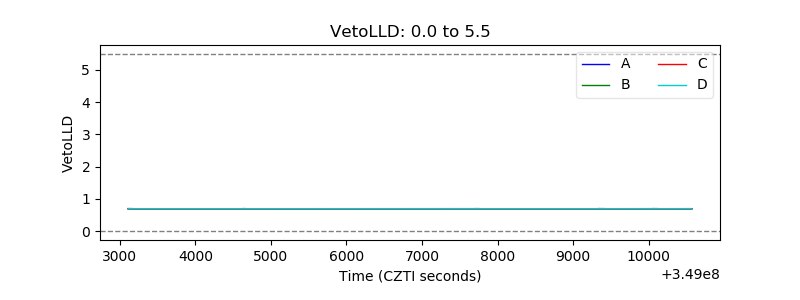 |
| Alpha Counter | 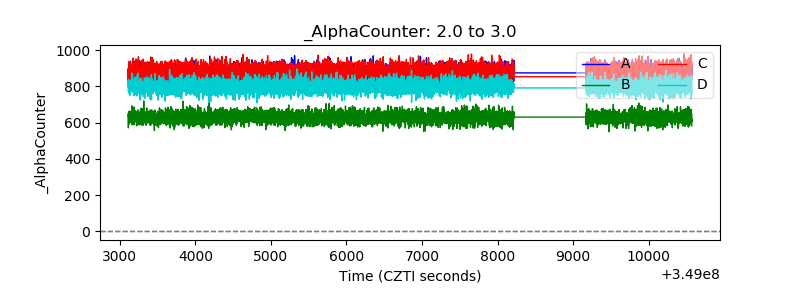 |
| _CPM_Rate | 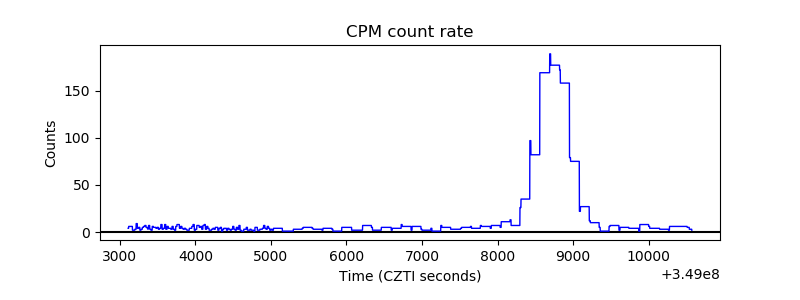 |
| CZT Counter | 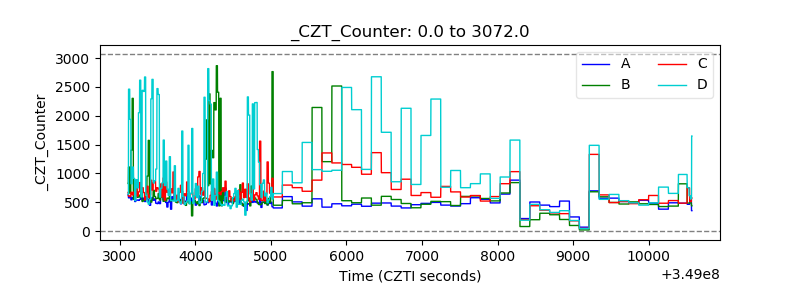 |
| +2.5 Volts monitor | 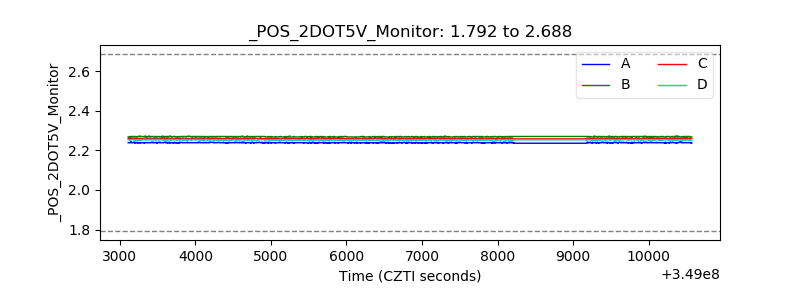 |
| +5 Volts monitor | 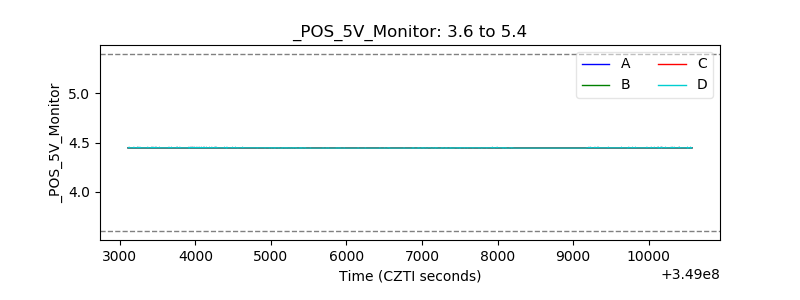 |
| _ROLL_ROT | 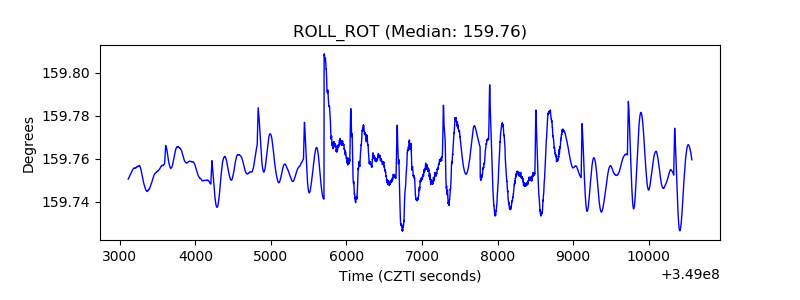 |
| _Roll_DEC |  |
| _Roll_RA | 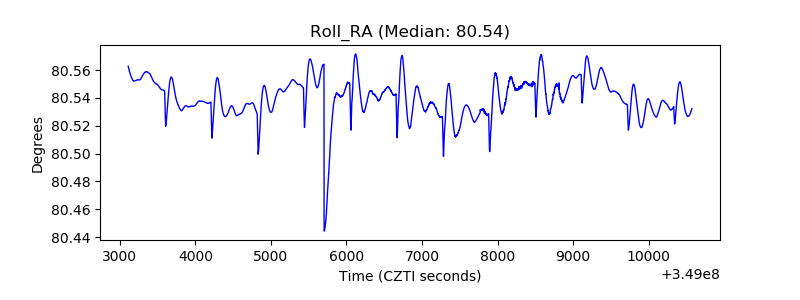 |
| Veto Counter |  |