| Param | Original file | Final file |
|---|---|---|
| Filename | modeM0/AS1A10_093T01_9000004128_28765cztM0_level2.evt | modeM0/AS1A10_093T01_9000004128_28765cztM0_level2_quad_clean.evt |
| Size (bytes) | 634,000,320 | 99,123,840 |
| Size | 604.6 MB | 94.5 MB |
| Events in quadrant A | 3,513,003 | 661,596 |
| Events in quadrant B | 3,939,136 | 667,283 |
| Events in quadrant C | 4,288,618 | 604,229 |
| Events in quadrant D | 6,971,016 | 566,028 |
| Mode M9 | |||
|---|---|---|---|
| Quadrant | BADHDUFLAG | Total packets | Discarded packets |
| A | 0 | 11 | 0 |
| B | 0 | 12 | 0 |
| C | 0 | 12 | 0 |
| D | 0 | 12 | 0 |
| Mode M0 | |||
|---|---|---|---|
| Quadrant | BADHDUFLAG | Total packets | Discarded packets |
| A | 0 | 14863 | 3 |
| B | 0 | 16121 | 3 |
| C | 0 | 17190 | 3 |
| D | 0 | 25632 | 3 |
| Mode SS | |||
|---|---|---|---|
| Quadrant | BADHDUFLAG | Total packets | Discarded packets |
| A | 0 | 148 | 0 |
| B | 0 | 148 | 0 |
| C | 0 | 148 | 0 |
| D | 0 | 148 | 0 |
| Quadrant | Total seconds | Saturated seconds | Saturation percentage |
|---|---|---|---|
| A | 7212 | 135 | 1.871880% |
| B | 7212 | 211 | 2.925679% |
| C | 7211 | 511 | 7.086396% |
| D | 7211 | 734 | 10.178893% |
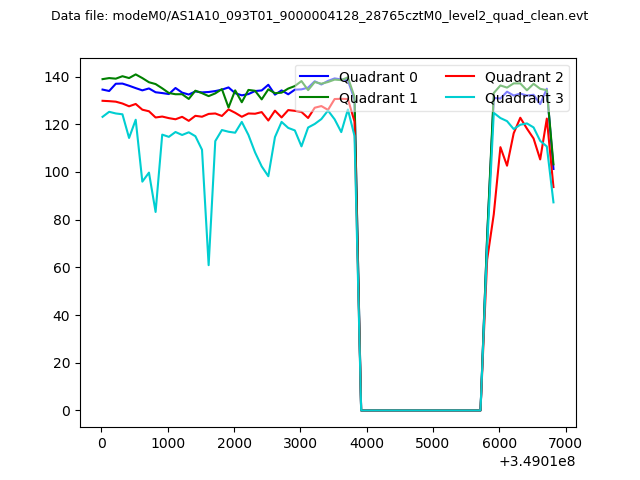
Noise dominated data is calculated using 1-second bins in cleaned event files. If a bin has >2000 counts, and if more than 50% of those come from <1% of pixels, then it is considered to be noise-dominated and hence unusable.
| Quadrant | # 1 sec bins | Bins with >0 counts | Bins with >2000 counts | High rate bins dominated by noise | Noise dominated (total time) | Noise dominated (detector-on time) | Marked lightcurve |
|---|---|---|---|---|---|---|---|
| A | 7727 | 7212 | 0 | 0 | 0.00% | 0.00% | 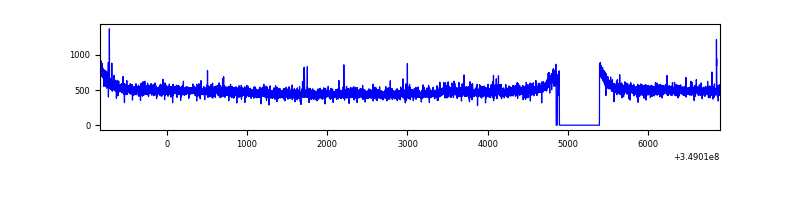 |
| B | 7727 | 7212 | 44 | 44 | 0.57% | 0.61% | 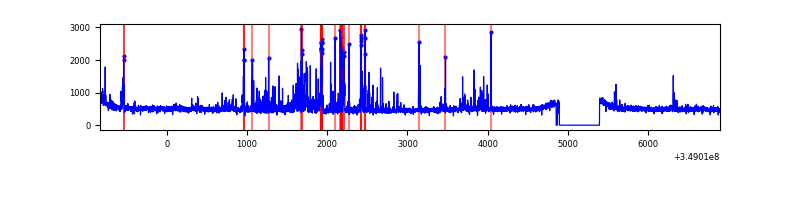 |
| C | 7726 | 7211 | 7 | 7 | 0.09% | 0.10% | 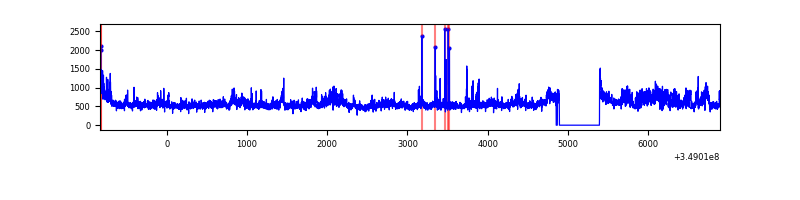 |
| D | 7726 | 7211 | 581 | 581 | 7.52% | 8.06% | 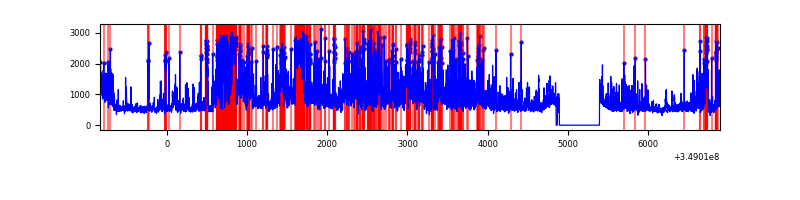 |
Top three noisy pixels from each quadrant. If the there are fewer than three noisy pixels in the level2.evt file, extra rows are filled as -1
| Pixel properties | Quadrant properties | ||||||
|---|---|---|---|---|---|---|---|
| Quadrant | DetID | PixID | Counts | Sigma | Mean | Median | Sigma |
| A | 14 | 239 | 18201 | 95.09 | 902 | 880 | 182.2 |
| A | 13 | 254 | 12815 | 65.52 | 902 | 880 | 182.2 |
| A | 15 | 174 | 9356 | 46.53 | 902 | 880 | 182.2 |
| B | 5 | 255 | 169444 | 996.99 | 889 | 866 | 169.1 |
| B | 5 | 172 | 124398 | 730.58 | 889 | 866 | 169.1 |
| B | 0 | 229 | 53084 | 308.82 | 889 | 866 | 169.1 |
| C | 3 | 233 | 586145 | 3010.99 | 834 | 836 | 194.4 |
| C | 14 | 238 | 227607 | 1166.57 | 834 | 836 | 194.4 |
| C | 14 | 254 | 132940 | 679.58 | 834 | 836 | 194.4 |
| D | 1 | 52 | 2339274 | 11774.33 | 835 | 813 | 198.6 |
| D | 8 | 195 | 1301667 | 6549.9 | 835 | 813 | 198.6 |
| D | 7 | 238 | 80590 | 401.68 | 835 | 813 | 198.6 |
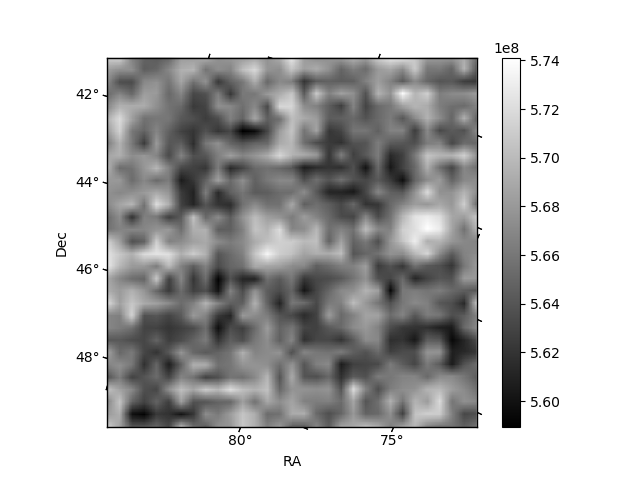
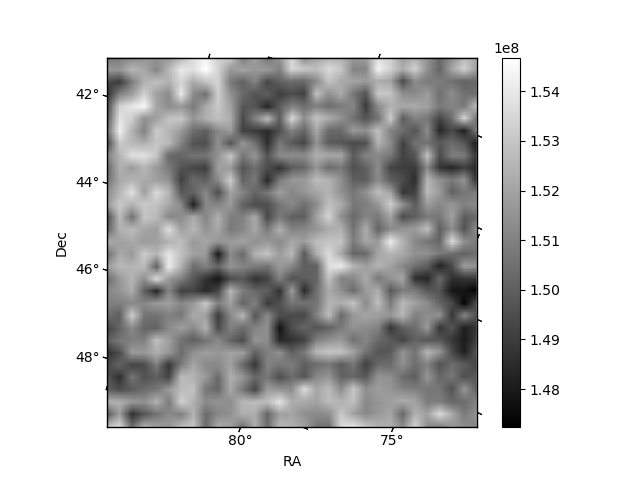
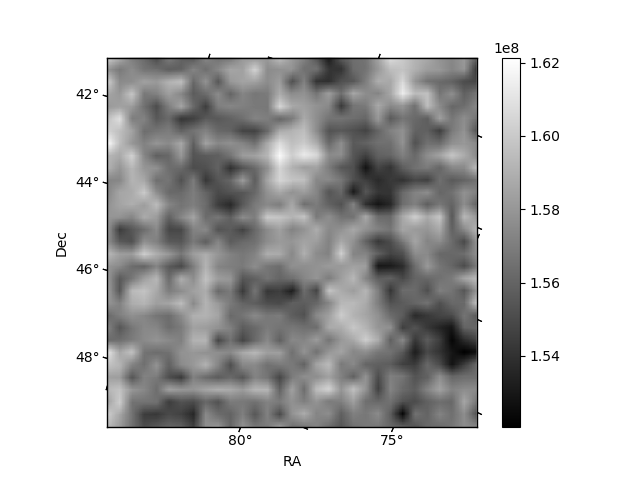
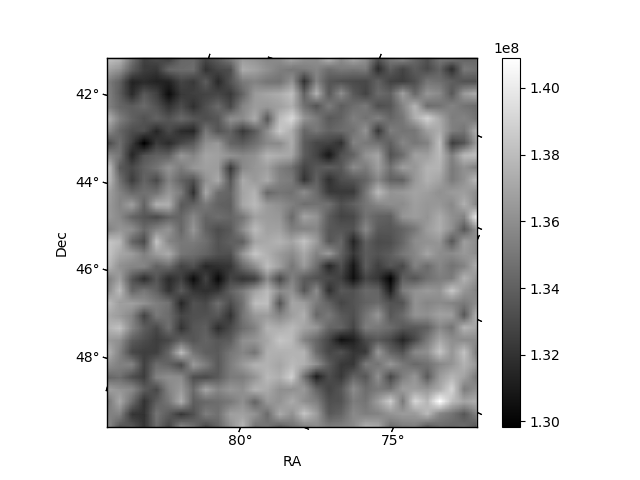
Histogram calculated using DETX and DETY for each event in the final _common_clean file
| Quadrant A | 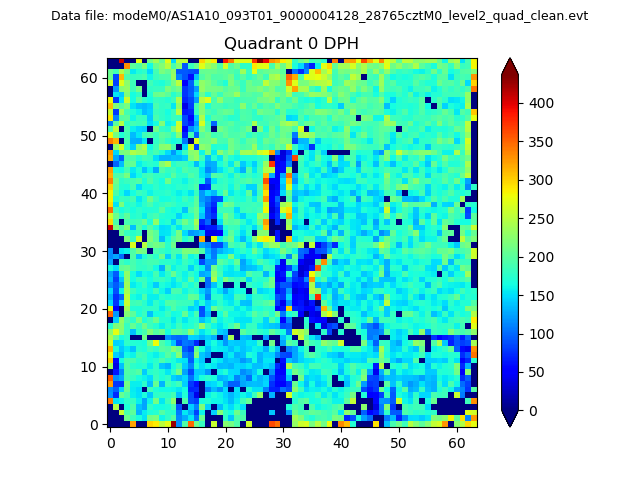 |
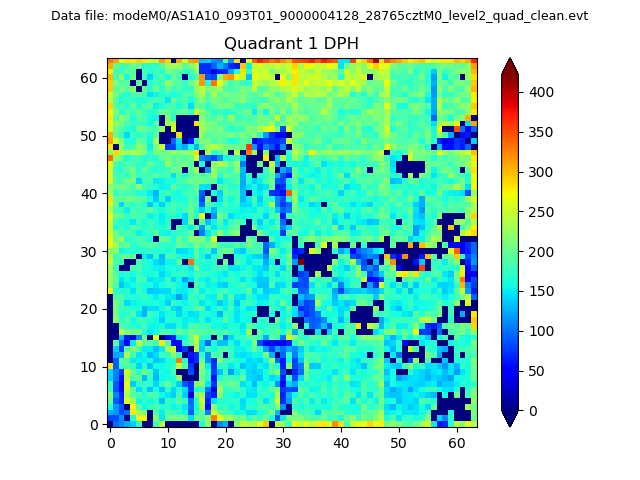 |
Quadrant B |
|---|---|---|---|
| Quadrant D | 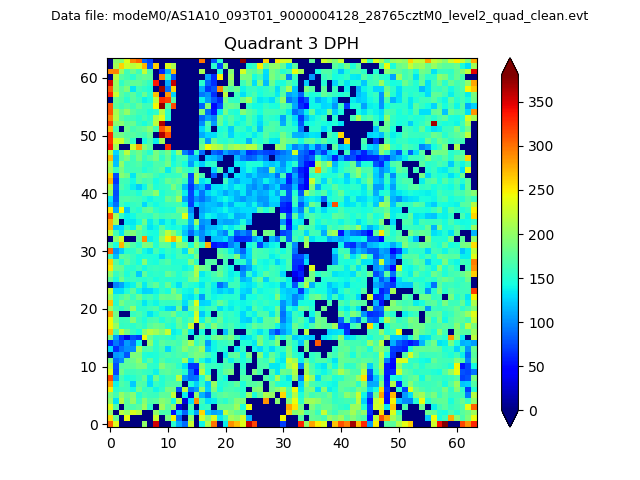 |
 |
Quadrant C |
| Plot type | Count rate plots | Images |
|---|---|---|
| Comparison with Poisson distribution Blue bars denote a histogram of data divided into 1 sec bins. Red curve is a Poisson curve with rate = median count rate of data. |
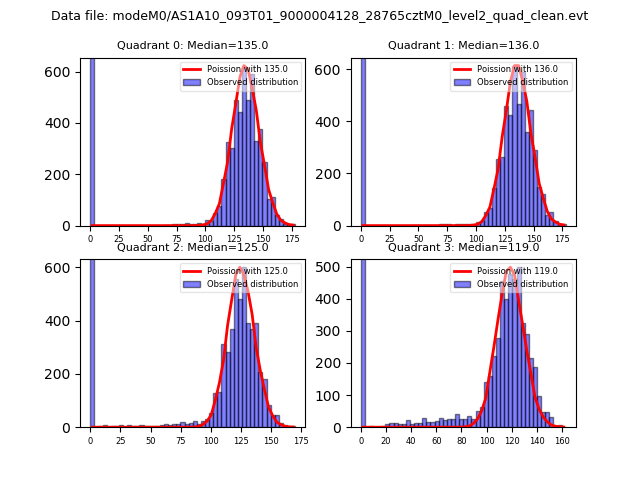 |
 |
| Quadrant-wise count rates Data is divided into 100 sec bins |
 |
|
| Module-wise count rates for Quadrant A Data is divided into 100 sec bins |
 |
 |
| Module-wise count rates for Quadrant B Data is divided into 100 sec bins |
 |
 |
| Module-wise count rates for Quadrant C Data is divided into 100 sec bins |
 |
 |
| Module-wise count rates for Quadrant D Data is divided into 100 sec bins |
 |
 |
| Parameter | Plot |
|---|---|
| CZT HV Monitor | 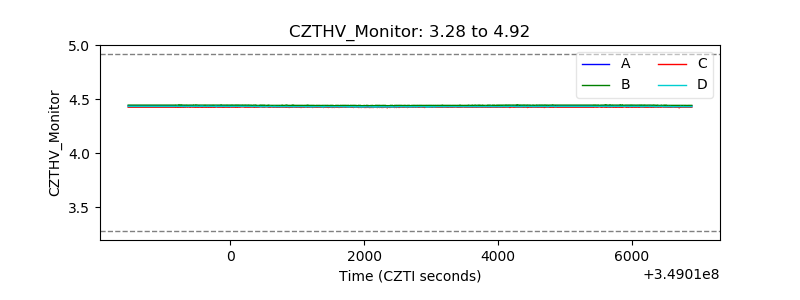 |
| D_VDD | 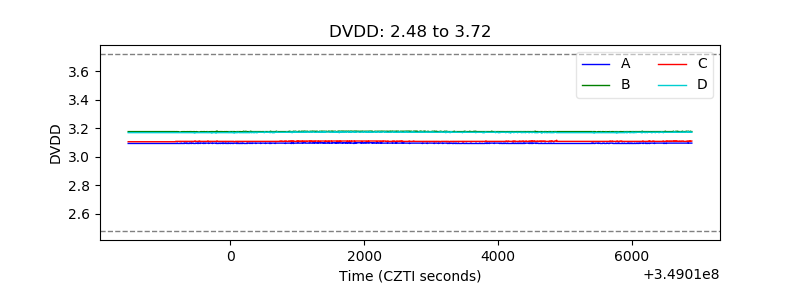 |
| Temperature 1 | 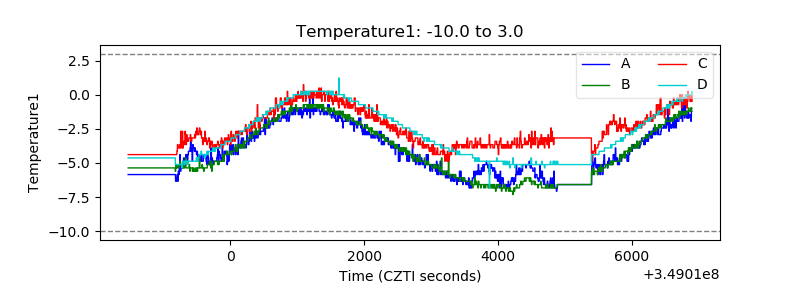 |
| Veto HV Monitor | 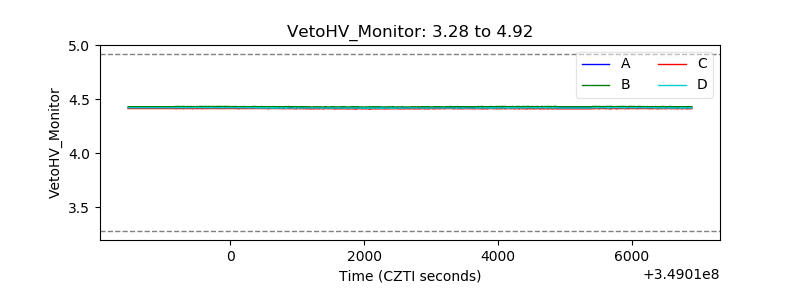 |
| Veto LLD | 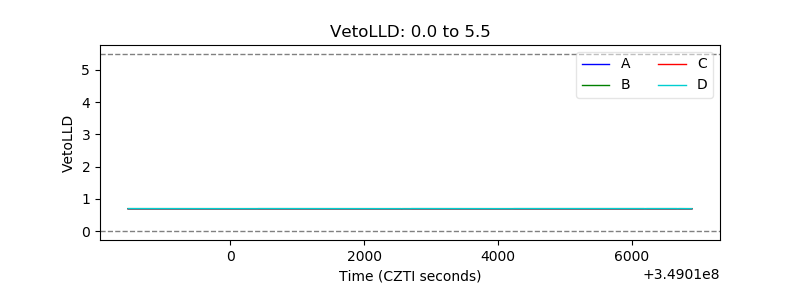 |
| Alpha Counter | 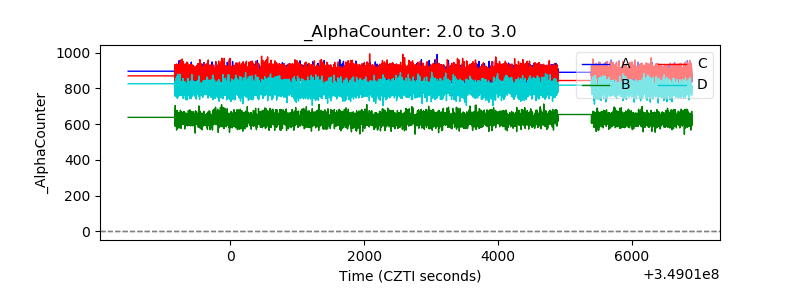 |
| _CPM_Rate | 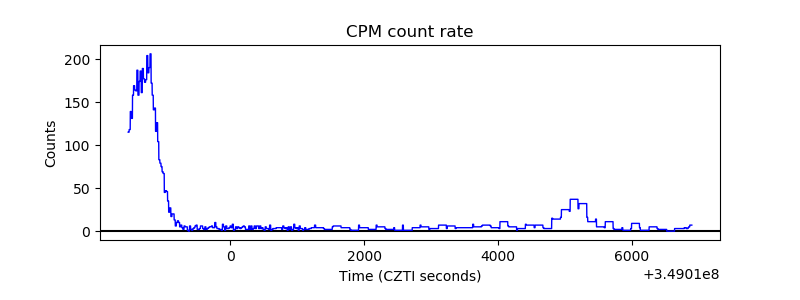 |
| CZT Counter | 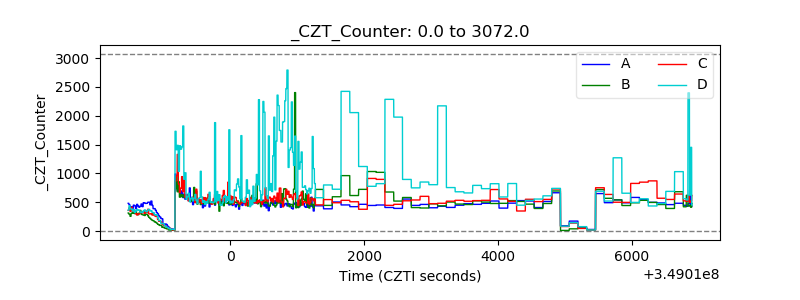 |
| +2.5 Volts monitor | 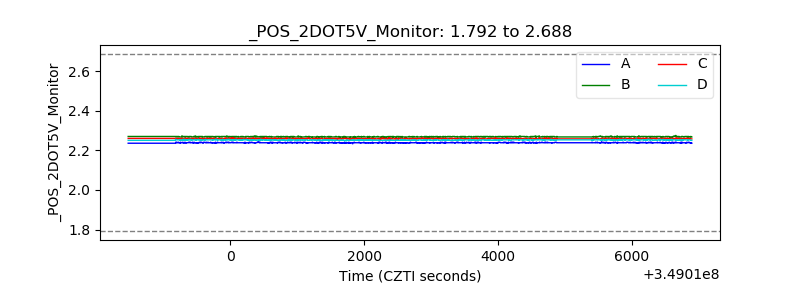 |
| +5 Volts monitor | 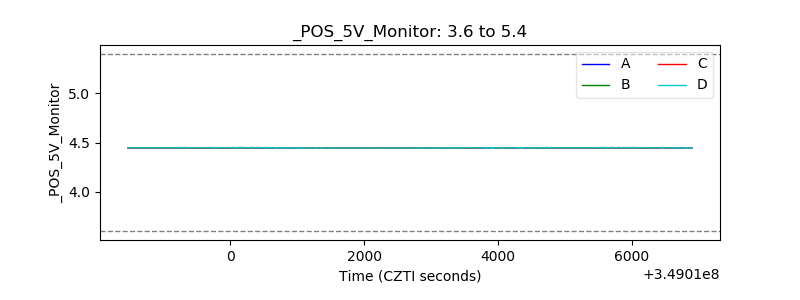 |
| _ROLL_ROT | 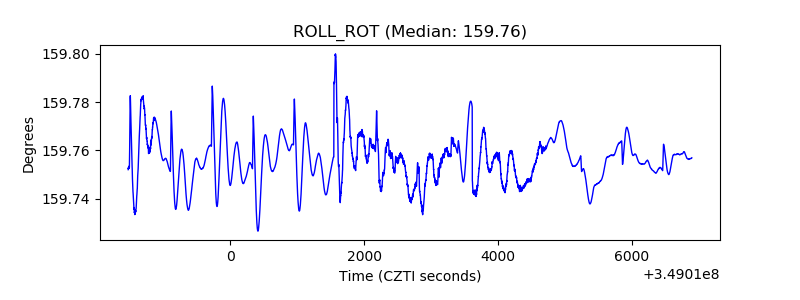 |
| _Roll_DEC | 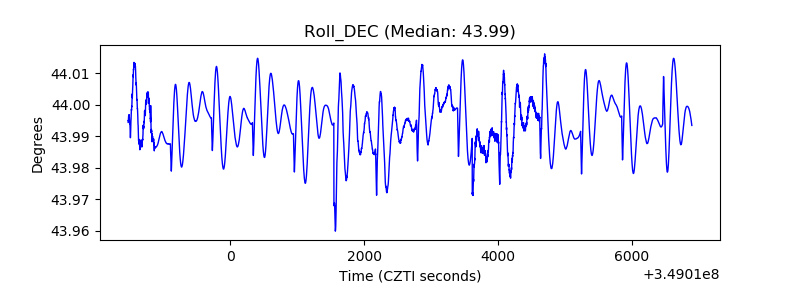 |
| _Roll_RA | 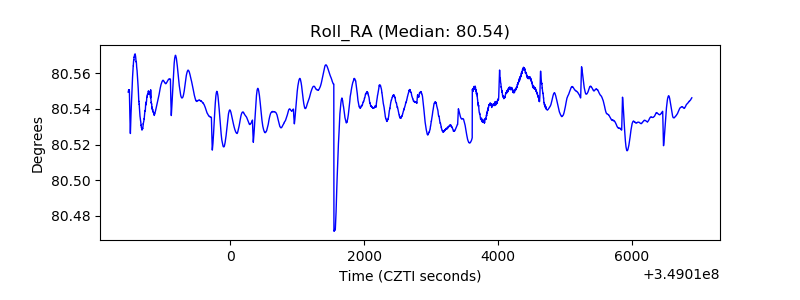 |
| Veto Counter |  |