| Param | Original file | Final file |
|---|---|---|
| Filename | modeM0/AS1A10_093T01_9000004128_28766cztM0_level2.evt | modeM0/AS1A10_093T01_9000004128_28766cztM0_level2_quad_clean.evt |
| Size (bytes) | 607,533,120 | 105,264,000 |
| Size | 579.4 MB | 100.4 MB |
| Events in quadrant A | 3,565,748 | 700,474 |
| Events in quadrant B | 3,821,329 | 710,227 |
| Events in quadrant C | 4,280,907 | 644,687 |
| Events in quadrant D | 6,236,742 | 624,476 |
| Mode M0 | |||
|---|---|---|---|
| Quadrant | BADHDUFLAG | Total packets | Discarded packets |
| A | 0 | 15241 | 1 |
| B | 0 | 15952 | 1 |
| C | 0 | 17359 | 1 |
| D | 0 | 23561 | 2 |
| Mode SS | |||
|---|---|---|---|
| Quadrant | BADHDUFLAG | Total packets | Discarded packets |
| A | 0 | 146 | 0 |
| B | 0 | 146 | 0 |
| C | 0 | 146 | 0 |
| D | 0 | 146 | 0 |
| Quadrant | Total seconds | Saturated seconds | Saturation percentage |
|---|---|---|---|
| A | 7293 | 228 | 3.126285% |
| B | 7294 | 285 | 3.907321% |
| C | 7294 | 525 | 7.197697% |
| D | 7293 | 522 | 7.157548% |
Noise dominated data is calculated using 1-second bins in cleaned event files. If a bin has >2000 counts, and if more than 50% of those come from <1% of pixels, then it is considered to be noise-dominated and hence unusable.
| Quadrant | # 1 sec bins | Bins with >0 counts | Bins with >2000 counts | High rate bins dominated by noise | Noise dominated (total time) | Noise dominated (detector-on time) | Marked lightcurve |
|---|---|---|---|---|---|---|---|
| A | 7323 | 7293 | 1 | 1 | 0.01% | 0.01% | 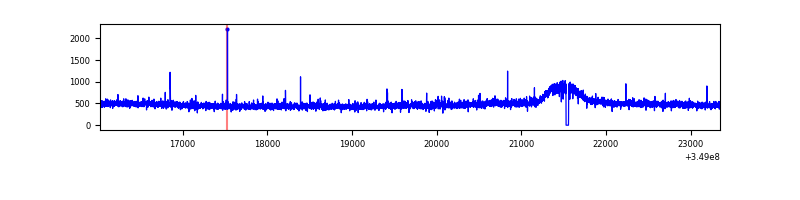 |
| B | 7324 | 7295 | 43 | 43 | 0.59% | 0.59% | 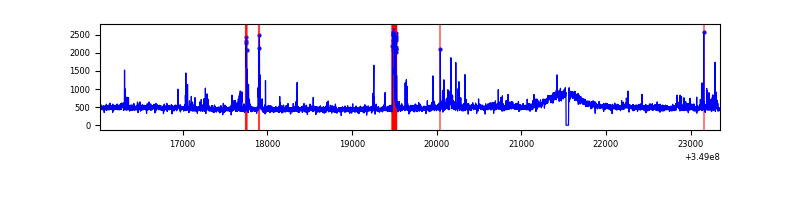 |
| C | 7324 | 7294 | 9 | 9 | 0.12% | 0.12% | 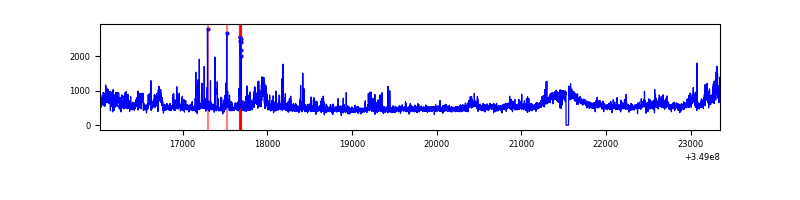 |
| D | 7323 | 7293 | 360 | 360 | 4.92% | 4.94% | 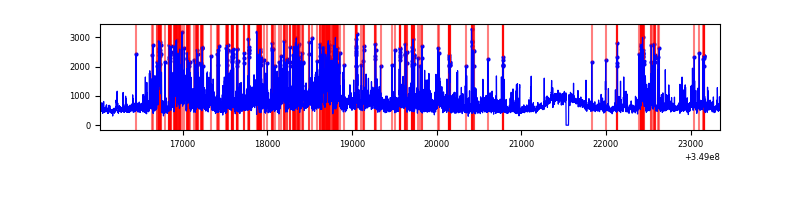 |
Top three noisy pixels from each quadrant. If the there are fewer than three noisy pixels in the level2.evt file, extra rows are filled as -1
| Pixel properties | Quadrant properties | ||||||
|---|---|---|---|---|---|---|---|
| Quadrant | DetID | PixID | Counts | Sigma | Mean | Median | Sigma |
| A | 14 | 239 | 29436 | 153.9 | 912 | 891 | 185.5 |
| A | 13 | 254 | 12761 | 64.0 | 912 | 891 | 185.5 |
| A | 3 | 137 | 8869 | 43.01 | 912 | 891 | 185.5 |
| B | 4 | 80 | 196844 | 1128.37 | 899 | 876 | 173.7 |
| B | 5 | 172 | 48058 | 271.67 | 899 | 876 | 173.7 |
| B | 0 | 229 | 24710 | 137.23 | 899 | 876 | 173.7 |
| C | 3 | 233 | 495484 | 2461.35 | 854 | 859 | 201.0 |
| C | 14 | 238 | 224032 | 1110.55 | 854 | 859 | 201.0 |
| C | 14 | 254 | 125788 | 621.67 | 854 | 859 | 201.0 |
| D | 8 | 195 | 1441272 | 6856.44 | 872 | 845 | 210.1 |
| D | 1 | 52 | 1224965 | 5826.81 | 872 | 845 | 210.1 |
| D | 12 | 233 | 166311 | 787.62 | 872 | 845 | 210.1 |
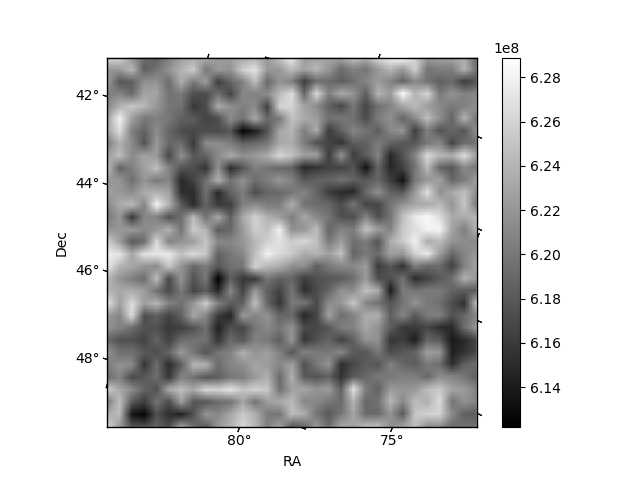
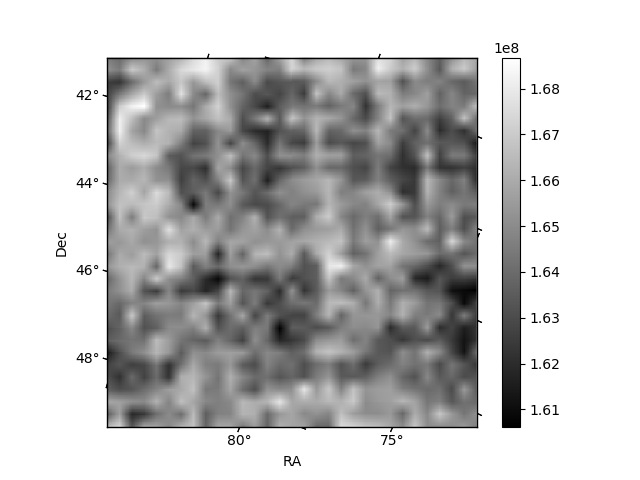
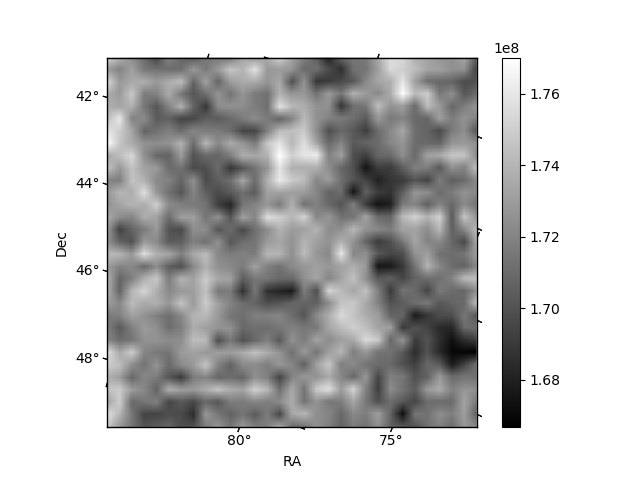
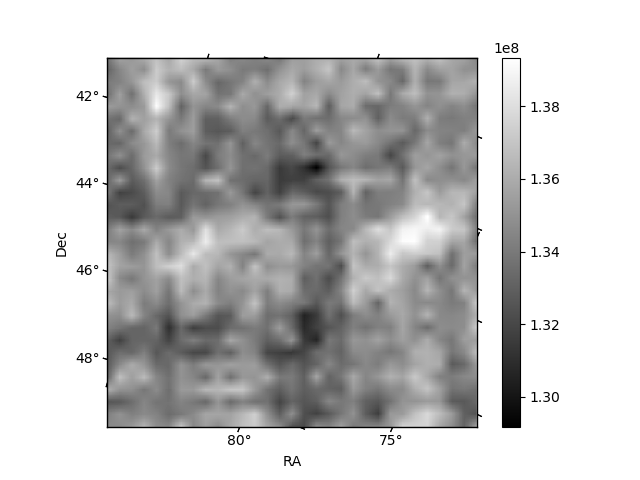
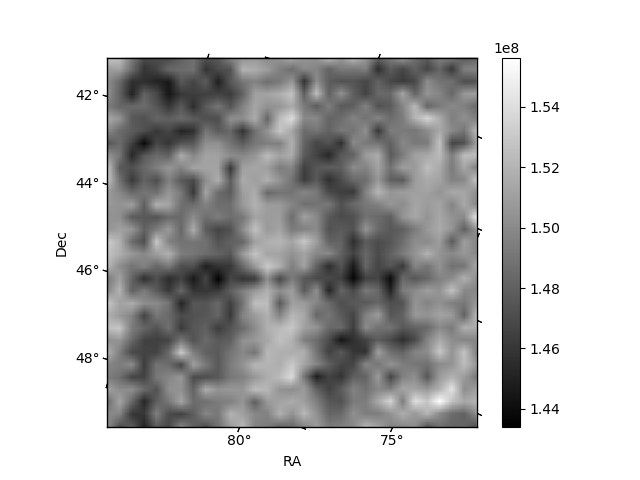
Histogram calculated using DETX and DETY for each event in the final _common_clean file
| Quadrant A | 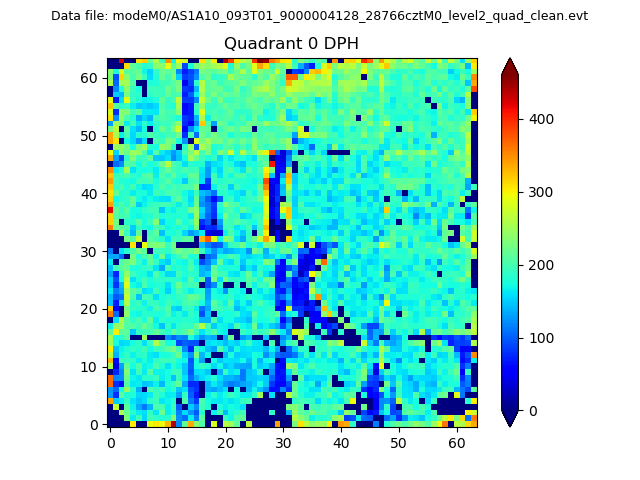 |
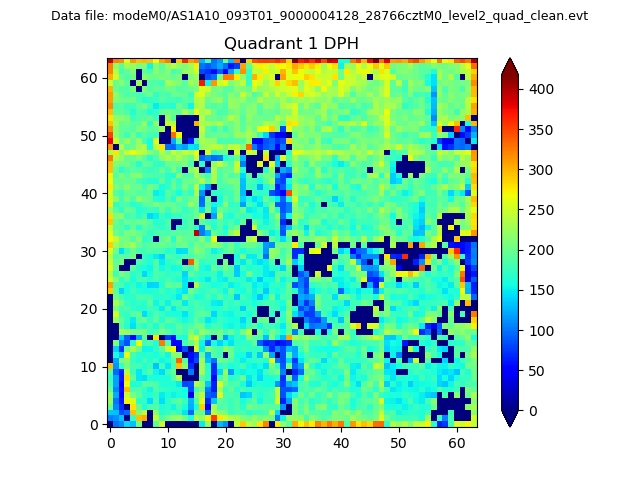 |
Quadrant B |
|---|---|---|---|
| Quadrant D | 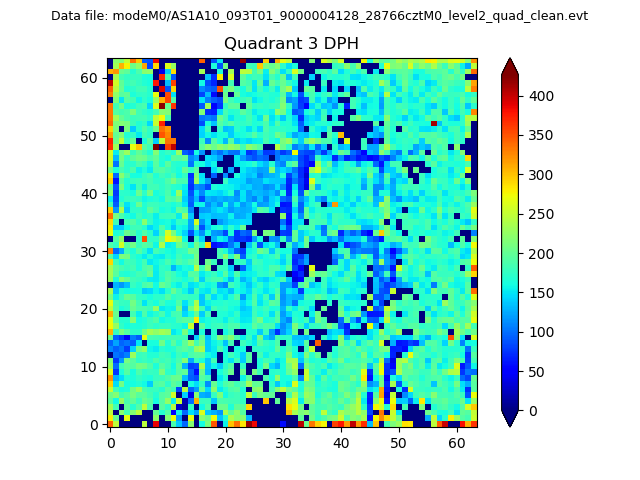 |
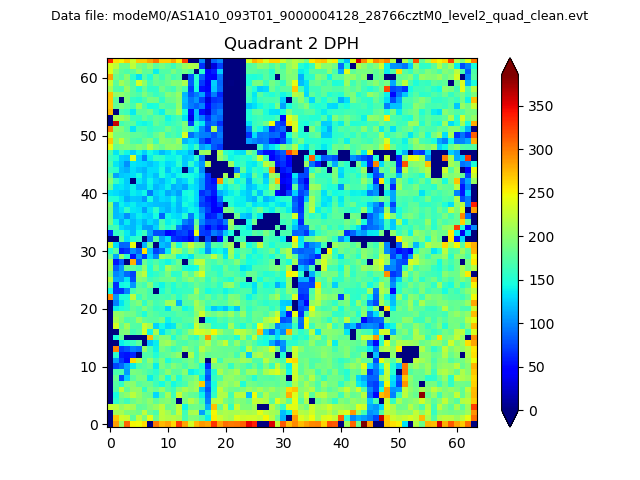 |
Quadrant C |
| Plot type | Count rate plots | Images |
|---|---|---|
| Comparison with Poisson distribution Blue bars denote a histogram of data divided into 1 sec bins. Red curve is a Poisson curve with rate = median count rate of data. |
 |
 |
| Quadrant-wise count rates Data is divided into 100 sec bins |
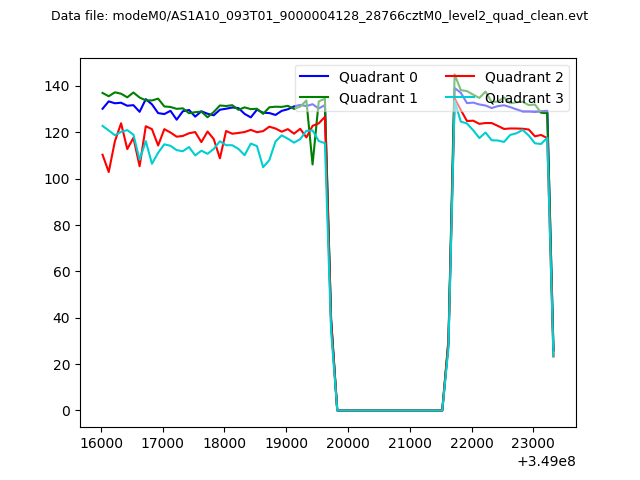 |
|
| Module-wise count rates for Quadrant A Data is divided into 100 sec bins |
 |
 |
| Module-wise count rates for Quadrant B Data is divided into 100 sec bins |
 |
 |
| Module-wise count rates for Quadrant C Data is divided into 100 sec bins |
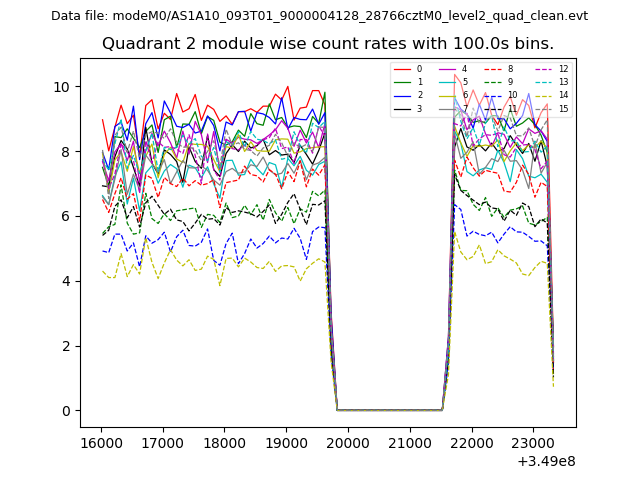 |
 |
| Module-wise count rates for Quadrant D Data is divided into 100 sec bins |
 |
 |
| Parameter | Plot |
|---|---|
| CZT HV Monitor | 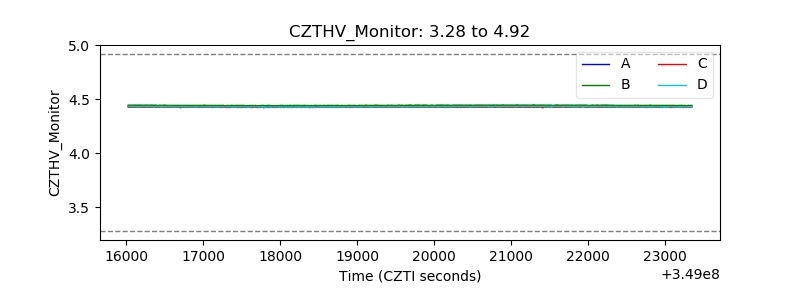 |
| D_VDD | 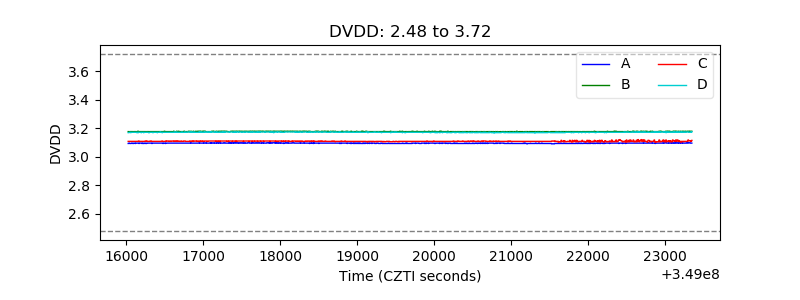 |
| Temperature 1 | 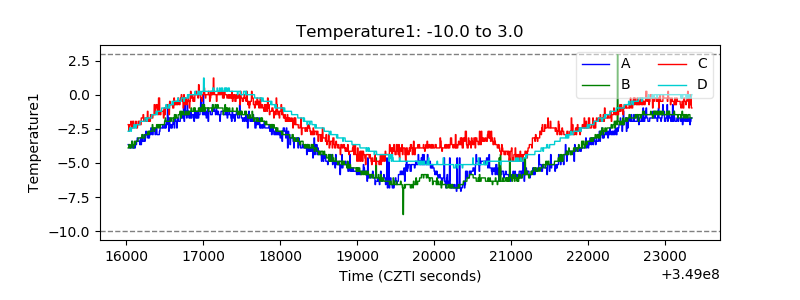 |
| Veto HV Monitor | 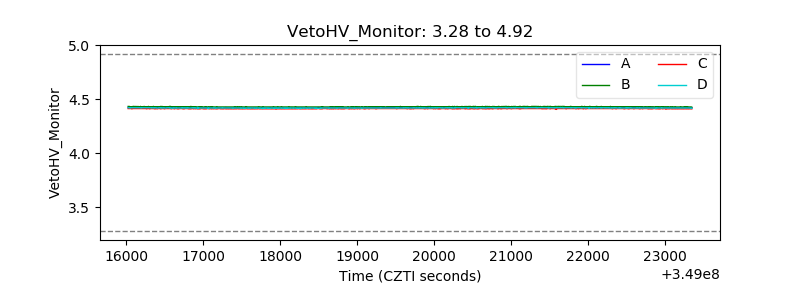 |
| Veto LLD | 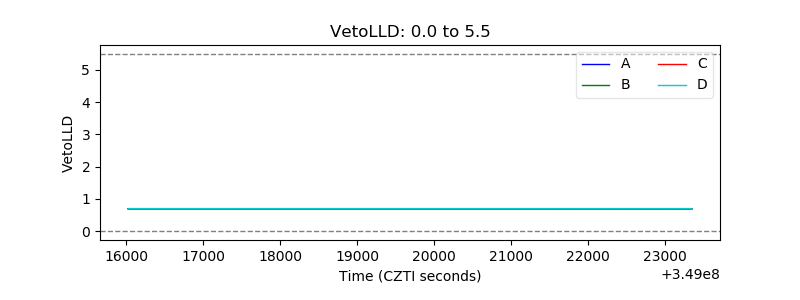 |
| Alpha Counter | 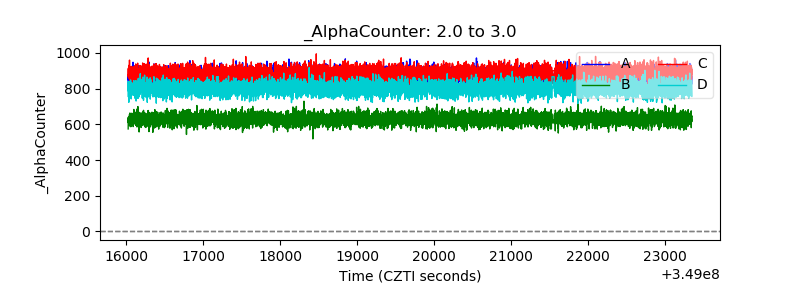 |
| _CPM_Rate | 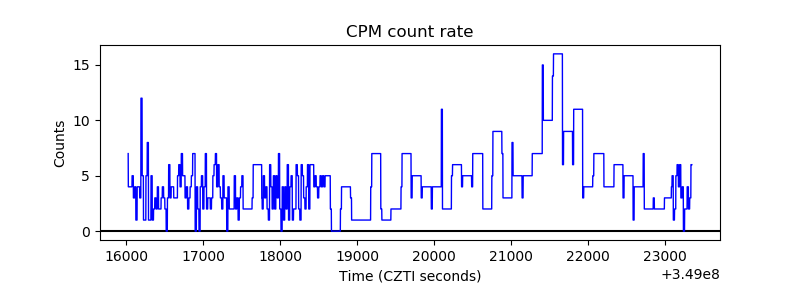 |
| CZT Counter | 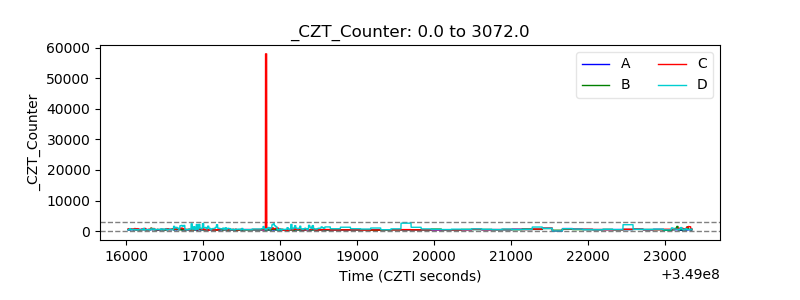 |
| +2.5 Volts monitor | 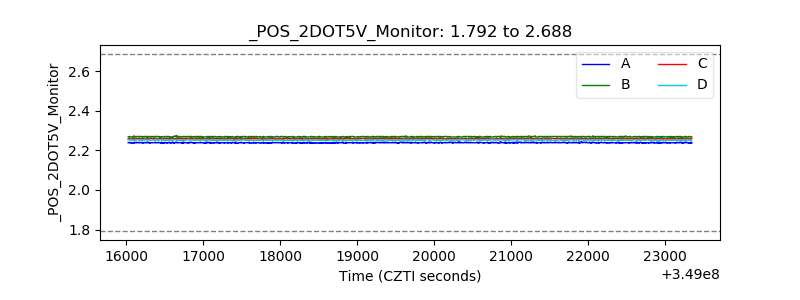 |
| +5 Volts monitor | 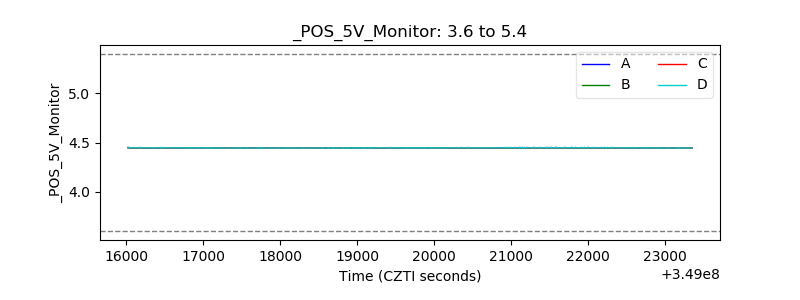 |
| _ROLL_ROT | 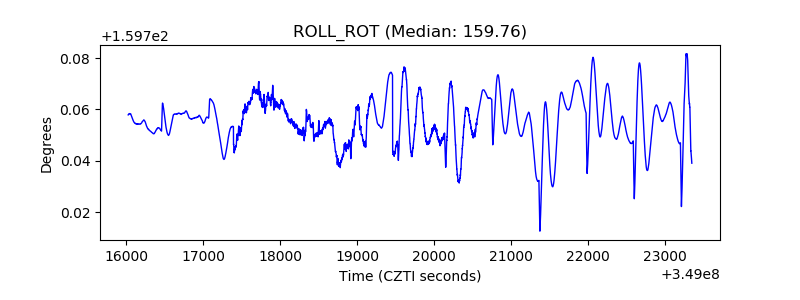 |
| _Roll_DEC | 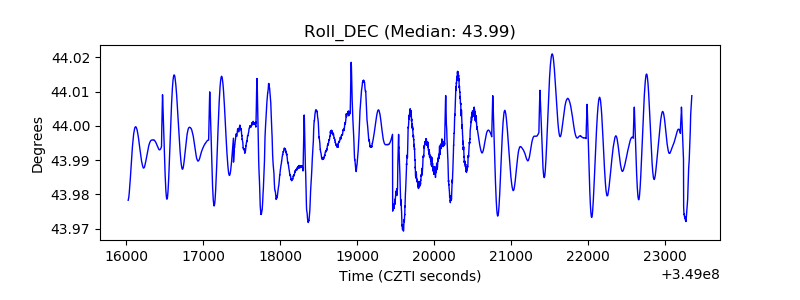 |
| _Roll_RA | 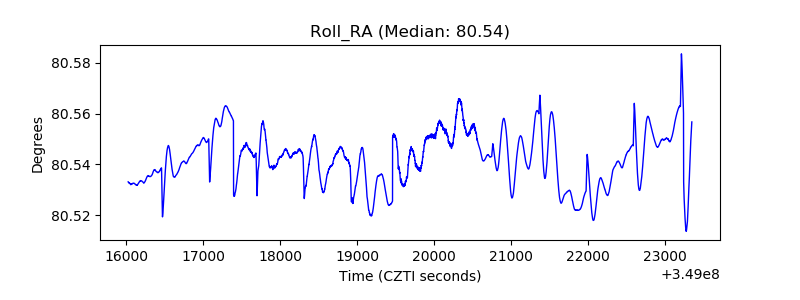 |
| Veto Counter | 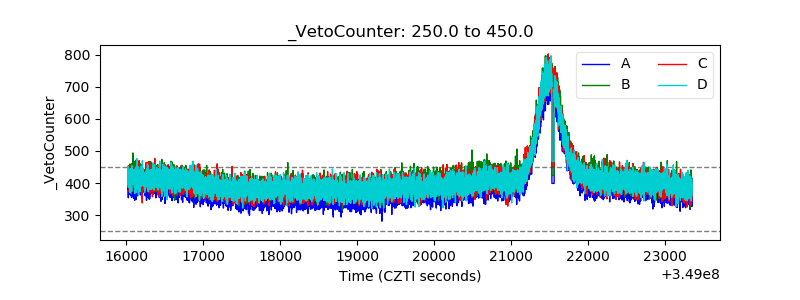 |