| Param | Original file | Final file |
|---|---|---|
| Filename | modeM0/AS1A10_093T01_9000004128_28767cztM0_level2.evt | modeM0/AS1A10_093T01_9000004128_28767cztM0_level2_quad_clean.evt |
| Size (bytes) | 242,213,760 | 55,863,360 |
| Size | 231.0 MB | 53.3 MB |
| Events in quadrant A | 1,369,418 | 384,495 |
| Events in quadrant B | 1,530,698 | 388,899 |
| Events in quadrant C | 2,030,985 | 357,093 |
| Events in quadrant D | 2,200,395 | 348,640 |
| Mode M0 | |||
|---|---|---|---|
| Quadrant | BADHDUFLAG | Total packets | Discarded packets |
| A | 0 | 6026 | 0 |
| B | 0 | 6473 | 0 |
| C | 0 | 8058 | 0 |
| D | 0 | 8561 | 0 |
| Mode SS | |||
|---|---|---|---|
| Quadrant | BADHDUFLAG | Total packets | Discarded packets |
| A | 0 | 60 | 0 |
| B | 0 | 60 | 0 |
| C | 0 | 60 | 0 |
| D | 0 | 60 | 0 |
| Quadrant | Total seconds | Saturated seconds | Saturation percentage |
|---|---|---|---|
| A | 2978 | 6 | 0.201478% |
| B | 2979 | 33 | 1.107754% |
| C | 2979 | 34 | 1.141323% |
| D | 2979 | 67 | 2.249077% |
Noise dominated data is calculated using 1-second bins in cleaned event files. If a bin has >2000 counts, and if more than 50% of those come from <1% of pixels, then it is considered to be noise-dominated and hence unusable.
| Quadrant | # 1 sec bins | Bins with >0 counts | Bins with >2000 counts | High rate bins dominated by noise | Noise dominated (total time) | Noise dominated (detector-on time) | Marked lightcurve |
|---|---|---|---|---|---|---|---|
| A | 2978 | 2978 | 0 | 0 | 0.00% | 0.00% | 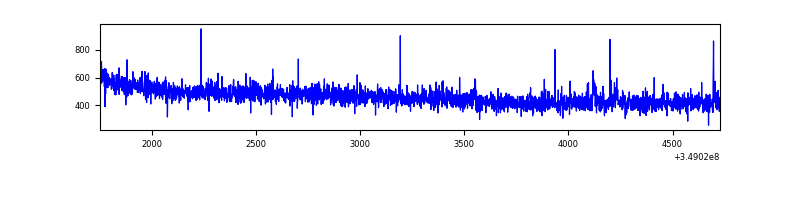 |
| B | 2979 | 2979 | 16 | 16 | 0.54% | 0.54% | 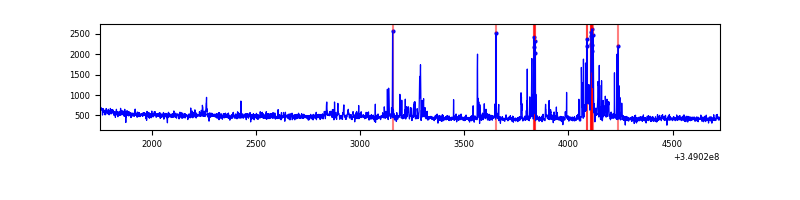 |
| C | 2979 | 2979 | 0 | 0 | 0.00% | 0.00% | 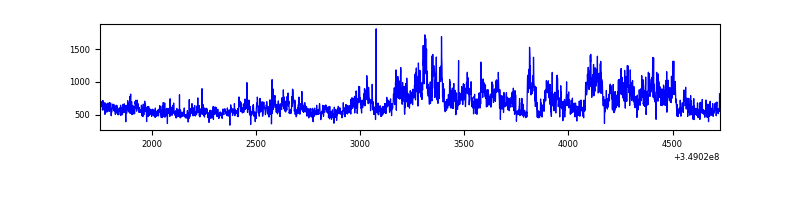 |
| D | 2979 | 2979 | 77 | 77 | 2.58% | 2.58% | 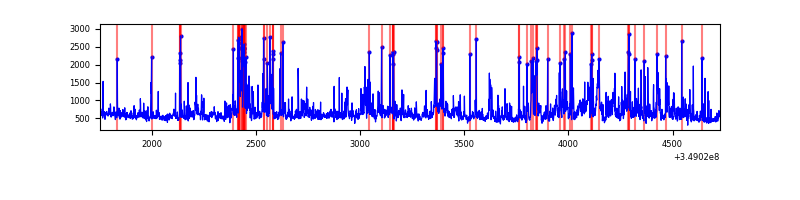 |
Top three noisy pixels from each quadrant. If the there are fewer than three noisy pixels in the level2.evt file, extra rows are filled as -1
| Pixel properties | Quadrant properties | ||||||
|---|---|---|---|---|---|---|---|
| Quadrant | DetID | PixID | Counts | Sigma | Mean | Median | Sigma |
| A | 13 | 254 | 5448 | 70.2 | 352 | 344 | 72.7 |
| A | 14 | 239 | 4489 | 57.01 | 352 | 344 | 72.7 |
| A | 15 | 174 | 3629 | 45.18 | 352 | 344 | 72.7 |
| B | 4 | 80 | 160354 | 2352.97 | 346 | 337 | 68.0 |
| B | 12 | 111 | 7898 | 111.18 | 346 | 337 | 68.0 |
| B | 11 | 111 | 7252 | 101.68 | 346 | 337 | 68.0 |
| C | 3 | 233 | 672049 | 8517.1 | 331 | 333 | 78.9 |
| C | 14 | 238 | 54111 | 681.88 | 331 | 333 | 78.9 |
| C | 8 | 128 | 4630 | 54.48 | 331 | 333 | 78.9 |
| D | 8 | 195 | 390212 | 4755.77 | 336 | 326 | 82.0 |
| D | 1 | 52 | 238966 | 2910.89 | 336 | 326 | 82.0 |
| D | 12 | 233 | 135389 | 1647.48 | 336 | 326 | 82.0 |
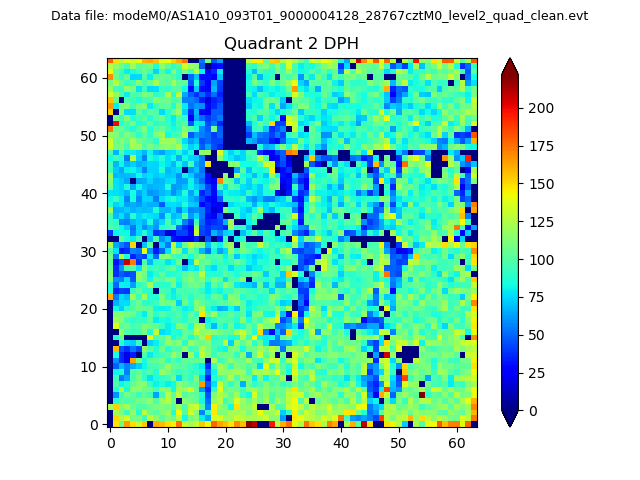
Histogram calculated using DETX and DETY for each event in the final _common_clean file
| Quadrant A | 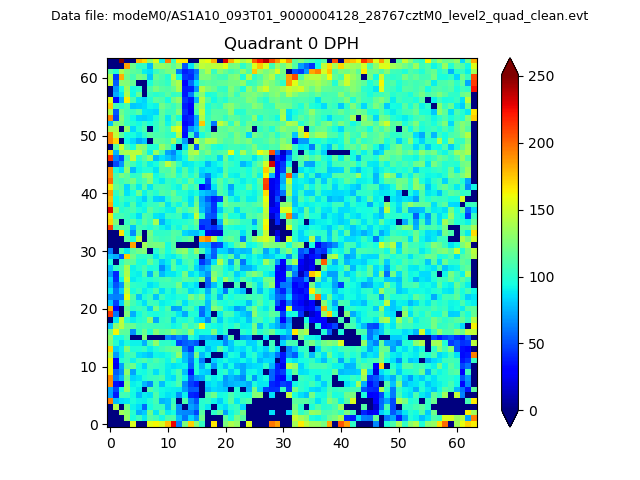 |
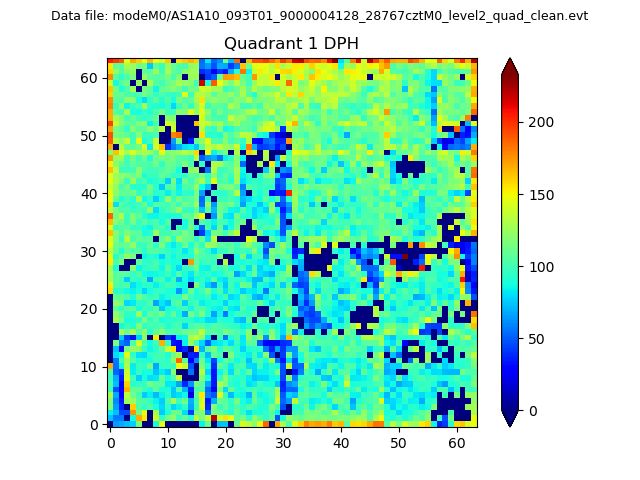 |
Quadrant B |
|---|---|---|---|
| Quadrant D | 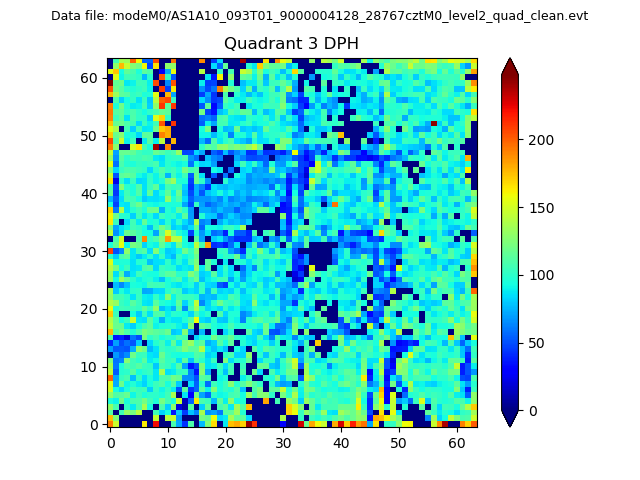 |
 |
Quadrant C |
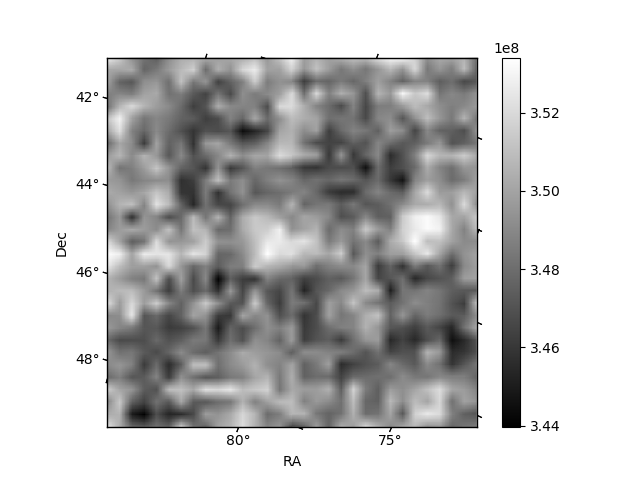
| Plot type | Count rate plots | Images |
|---|---|---|
| Comparison with Poisson distribution Blue bars denote a histogram of data divided into 1 sec bins. Red curve is a Poisson curve with rate = median count rate of data. |
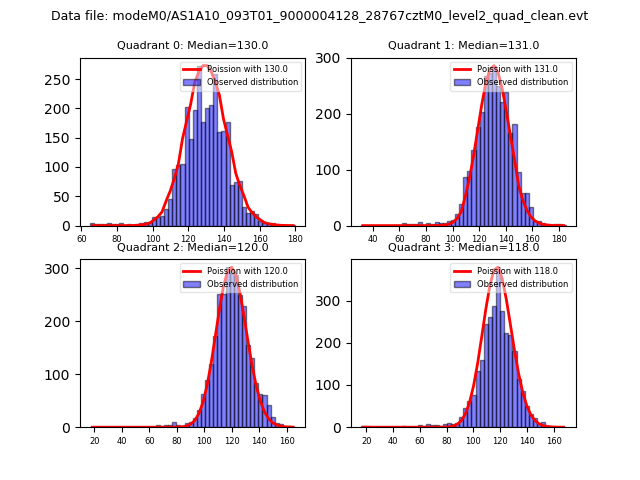 |
 |
| Quadrant-wise count rates Data is divided into 100 sec bins |
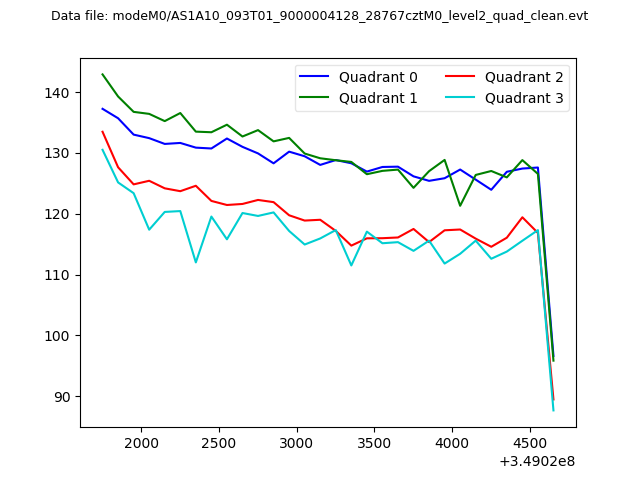 |
|
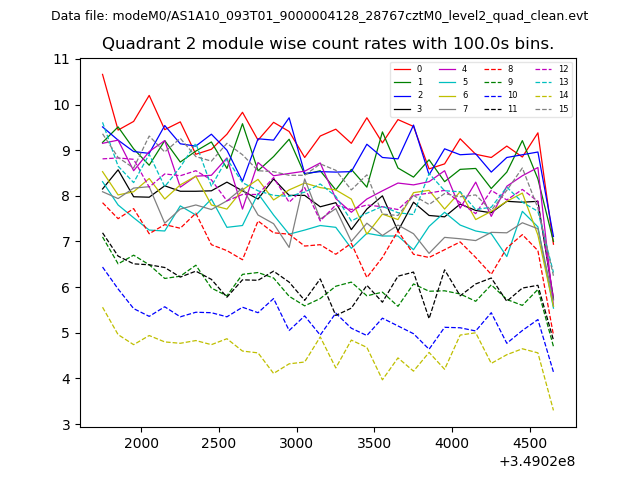
| Module-wise count rates for Quadrant A Data is divided into 100 sec bins |
 |
 |
| Module-wise count rates for Quadrant B Data is divided into 100 sec bins |
 |
 |
| Module-wise count rates for Quadrant C Data is divided into 100 sec bins |
 |
 |
| Module-wise count rates for Quadrant D Data is divided into 100 sec bins |
 |
 |
| Parameter | Plot |
|---|---|
| CZT HV Monitor | 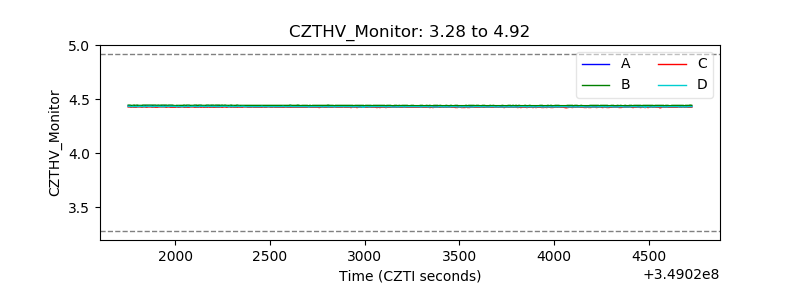 |
| D_VDD | 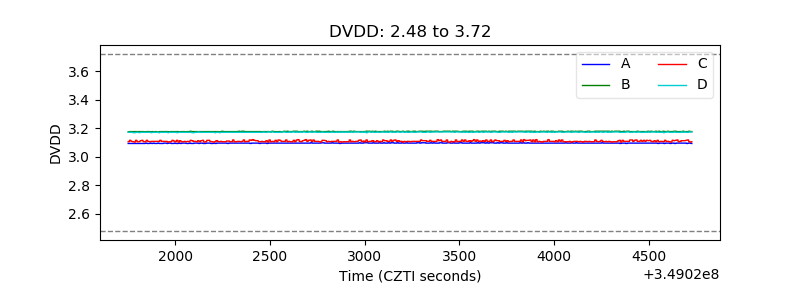 |
| Temperature 1 | 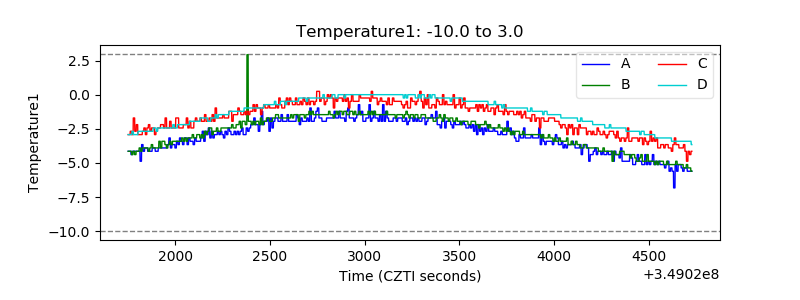 |
| Veto HV Monitor | 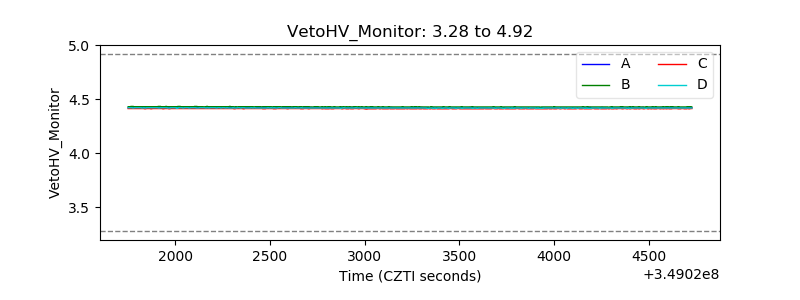 |
| Veto LLD | 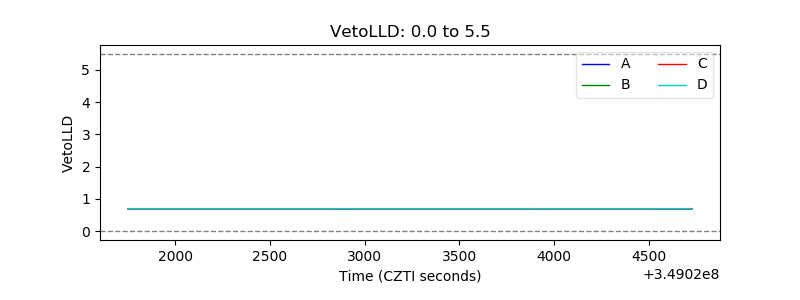 |
| Alpha Counter | 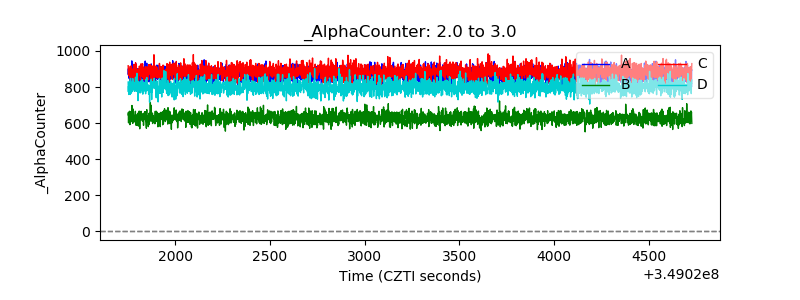 |
| _CPM_Rate | 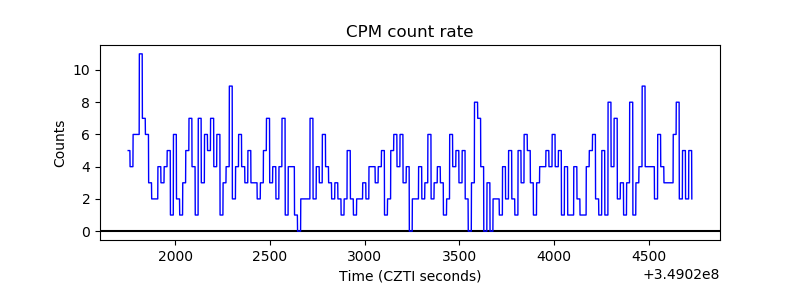 |
| CZT Counter | 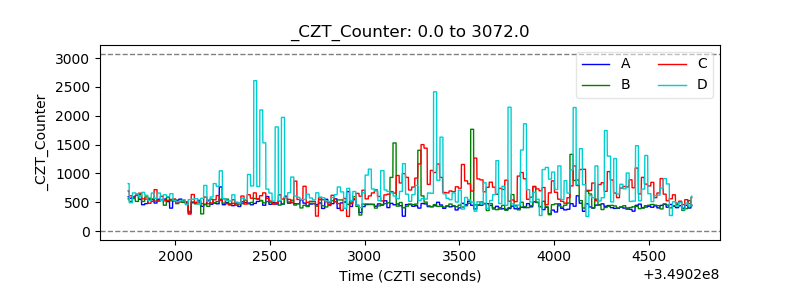 |
| +2.5 Volts monitor | 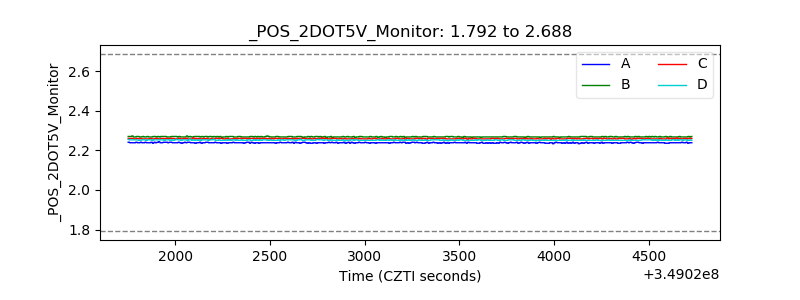 |
| +5 Volts monitor | 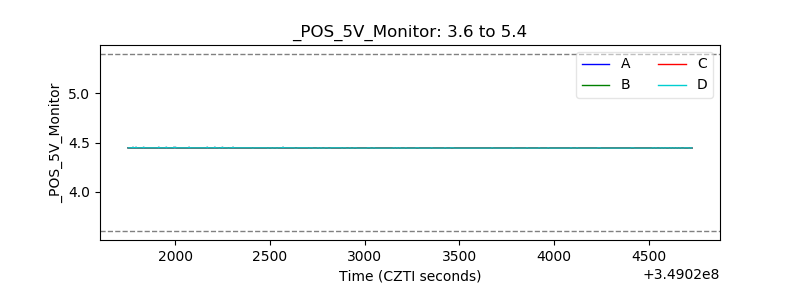 |
| _ROLL_ROT |  |
| _Roll_DEC | 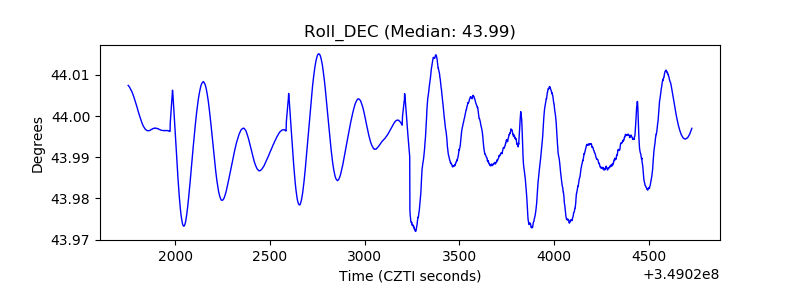 |
| _Roll_RA | 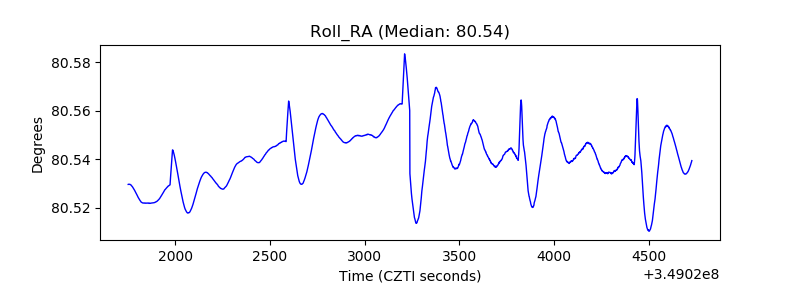 |
| Veto Counter | 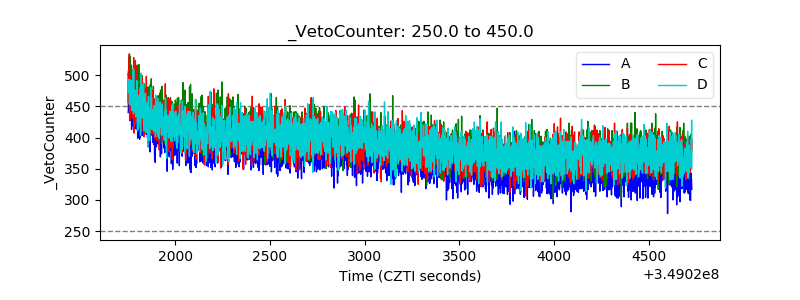 |