| Param | Original file | Final file |
|---|---|---|
| Filename | modeM0/AS1C05_019T04_9000004130cztM0_level2.fits | modeM0/AS1C05_019T04_9000004130cztM0_level2_quad_clean.evt |
| Size (bytes) | 585,803,520 | 591,946,560 |
| Size | 558.7 MB | 564.5 MB |
| Events in quadrant A | 3,680,788 | 3,678,428 |
| Events in quadrant B | 3,505,358 | 3,687,831 |
| Events in quadrant C | 3,460,054 | 3,438,518 |
| Events in quadrant D | 2,991,062 | 3,020,021 |
| Mode SS | |||
|---|---|---|---|
| Quadrant | BADHDUFLAG | Total packets | Discarded packets |
| A | 0 | 1218 | 0 |
| B | 0 | 1222 | 0 |
| C | 0 | 1228 | 0 |
| D | 0 | 1213 | 0 |
| Mode M9 | |||
|---|---|---|---|
| Quadrant | BADHDUFLAG | Total packets | Discarded packets |
| A | 0 | 111 | 0 |
| B | 0 | 111 | 0 |
| C | 0 | 111 | 0 |
| D | 0 | 111 | 0 |
| Mode M0 | |||
|---|---|---|---|
| Quadrant | BADHDUFLAG | Total packets | Discarded packets |
| A | 0 | 123173 | 0 |
| B | 0 | 127636 | 0 |
| C | 0 | 158005 | 0 |
| D | 0 | 189591 | 0 |
| Quadrant | Total seconds | Saturated seconds | Saturation percentage |
|---|---|---|---|
| A | 59826 | 390 | 0.651890% |
| B | 59805 | 914 | 1.528300% |
| C | 59796 | 2244 | 3.752759% |
| D | 59728 | 4597 | 7.696558% |
Noise dominated data is calculated using 1-second bins in cleaned event files. If a bin has >2000 counts, and if more than 50% of those come from <1% of pixels, then it is considered to be noise-dominated and hence unusable.
| Quadrant | # 1 sec bins | Bins with >0 counts | Bins with >2000 counts | High rate bins dominated by noise | Noise dominated (total time) | Noise dominated (detector-on time) | Marked lightcurve |
|---|---|---|---|---|---|---|---|
| A | 66551 | 57173 | 0 | 0 | 0.00% | 0.00% | 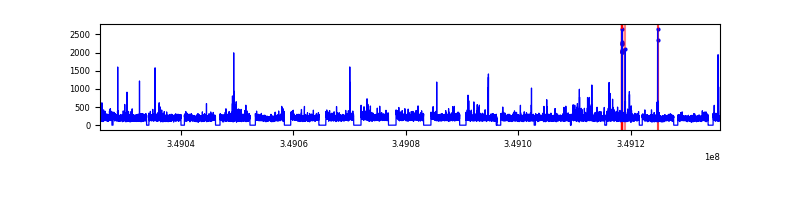 |
| B | 66551 | 57166 | 0 | 0 | 0.00% | 0.00% | 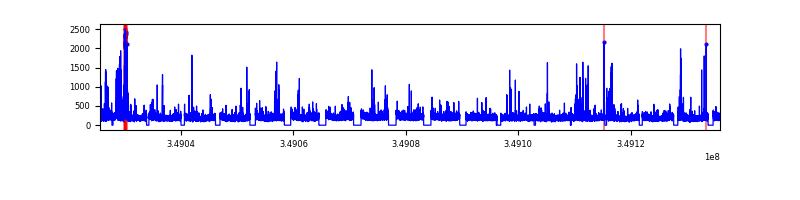 |
| C | 66551 | 57156 | 0 | 0 | 0.00% | 0.00% | 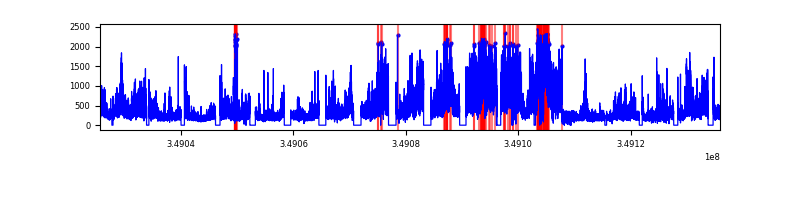 |
| D | 66551 | 57109 | 0 | 0 | 0.00% | 0.00% | 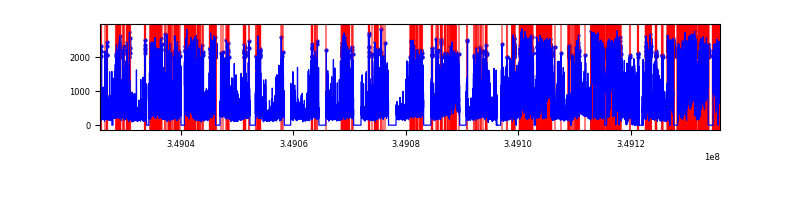 |
Top three noisy pixels from each quadrant. If the there are fewer than three noisy pixels in the level2.evt file, extra rows are filled as -1
| Pixel properties | Quadrant properties | ||||||
|---|---|---|---|---|---|---|---|
| Quadrant | DetID | PixID | Counts | Sigma | Mean | Median | Sigma |
| A | 0 | 29 | 3615 | 11.57 | 960 | 907 | 234.1 |
| A | 7 | 110 | 2859 | 8.34 | 960 | 907 | 234.1 |
| A | 0 | 30 | 2844 | 8.27 | 960 | 907 | 234.1 |
| B | 2 | 9 | 2826 | 10.81 | 928 | 889 | 179.2 |
| B | 2 | 8 | 2319 | 7.98 | 928 | 889 | 179.2 |
| B | 5 | 128 | 2305 | 7.9 | 928 | 889 | 179.2 |
| C | 12 | 241 | 2472 | 6.93 | 916 | 864 | 231.9 |
| C | 3 | 187 | 2380 | 6.54 | 916 | 864 | 231.9 |
| C | 9 | 209 | 2362 | 6.46 | 916 | 864 | 231.9 |
| D | 15 | 46 | 2213 | 6.31 | 853 | 780 | 227.0 |
| D | 3 | 14 | 2192 | 6.22 | 853 | 780 | 227.0 |
| D | 6 | 67 | 2105 | 5.84 | 853 | 780 | 227.0 |
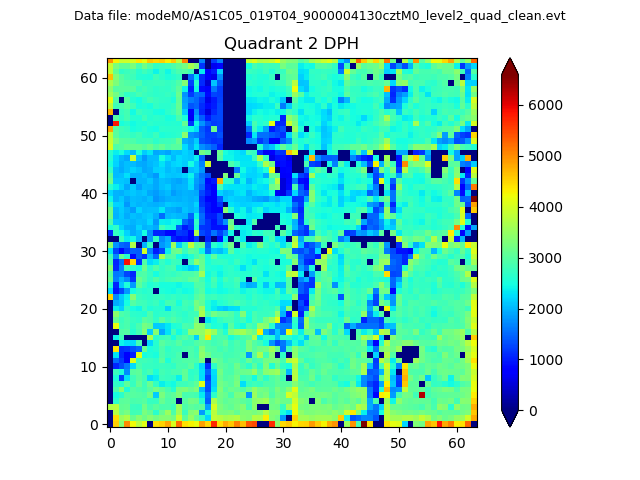
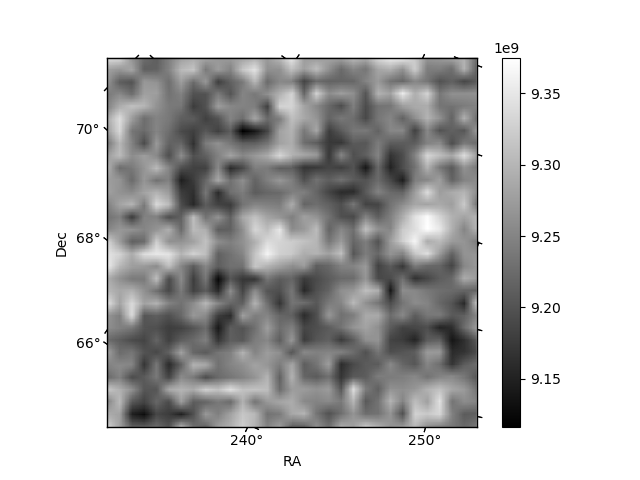
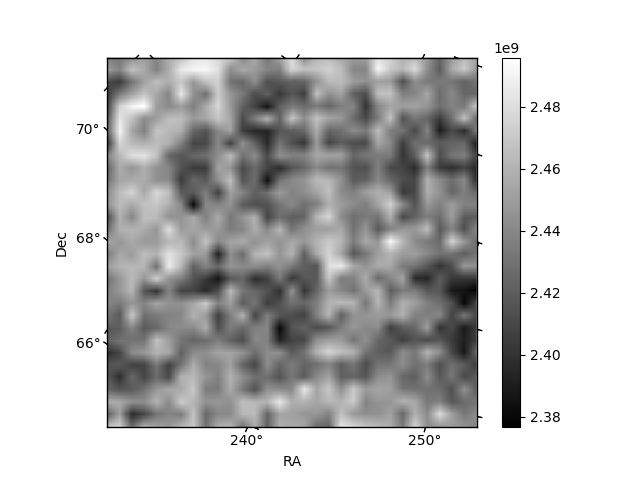
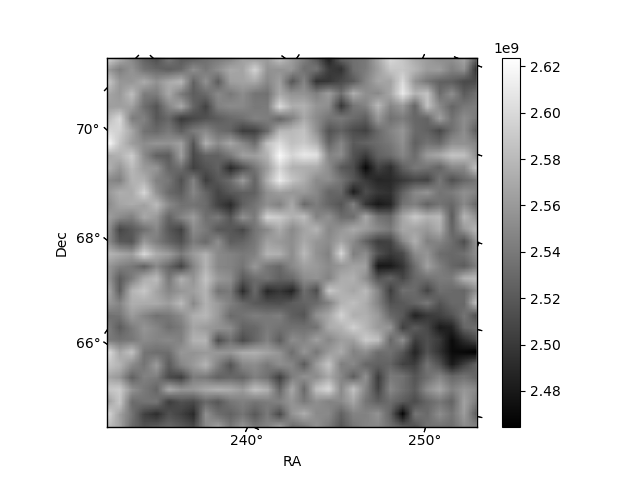
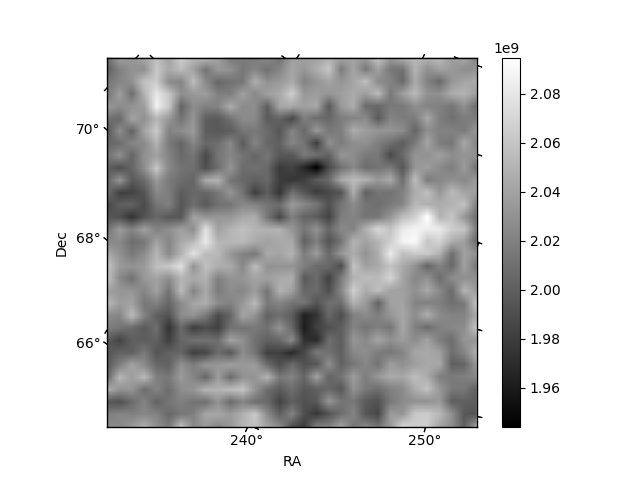
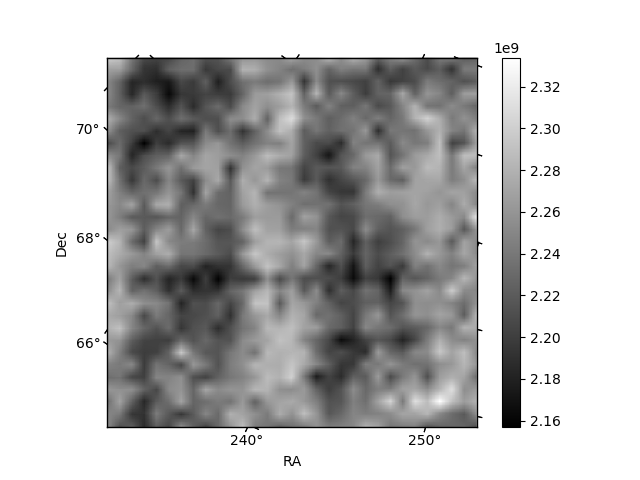
Histogram calculated using DETX and DETY for each event in the final _common_clean file
| Quadrant A | 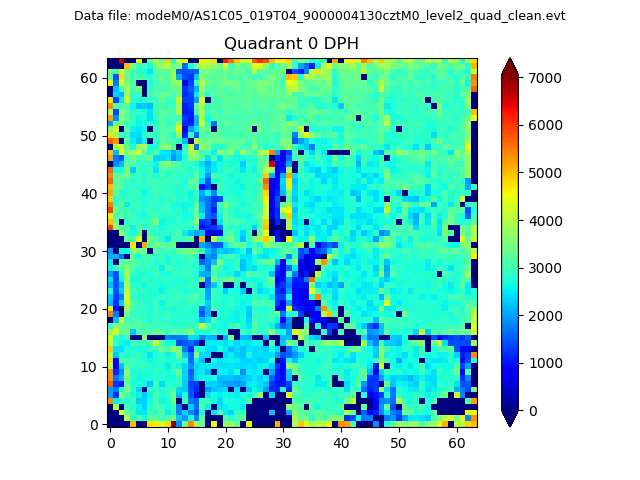 |
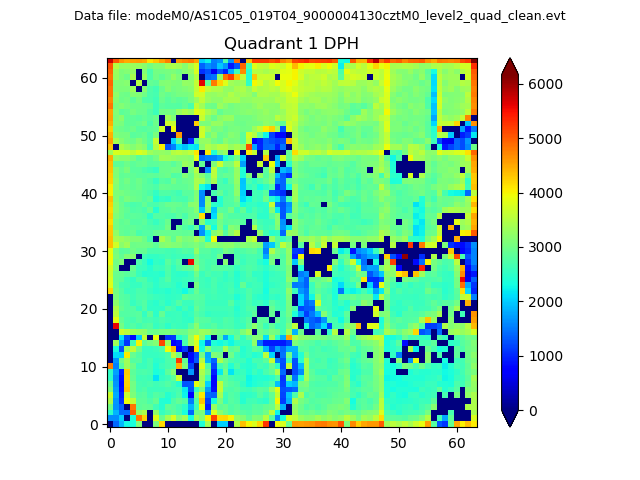 |
Quadrant B |
|---|---|---|---|
| Quadrant D | 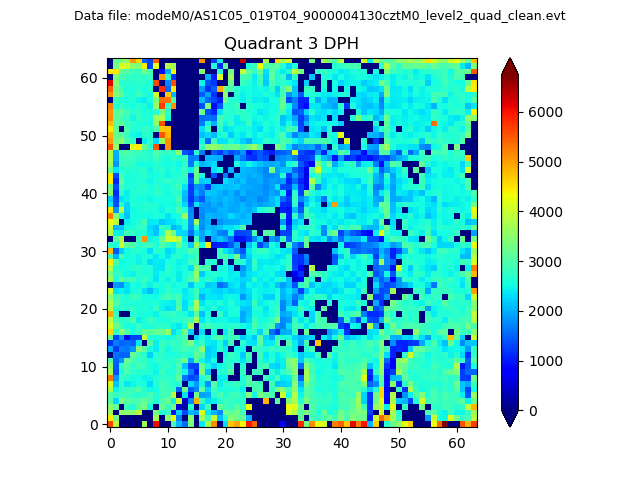 |
 |
Quadrant C |
| Plot type | Count rate plots | Images |
|---|---|---|
| Comparison with Poisson distribution Blue bars denote a histogram of data divided into 1 sec bins. Red curve is a Poisson curve with rate = median count rate of data. |
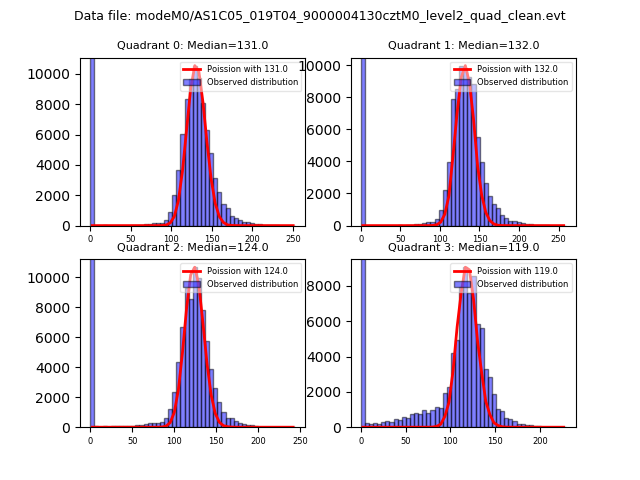 |
 |
| Quadrant-wise count rates Data is divided into 100 sec bins |
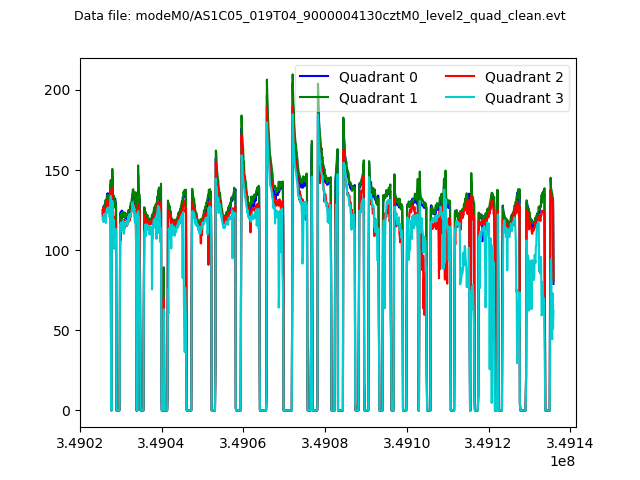 |
|
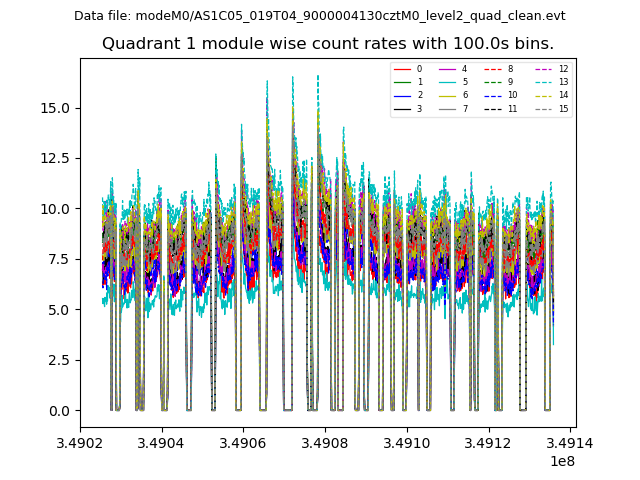
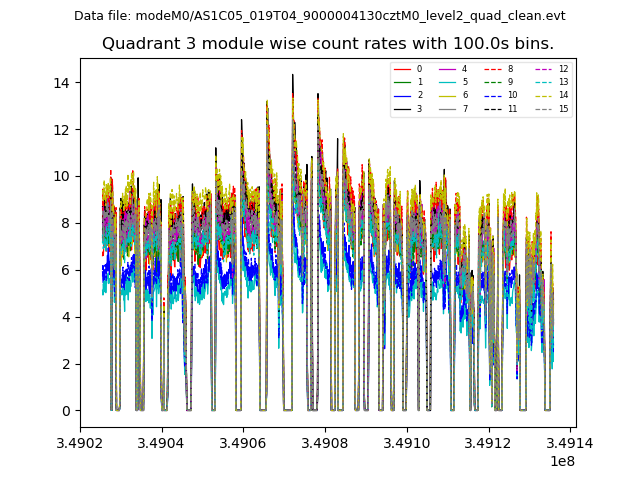
| Module-wise count rates for Quadrant A Data is divided into 100 sec bins |
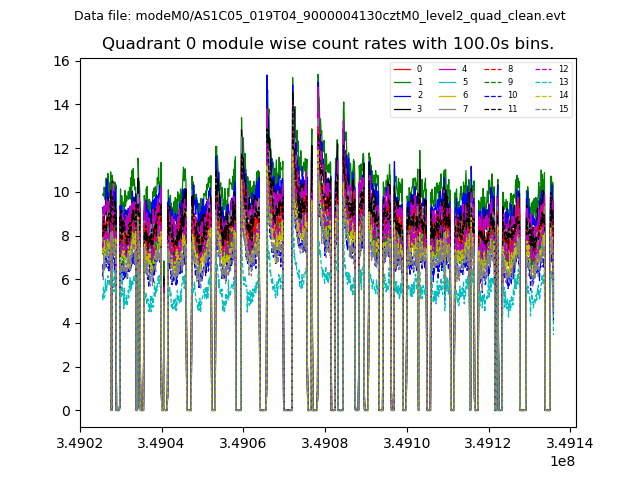 |
 |
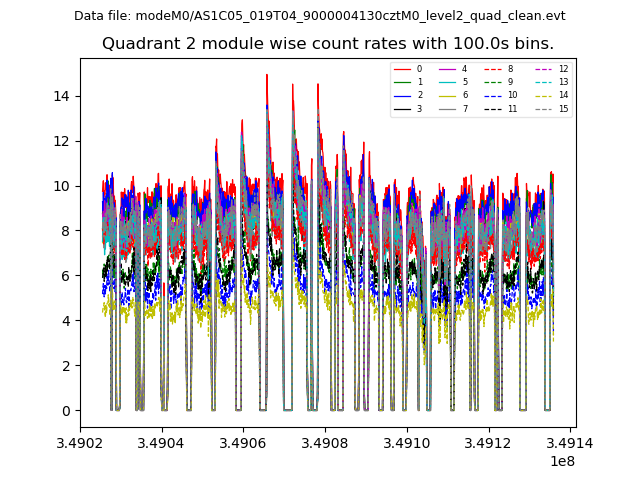
| Module-wise count rates for Quadrant B Data is divided into 100 sec bins |
 |
 |
| Module-wise count rates for Quadrant C Data is divided into 100 sec bins |
 |
 |
| Module-wise count rates for Quadrant D Data is divided into 100 sec bins |
 |
 |
| Parameter | Plot |
|---|---|
| CZT HV Monitor | 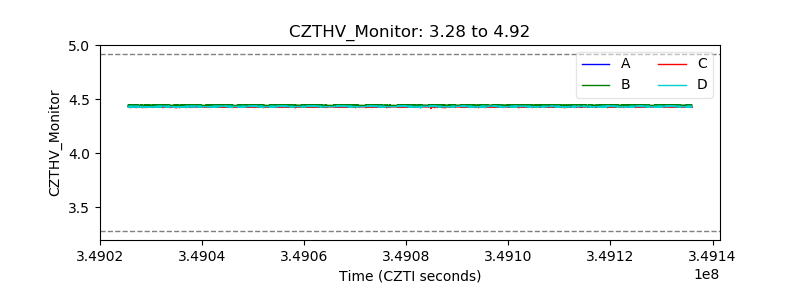 |
| D_VDD | 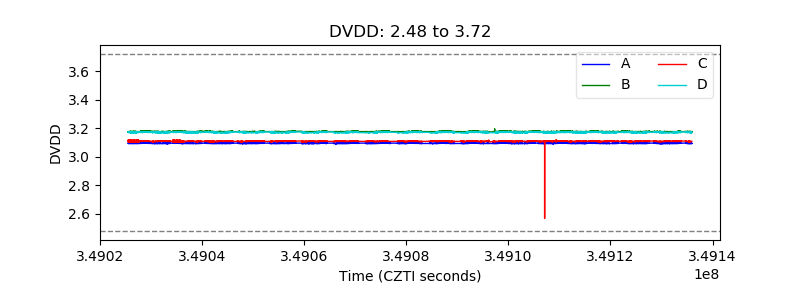 |
| Temperature 1 | 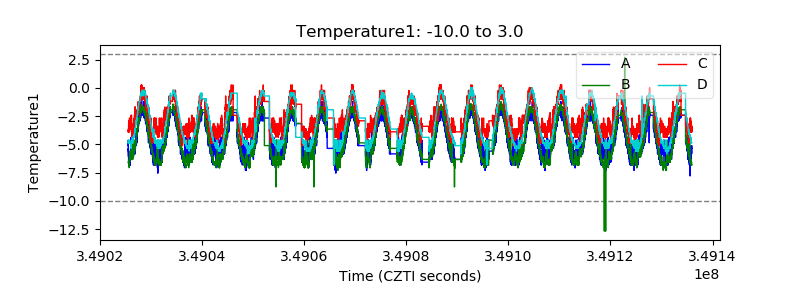 |
| Veto HV Monitor | 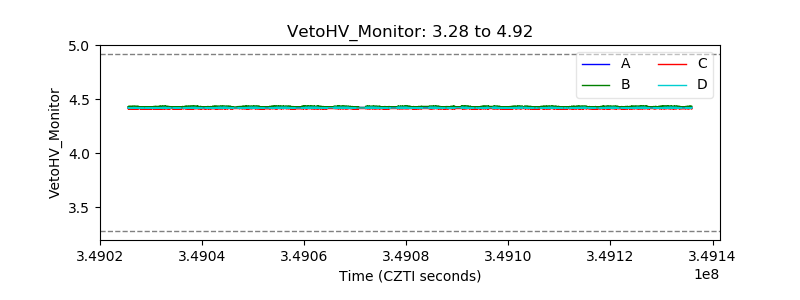 |
| Veto LLD | 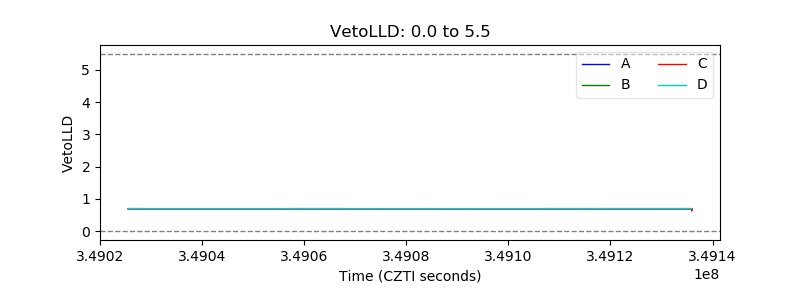 |
| Alpha Counter | 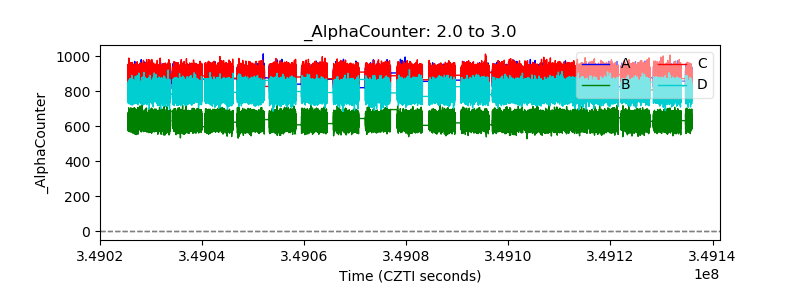 |
| _CPM_Rate | 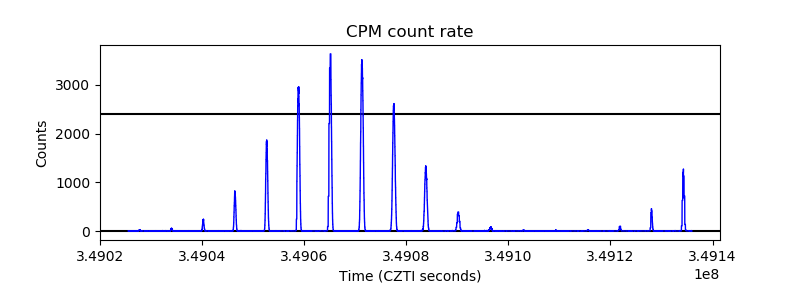 |
| CZT Counter | 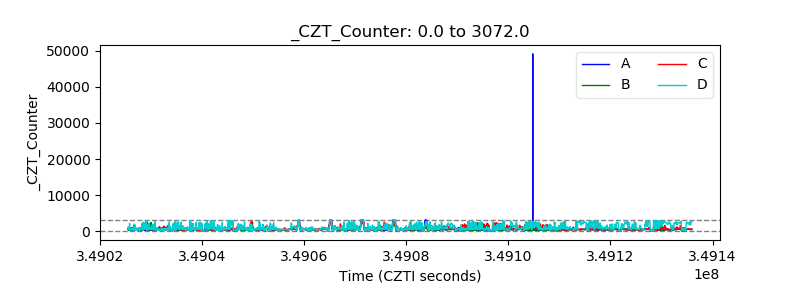 |
| +2.5 Volts monitor | 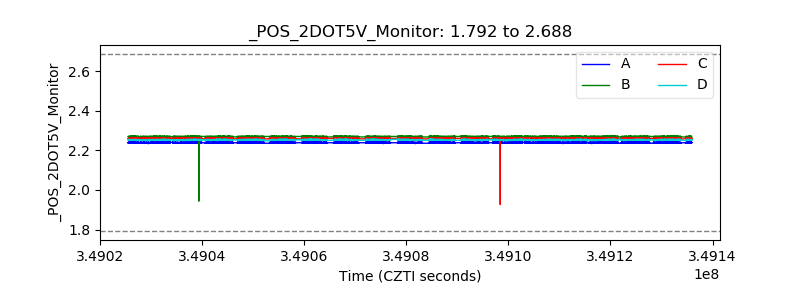 |
| +5 Volts monitor | 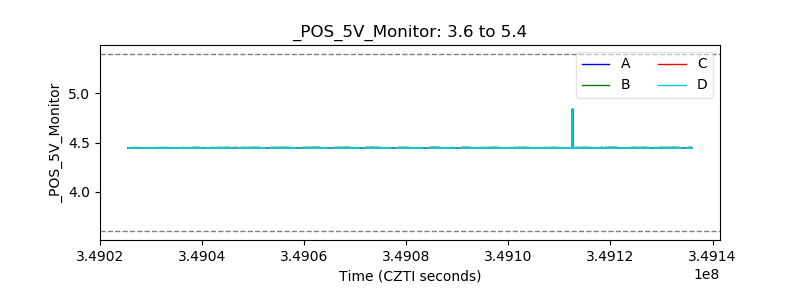 |
| _ROLL_ROT | 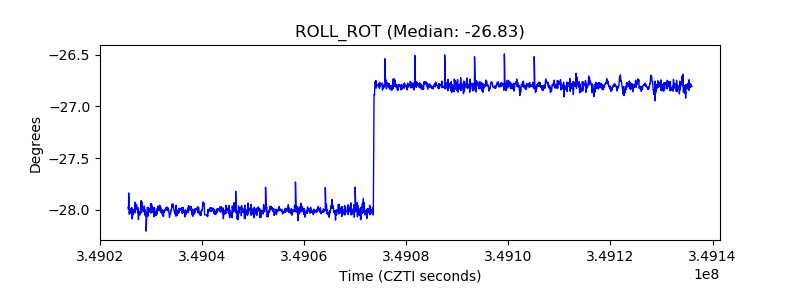 |
| _Roll_DEC | 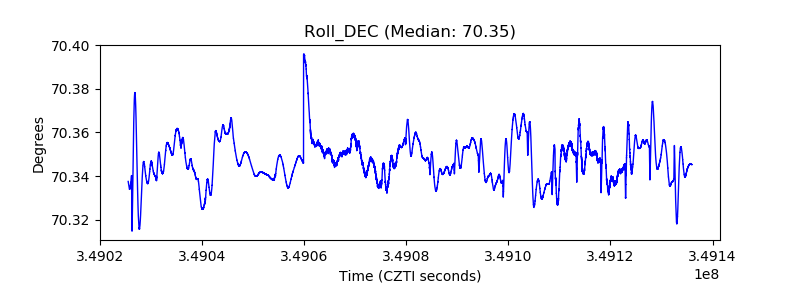 |
| _Roll_RA | 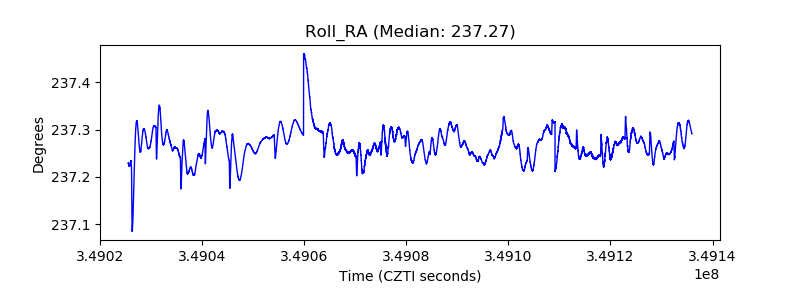 |
| Veto Counter | 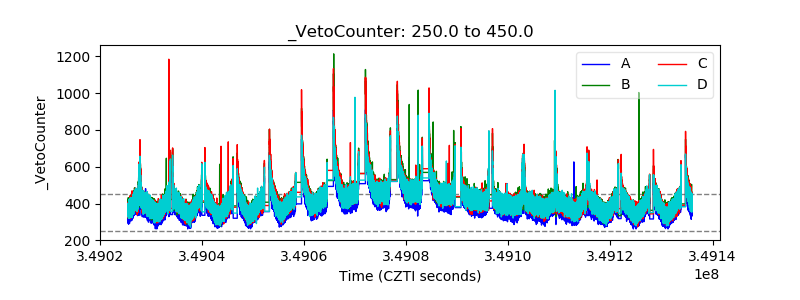 |