| Param | Original file | Final file |
|---|---|---|
| Filename | modeM0/AS1C05_019T04_9000004130_28770cztM0_level2.evt | modeM0/AS1C05_019T04_9000004130_28770cztM0_level2_quad_clean.evt |
| Size (bytes) | 1,553,316,480 | 283,579,200 |
| Size | 1.4 GB | 270.4 MB |
| Events in quadrant A | 8,429,801 | 1,893,308 |
| Events in quadrant B | 9,368,997 | 1,917,741 |
| Events in quadrant C | 11,040,965 | 1,825,436 |
| Events in quadrant D | 16,971,137 | 1,693,801 |
| Mode SS | |||
|---|---|---|---|
| Quadrant | BADHDUFLAG | Total packets | Discarded packets |
| A | 0 | 372 | 0 |
| B | 0 | 372 | 0 |
| C | 0 | 372 | 0 |
| D | 0 | 372 | 0 |
| Mode M9 | |||
|---|---|---|---|
| Quadrant | BADHDUFLAG | Total packets | Discarded packets |
| A | 0 | 18 | 0 |
| B | 0 | 18 | 0 |
| C | 0 | 18 | 0 |
| D | 0 | 18 | 0 |
| Mode M0 | |||
|---|---|---|---|
| Quadrant | BADHDUFLAG | Total packets | Discarded packets |
| A | 0 | 37232 | 3 |
| B | 0 | 39907 | 3 |
| C | 0 | 45732 | 3 |
| D | 0 | 63218 | 3 |
| Quadrant | Total seconds | Saturated seconds | Saturation percentage |
|---|---|---|---|
| A | 18257 | 85 | 0.465575% |
| B | 18257 | 378 | 2.070439% |
| C | 18257 | 453 | 2.481240% |
| D | 18258 | 2096 | 11.479899% |
Noise dominated data is calculated using 1-second bins in cleaned event files. If a bin has >2000 counts, and if more than 50% of those come from <1% of pixels, then it is considered to be noise-dominated and hence unusable.
| Quadrant | # 1 sec bins | Bins with >0 counts | Bins with >2000 counts | High rate bins dominated by noise | Noise dominated (total time) | Noise dominated (detector-on time) | Marked lightcurve |
|---|---|---|---|---|---|---|---|
| A | 20087 | 18260 | 4 | 4 | 0.02% | 0.02% | 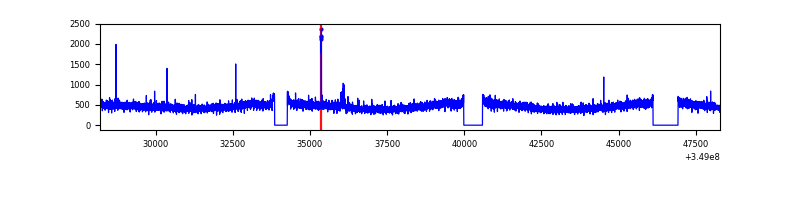 |
| B | 20087 | 18258 | 225 | 225 | 1.12% | 1.23% | 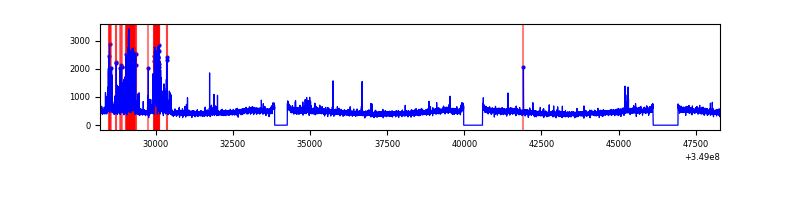 |
| C | 20087 | 18258 | 6 | 6 | 0.03% | 0.03% | 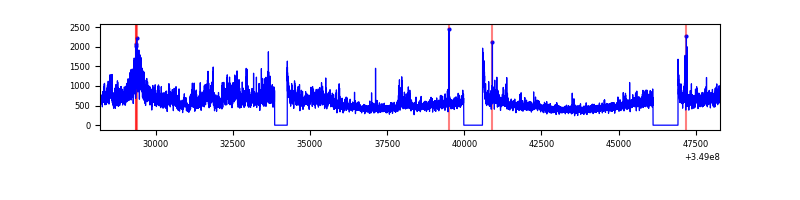 |
| D | 20088 | 18258 | 1813 | 1813 | 9.03% | 9.93% | 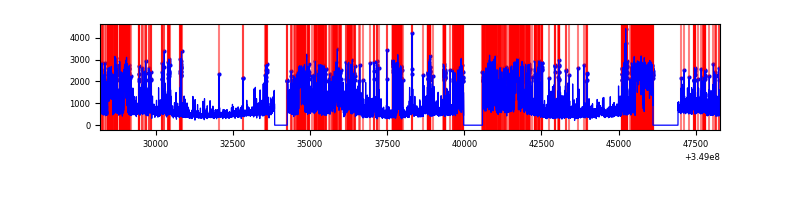 |
Top three noisy pixels from each quadrant. If the there are fewer than three noisy pixels in the level2.evt file, extra rows are filled as -1
| Pixel properties | Quadrant properties | ||||||
|---|---|---|---|---|---|---|---|
| Quadrant | DetID | PixID | Counts | Sigma | Mean | Median | Sigma |
| A | 15 | 174 | 39474 | 86.42 | 2158 | 2108 | 432.4 |
| A | 13 | 254 | 32731 | 70.83 | 2158 | 2108 | 432.4 |
| A | 13 | 6 | 31547 | 68.09 | 2158 | 2108 | 432.4 |
| B | 4 | 80 | 863100 | 2141.1 | 2128 | 2079 | 402.1 |
| B | 5 | 255 | 66359 | 159.85 | 2128 | 2079 | 402.1 |
| B | 12 | 111 | 50887 | 121.37 | 2128 | 2079 | 402.1 |
| C | 3 | 233 | 2516937 | 5256.21 | 2058 | 2072 | 478.5 |
| C | 14 | 238 | 361507 | 751.24 | 2058 | 2072 | 478.5 |
| C | 14 | 254 | 49445 | 99.01 | 2058 | 2072 | 478.5 |
| D | 1 | 52 | 5115526 | 10787.95 | 1989 | 1933 | 474.0 |
| D | 8 | 195 | 3424405 | 7220.25 | 1989 | 1933 | 474.0 |
| D | 12 | 233 | 445488 | 935.75 | 1989 | 1933 | 474.0 |
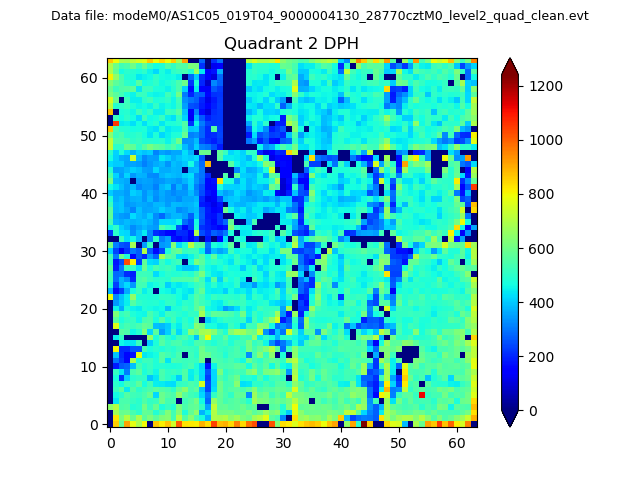
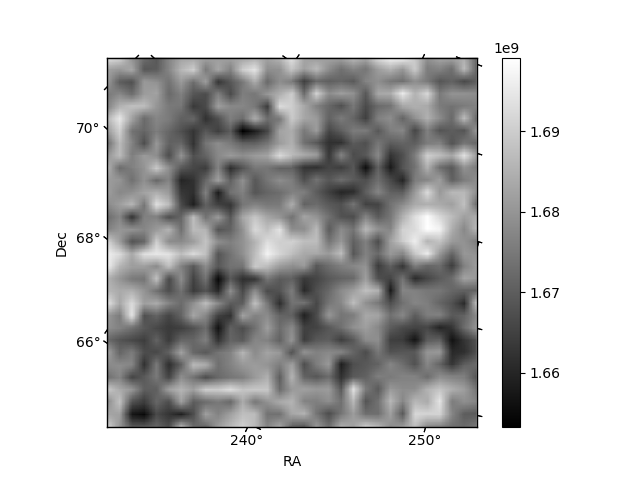
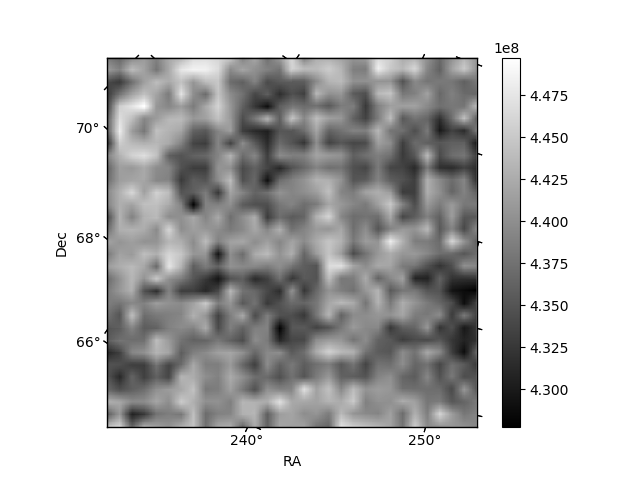
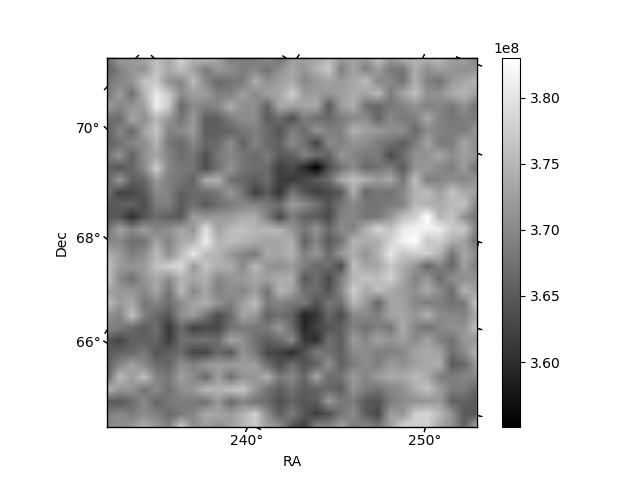
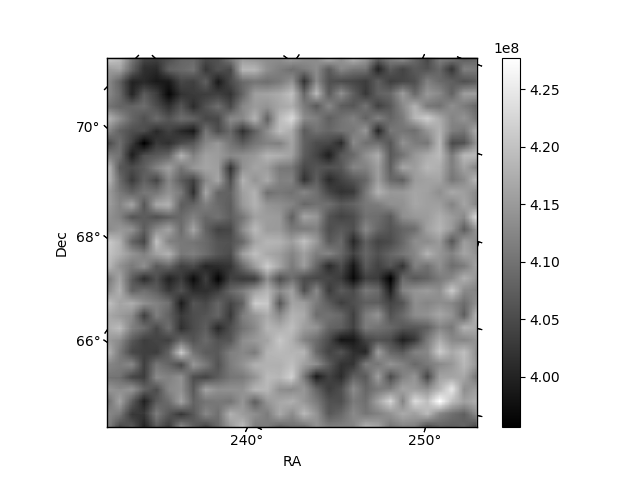
Histogram calculated using DETX and DETY for each event in the final _common_clean file
| Quadrant A | 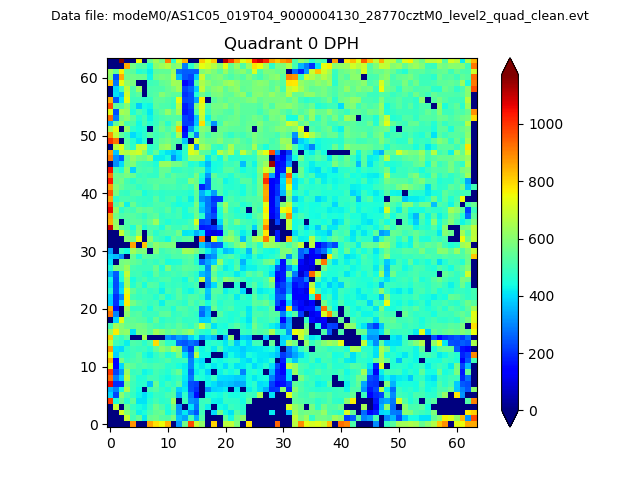 |
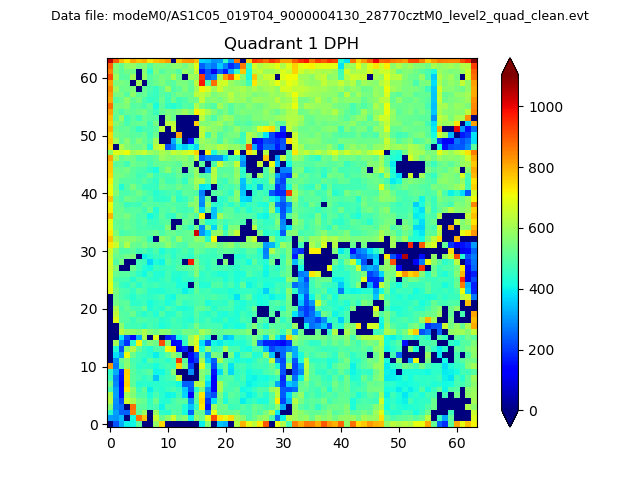 |
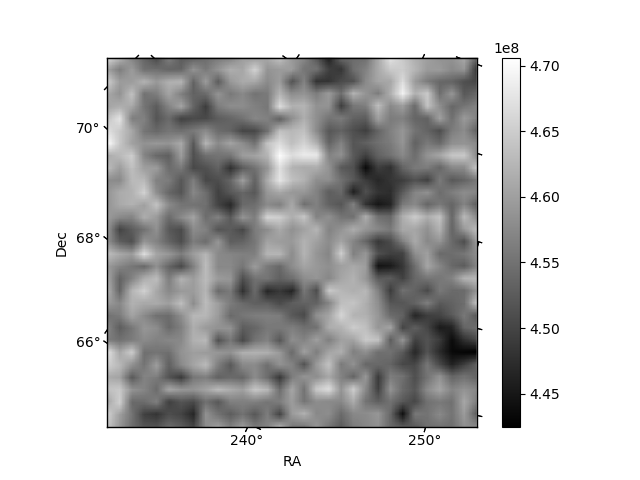
Quadrant B |
|---|---|---|---|
| Quadrant D | 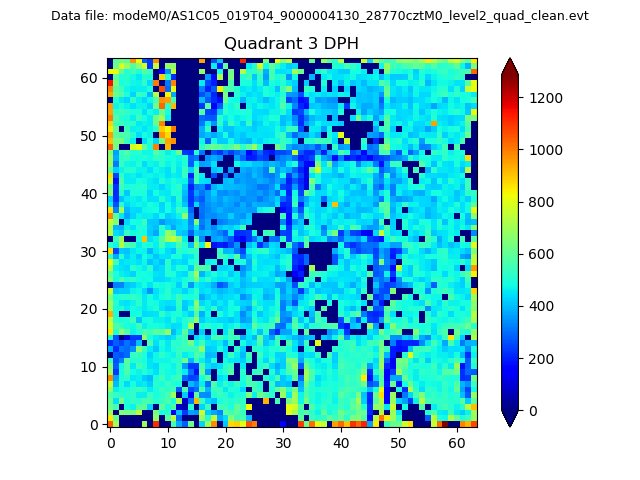 |
 |
Quadrant C |
| Plot type | Count rate plots | Images |
|---|---|---|
| Comparison with Poisson distribution Blue bars denote a histogram of data divided into 1 sec bins. Red curve is a Poisson curve with rate = median count rate of data. |
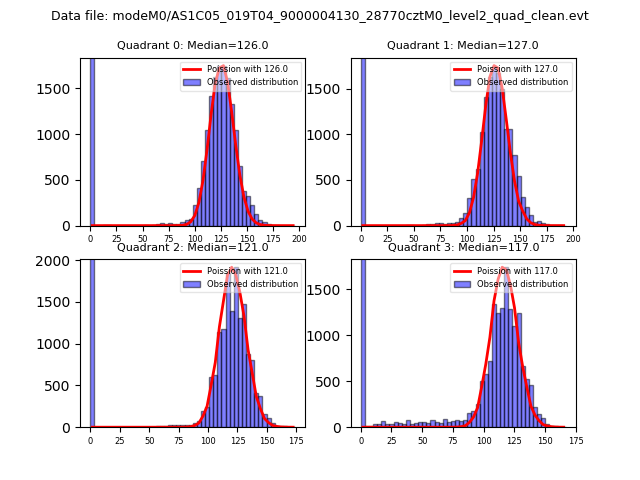 |
 |
| Quadrant-wise count rates Data is divided into 100 sec bins |
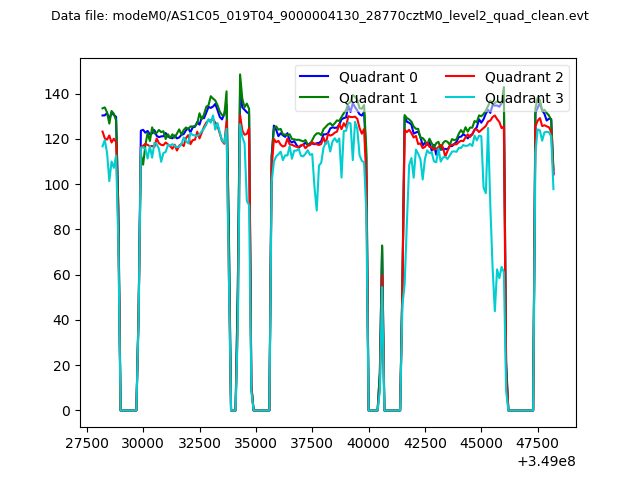 |
|
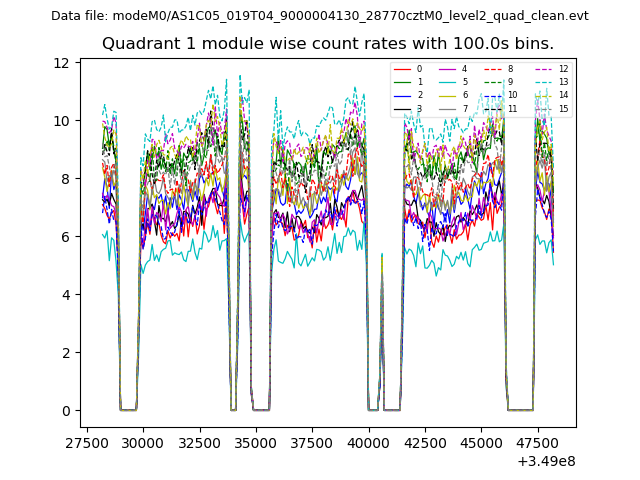
| Module-wise count rates for Quadrant A Data is divided into 100 sec bins |
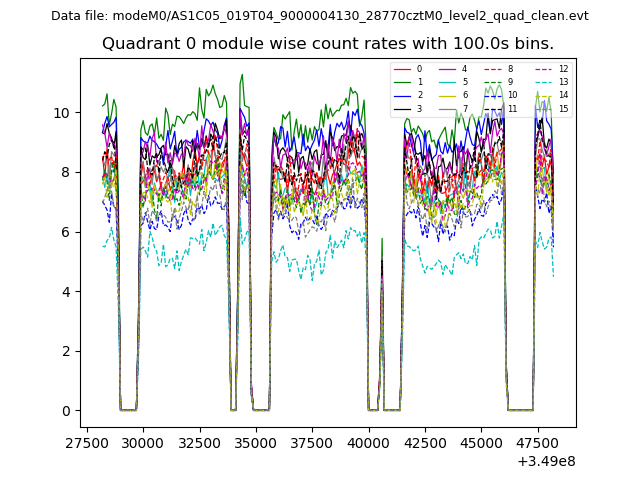 |
 |
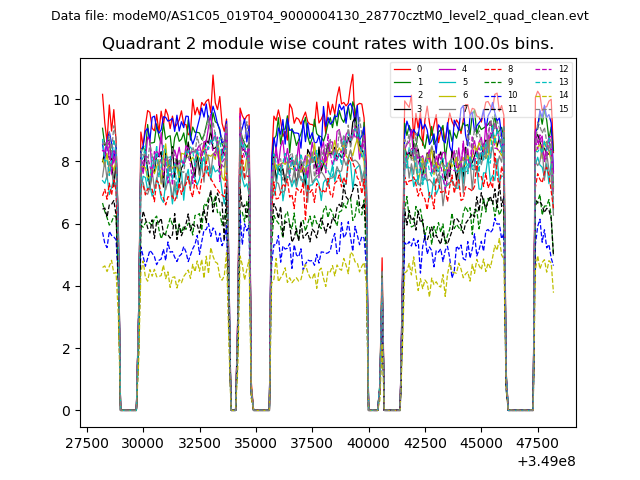
| Module-wise count rates for Quadrant B Data is divided into 100 sec bins |
 |
 |
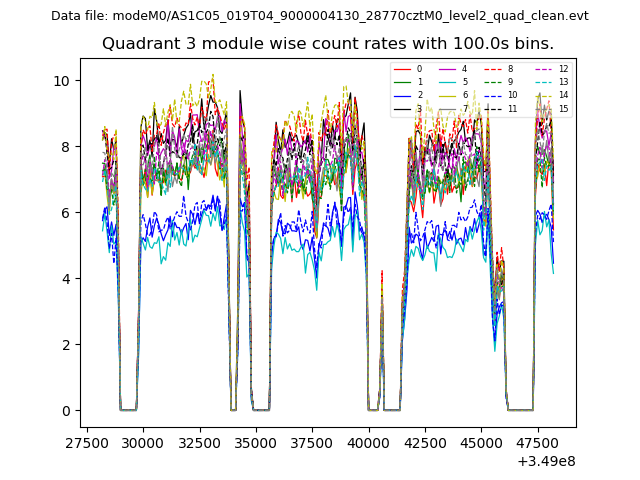
| Module-wise count rates for Quadrant C Data is divided into 100 sec bins |
 |
 |
| Module-wise count rates for Quadrant D Data is divided into 100 sec bins |
 |
 |
| Parameter | Plot |
|---|---|
| CZT HV Monitor | 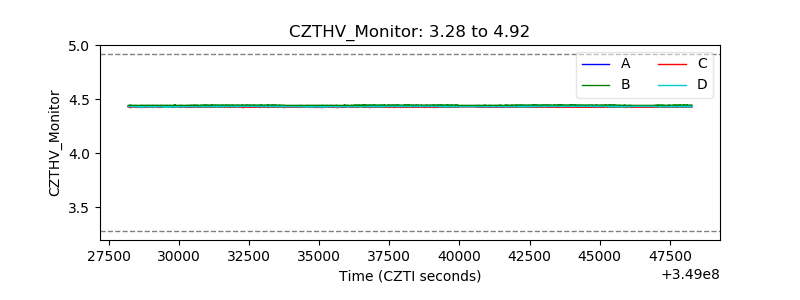 |
| D_VDD | 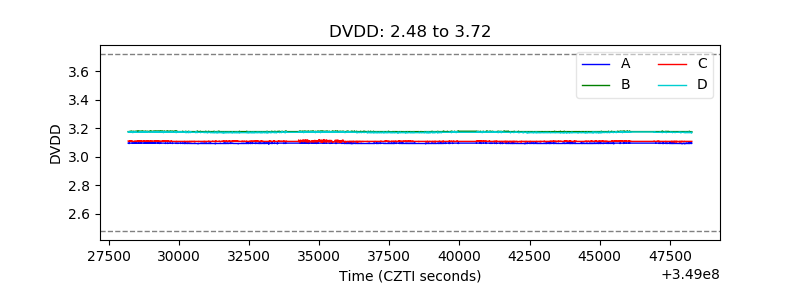 |
| Temperature 1 |  |
| Veto HV Monitor | 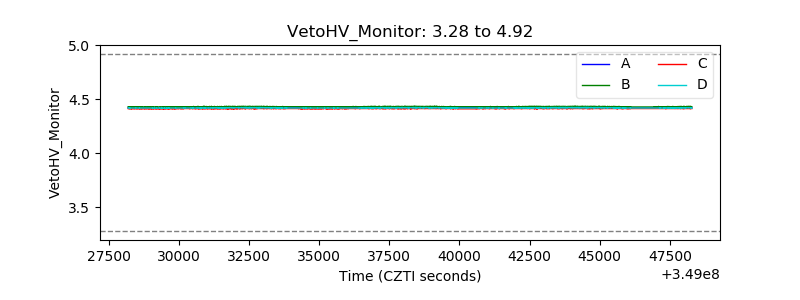 |
| Veto LLD | 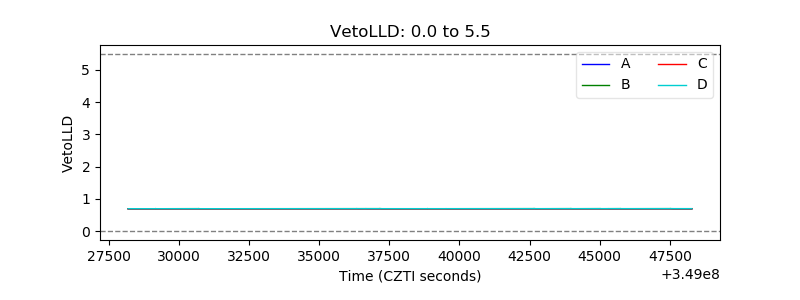 |
| Alpha Counter | 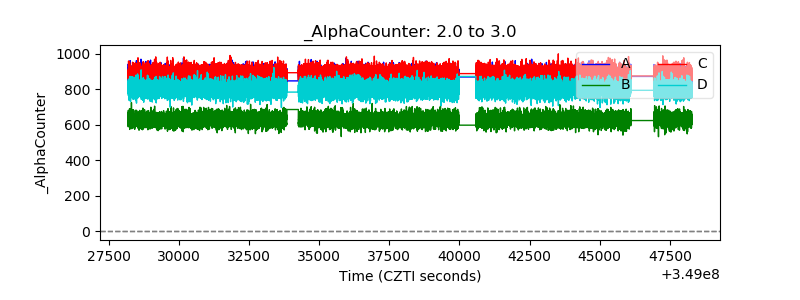 |
| _CPM_Rate | 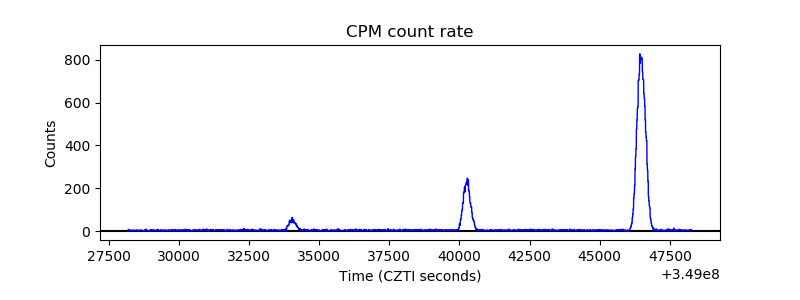 |
| CZT Counter | 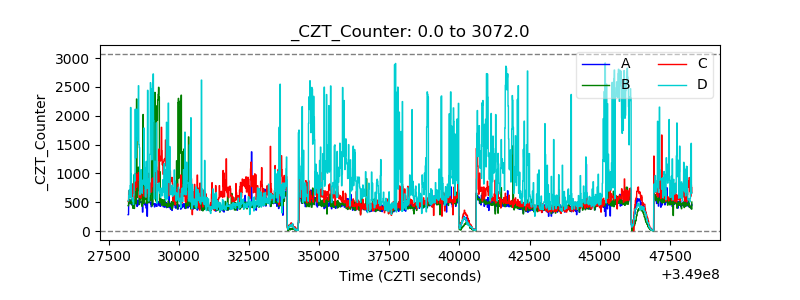 |
| +2.5 Volts monitor |  |
| +5 Volts monitor |  |
| _ROLL_ROT | 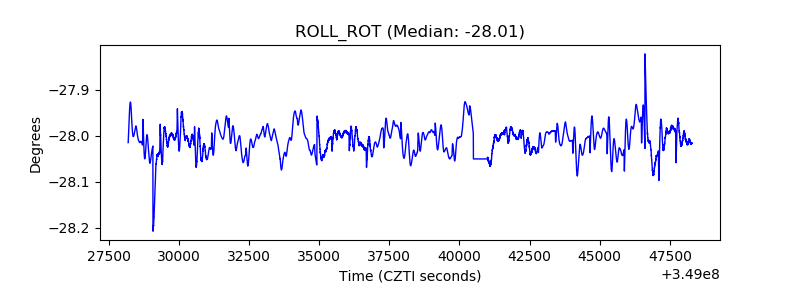 |
| _Roll_DEC | 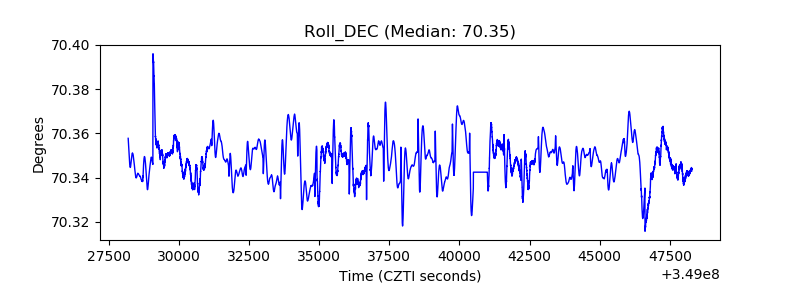 |
| _Roll_RA | 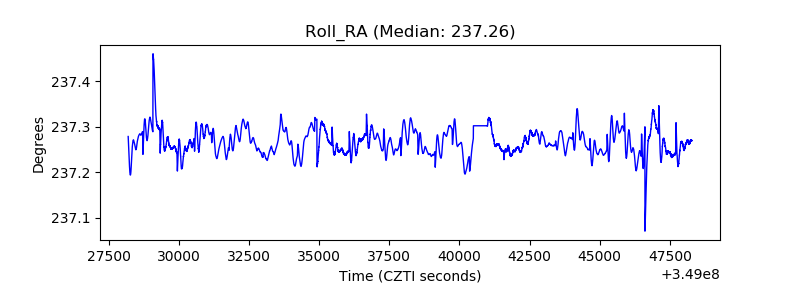 |
| Veto Counter | 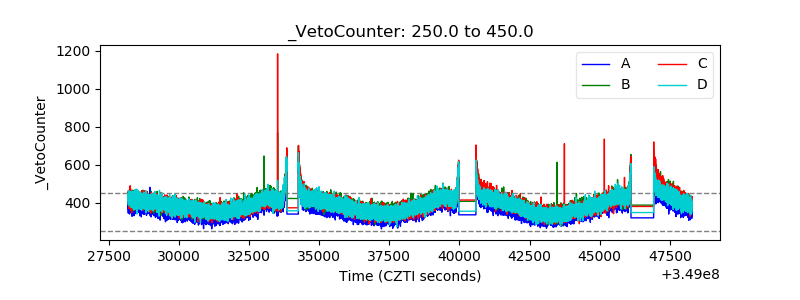 |