| Param | Original file | Final file |
|---|---|---|
| Filename | modeM0/AS1C05_019T04_9000004130_28771cztM0_level2.evt | modeM0/AS1C05_019T04_9000004130_28771cztM0_level2_quad_clean.evt |
| Size (bytes) | 526,504,320 | 119,937,600 |
| Size | 502.1 MB | 114.4 MB |
| Events in quadrant A | 3,177,303 | 804,281 |
| Events in quadrant B | 3,219,433 | 822,427 |
| Events in quadrant C | 4,192,555 | 774,234 |
| Events in quadrant D | 4,895,899 | 758,909 |
| Mode SS | |||
|---|---|---|---|
| Quadrant | BADHDUFLAG | Total packets | Discarded packets |
| A | 0 | 138 | 0 |
| B | 0 | 138 | 0 |
| C | 0 | 138 | 0 |
| D | 0 | 138 | 0 |
| Mode M9 | |||
|---|---|---|---|
| Quadrant | BADHDUFLAG | Total packets | Discarded packets |
| A | 0 | 18 | 0 |
| B | 0 | 18 | 0 |
| C | 0 | 18 | 0 |
| D | 0 | 18 | 0 |
| Mode M0 | |||
|---|---|---|---|
| Quadrant | BADHDUFLAG | Total packets | Discarded packets |
| A | 0 | 13929 | 2 |
| B | 0 | 14015 | 2 |
| C | 0 | 17073 | 2 |
| D | 0 | 19334 | 2 |
| Quadrant | Total seconds | Saturated seconds | Saturation percentage |
|---|---|---|---|
| A | 6786 | 19 | 0.279988% |
| B | 6787 | 40 | 0.589362% |
| C | 6787 | 336 | 4.950641% |
| D | 6787 | 214 | 3.153087% |
Noise dominated data is calculated using 1-second bins in cleaned event files. If a bin has >2000 counts, and if more than 50% of those come from <1% of pixels, then it is considered to be noise-dominated and hence unusable.
| Quadrant | # 1 sec bins | Bins with >0 counts | Bins with >2000 counts | High rate bins dominated by noise | Noise dominated (total time) | Noise dominated (detector-on time) | Marked lightcurve |
|---|---|---|---|---|---|---|---|
| A | 8576 | 6788 | 1 | 1 | 0.01% | 0.01% | 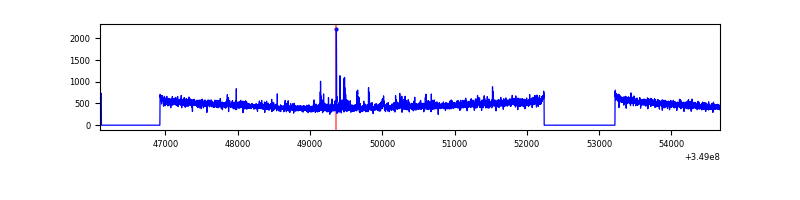 |
| B | 8577 | 6788 | 6 | 6 | 0.07% | 0.09% | 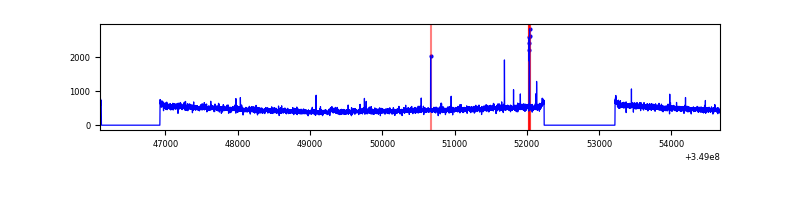 |
| C | 8577 | 6787 | 57 | 57 | 0.66% | 0.84% | 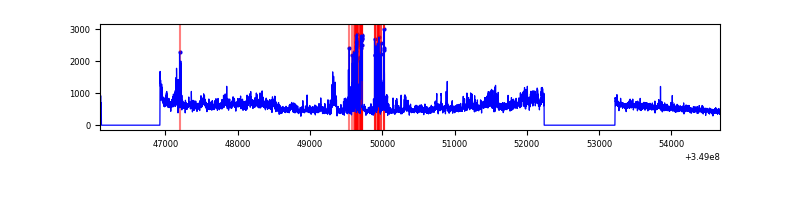 |
| D | 8577 | 6788 | 178 | 178 | 2.08% | 2.62% | 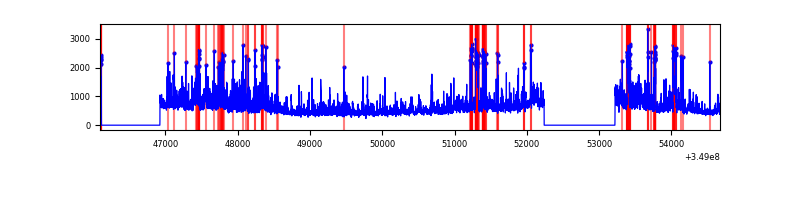 |
Top three noisy pixels from each quadrant. If the there are fewer than three noisy pixels in the level2.evt file, extra rows are filled as -1
| Pixel properties | Quadrant properties | ||||||
|---|---|---|---|---|---|---|---|
| Quadrant | DetID | PixID | Counts | Sigma | Mean | Median | Sigma |
| A | 5 | 98 | 53476 | 326.07 | 808 | 791 | 161.6 |
| A | 13 | 254 | 11682 | 67.41 | 808 | 791 | 161.6 |
| A | 3 | 137 | 7797 | 43.36 | 808 | 791 | 161.6 |
| B | 10 | 245 | 22557 | 141.86 | 807 | 784 | 153.5 |
| B | 12 | 111 | 19001 | 118.69 | 807 | 784 | 153.5 |
| B | 11 | 111 | 17366 | 108.03 | 807 | 784 | 153.5 |
| C | 3 | 233 | 666141 | 3720.72 | 770 | 778 | 178.8 |
| C | 15 | 208 | 274146 | 1528.68 | 770 | 778 | 178.8 |
| C | 14 | 238 | 168824 | 939.72 | 770 | 778 | 178.8 |
| D | 1 | 52 | 881897 | 4760.16 | 776 | 753 | 185.1 |
| D | 8 | 195 | 879741 | 4748.51 | 776 | 753 | 185.1 |
| D | 7 | 69 | 108692 | 583.11 | 776 | 753 | 185.1 |
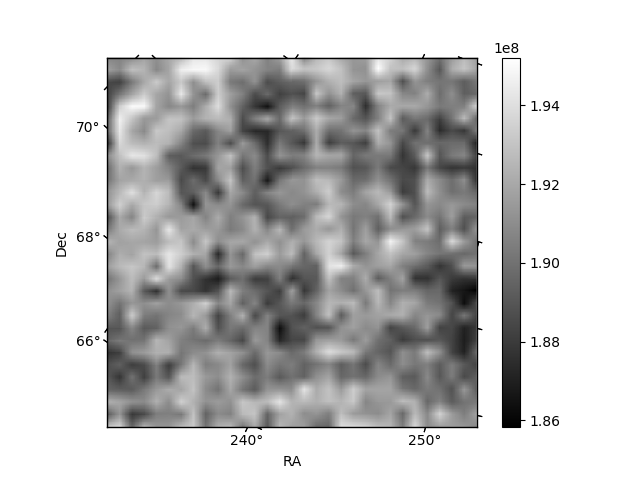
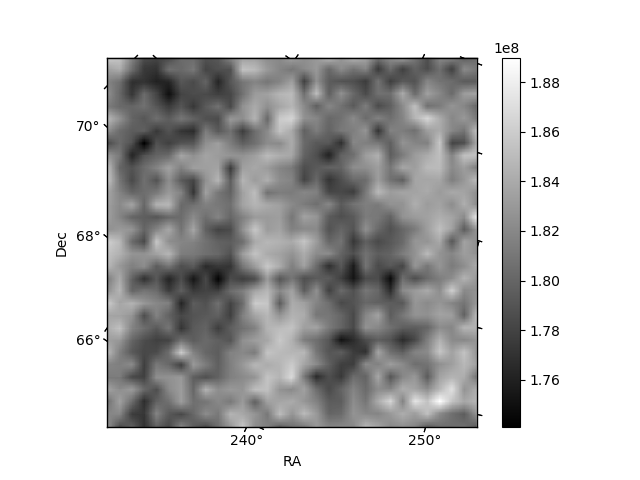
Histogram calculated using DETX and DETY for each event in the final _common_clean file
| Quadrant A |  |
 |
Quadrant B |
|---|---|---|---|
| Quadrant D |  |
 |
Quadrant C |
| Plot type | Count rate plots | Images |
|---|---|---|
| Comparison with Poisson distribution Blue bars denote a histogram of data divided into 1 sec bins. Red curve is a Poisson curve with rate = median count rate of data. |
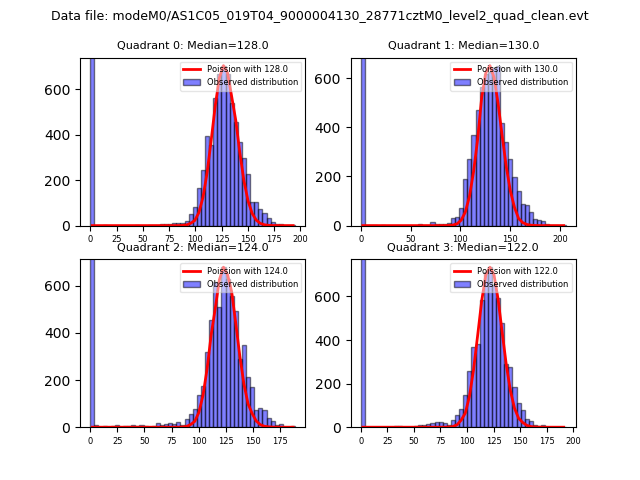 |
 |
| Quadrant-wise count rates Data is divided into 100 sec bins |
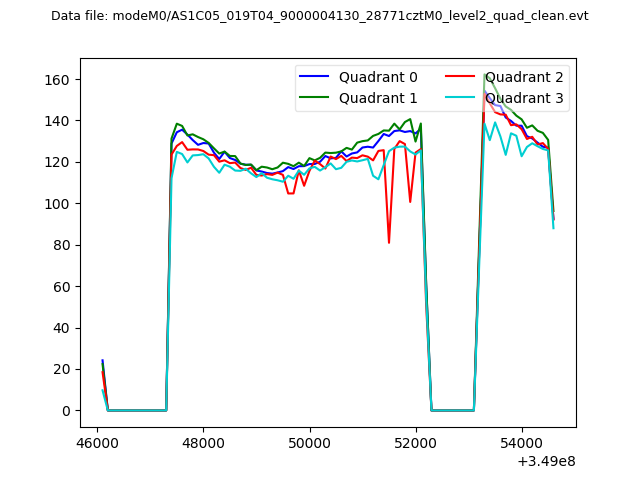 |
|
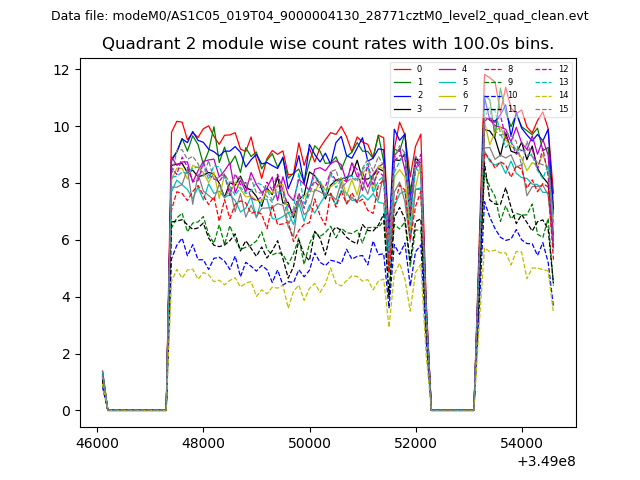
| Module-wise count rates for Quadrant A Data is divided into 100 sec bins |
 |
 |
| Module-wise count rates for Quadrant B Data is divided into 100 sec bins |
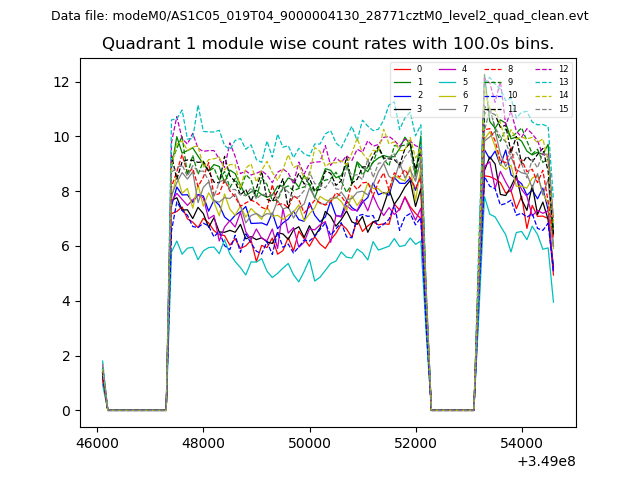 |
 |
| Module-wise count rates for Quadrant C Data is divided into 100 sec bins |
 |
 |
| Module-wise count rates for Quadrant D Data is divided into 100 sec bins |
 |
 |
| Parameter | Plot |
|---|---|
| CZT HV Monitor | 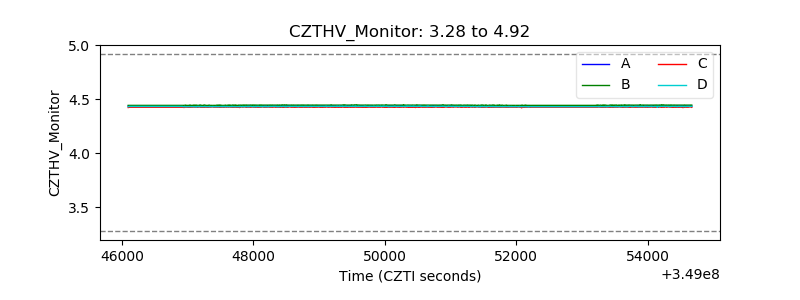 |
| D_VDD |  |
| Temperature 1 |  |
| Veto HV Monitor |  |
| Veto LLD |  |
| Alpha Counter | 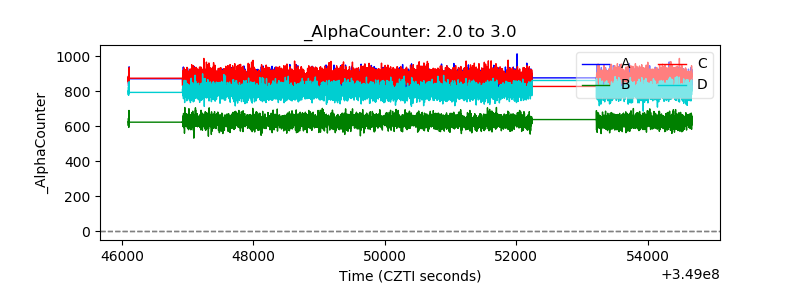 |
| _CPM_Rate | 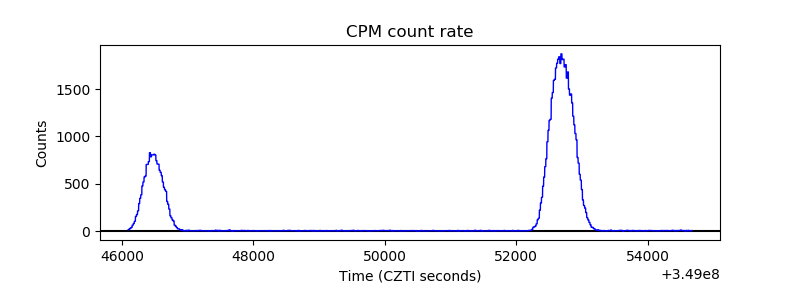 |
| CZT Counter |  |
| +2.5 Volts monitor |  |
| +5 Volts monitor |  |
| _ROLL_ROT |  |
| _Roll_DEC |  |
| _Roll_RA |  |
| Veto Counter |  |