| Param | Original file | Final file |
|---|---|---|
| Filename | modeM0/AS1C05_019T04_9000004130_28776cztM0_level2.evt | modeM0/AS1C05_019T04_9000004130_28776cztM0_level2_quad_clean.evt |
| Size (bytes) | 512,487,360 | 114,312,960 |
| Size | 488.7 MB | 109.0 MB |
| Events in quadrant A | 3,049,857 | 792,337 |
| Events in quadrant B | 3,076,735 | 807,560 |
| Events in quadrant C | 4,601,182 | 729,803 |
| Events in quadrant D | 4,384,599 | 711,730 |
| Mode SS | |||
|---|---|---|---|
| Quadrant | BADHDUFLAG | Total packets | Discarded packets |
| A | 0 | 124 | 0 |
| B | 0 | 124 | 0 |
| C | 0 | 124 | 0 |
| D | 0 | 124 | 0 |
| Mode M9 | |||
|---|---|---|---|
| Quadrant | BADHDUFLAG | Total packets | Discarded packets |
| A | 0 | 13 | 0 |
| B | 0 | 13 | 0 |
| C | 0 | 13 | 0 |
| D | 0 | 13 | 0 |
| Mode M0 | |||
|---|---|---|---|
| Quadrant | BADHDUFLAG | Total packets | Discarded packets |
| A | 0 | 12589 | 1 |
| B | 0 | 12720 | 1 |
| C | 0 | 17644 | 1 |
| D | 0 | 17087 | 1 |
| Quadrant | Total seconds | Saturated seconds | Saturation percentage |
|---|---|---|---|
| A | 6018 | 32 | 0.531738% |
| B | 6018 | 52 | 0.864074% |
| C | 6018 | 373 | 6.198072% |
| D | 6018 | 299 | 4.968428% |
Noise dominated data is calculated using 1-second bins in cleaned event files. If a bin has >2000 counts, and if more than 50% of those come from <1% of pixels, then it is considered to be noise-dominated and hence unusable.
| Quadrant | # 1 sec bins | Bins with >0 counts | Bins with >2000 counts | High rate bins dominated by noise | Noise dominated (total time) | Noise dominated (detector-on time) | Marked lightcurve |
|---|---|---|---|---|---|---|---|
| A | 7368 | 6018 | 0 | 0 | 0.00% | 0.00% | 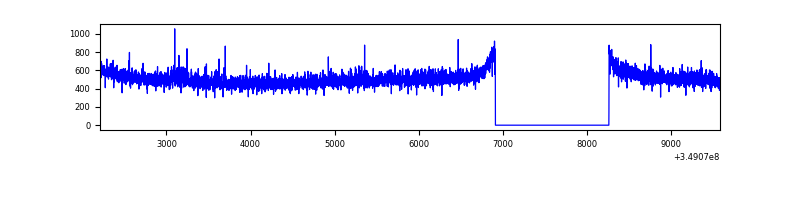 |
| B | 7368 | 6018 | 1 | 1 | 0.01% | 0.02% | 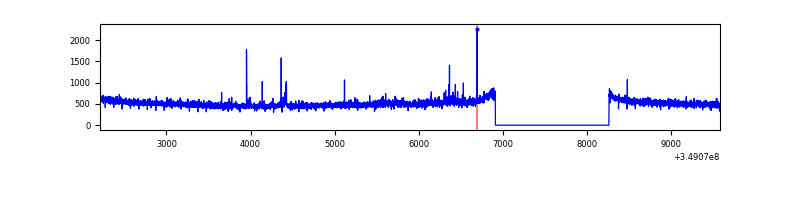 |
| C | 7368 | 6018 | 47 | 47 | 0.64% | 0.78% | 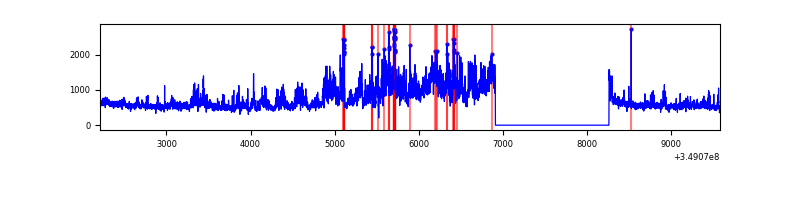 |
| D | 7368 | 6018 | 246 | 246 | 3.34% | 4.09% | 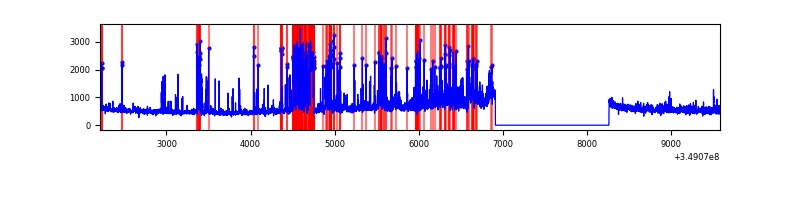 |
Top three noisy pixels from each quadrant. If the there are fewer than three noisy pixels in the level2.evt file, extra rows are filled as -1
| Pixel properties | Quadrant properties | ||||||
|---|---|---|---|---|---|---|---|
| Quadrant | DetID | PixID | Counts | Sigma | Mean | Median | Sigma |
| A | 13 | 254 | 10962 | 65.54 | 786 | 773 | 155.5 |
| A | 14 | 238 | 8848 | 51.94 | 786 | 773 | 155.5 |
| A | 3 | 137 | 6901 | 39.42 | 786 | 773 | 155.5 |
| B | 0 | 229 | 21027 | 140.79 | 776 | 760 | 144.0 |
| B | 12 | 111 | 16747 | 111.06 | 776 | 760 | 144.0 |
| B | 11 | 111 | 15091 | 99.56 | 776 | 760 | 144.0 |
| C | 3 | 233 | 1597187 | 9783.66 | 720 | 724 | 163.2 |
| C | 14 | 238 | 141380 | 861.99 | 720 | 724 | 163.2 |
| C | 14 | 254 | 32352 | 193.83 | 720 | 724 | 163.2 |
| D | 1 | 52 | 940189 | 5498.69 | 727 | 710 | 170.9 |
| D | 8 | 195 | 607635 | 3552.28 | 727 | 710 | 170.9 |
| D | 12 | 233 | 76460 | 443.36 | 727 | 710 | 170.9 |
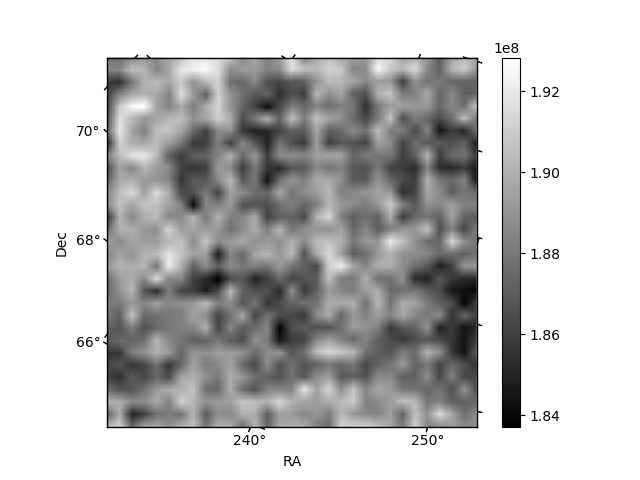
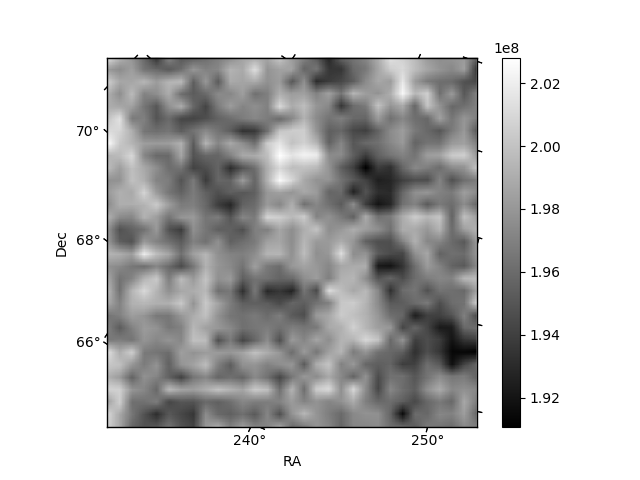
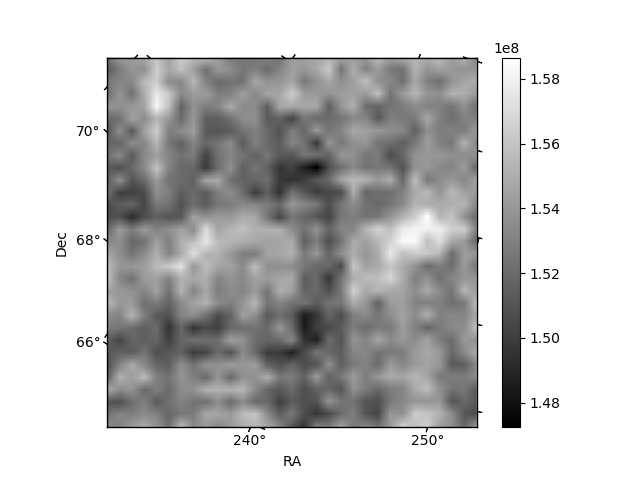
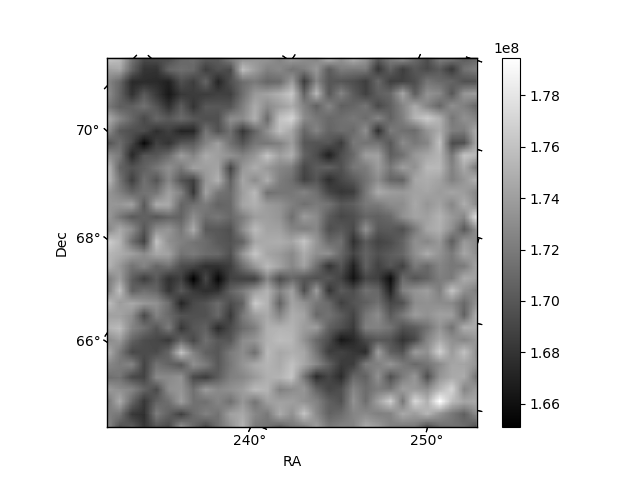
Histogram calculated using DETX and DETY for each event in the final _common_clean file
| Quadrant A | 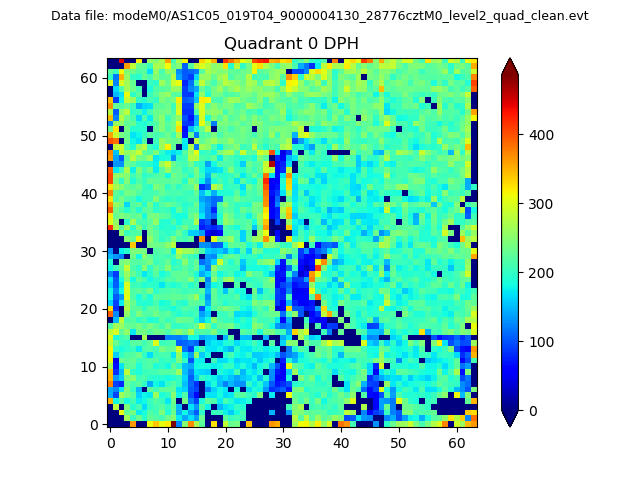 |
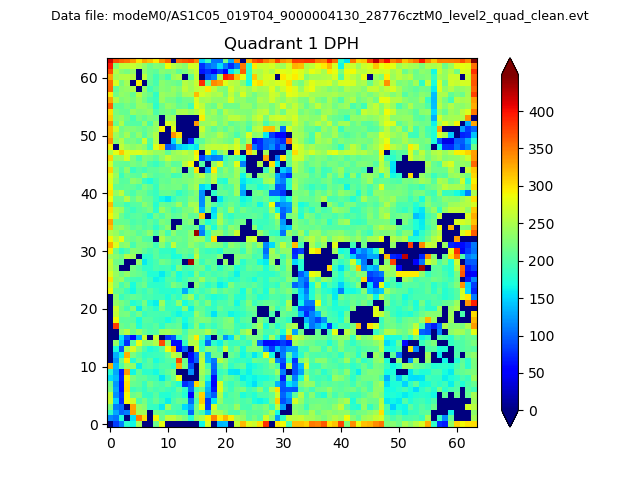 |
Quadrant B |
|---|---|---|---|
| Quadrant D | 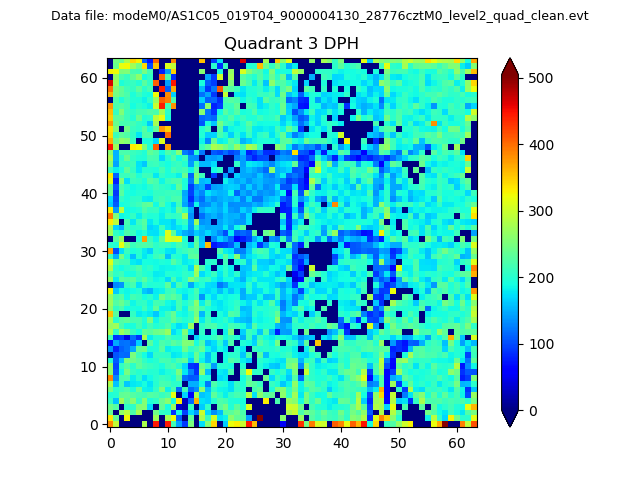 |
 |
Quadrant C |
| Plot type | Count rate plots | Images |
|---|---|---|
| Comparison with Poisson distribution Blue bars denote a histogram of data divided into 1 sec bins. Red curve is a Poisson curve with rate = median count rate of data. |
 |
 |
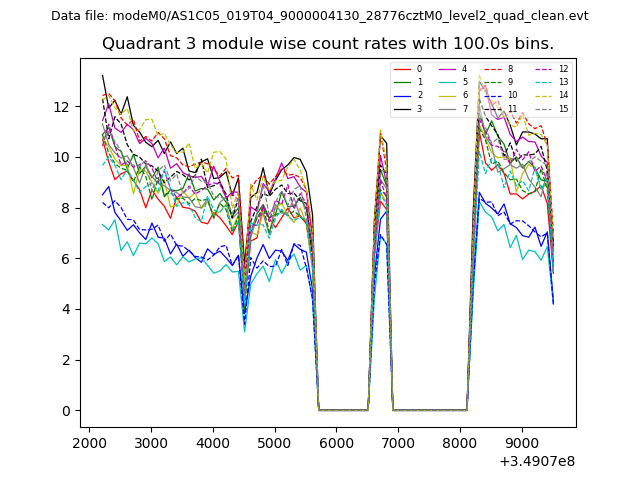
| Quadrant-wise count rates Data is divided into 100 sec bins |
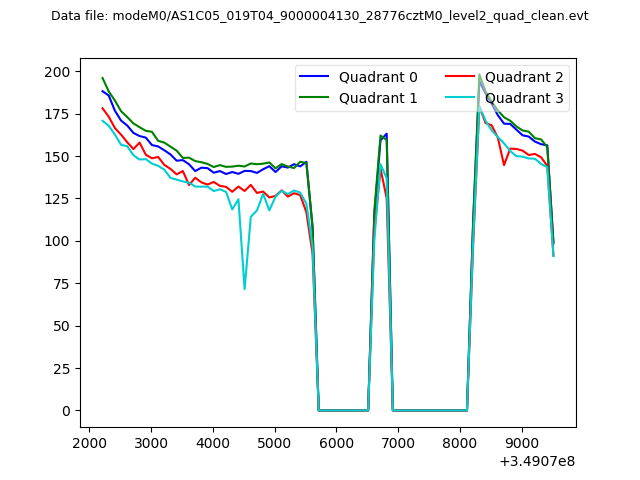 |
|
| Module-wise count rates for Quadrant A Data is divided into 100 sec bins |
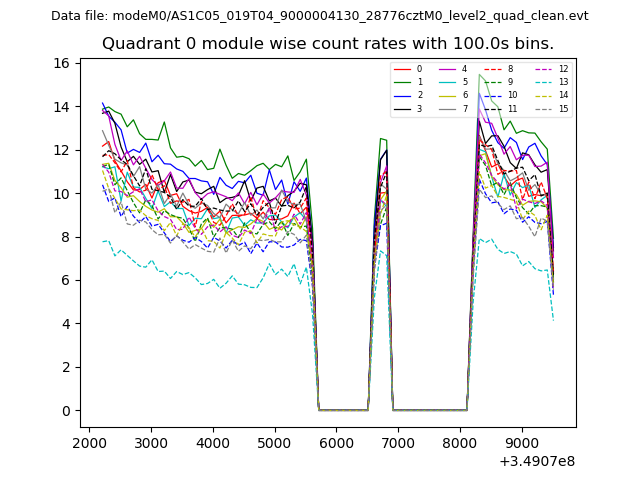 |
 |
| Module-wise count rates for Quadrant B Data is divided into 100 sec bins |
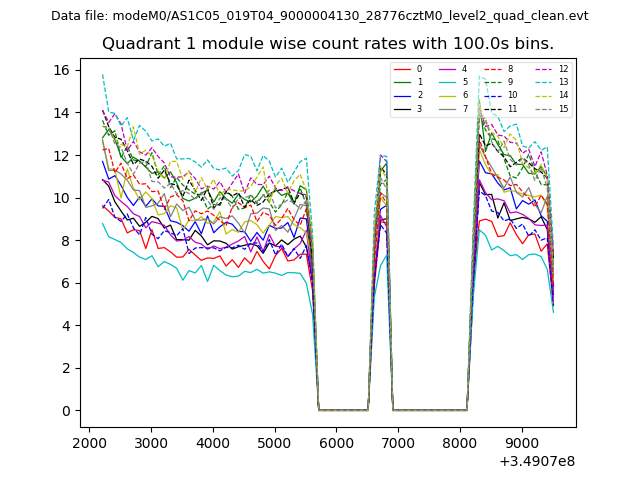 |
 |
| Module-wise count rates for Quadrant C Data is divided into 100 sec bins |
 |
 |
| Module-wise count rates for Quadrant D Data is divided into 100 sec bins |
 |
 |
| Parameter | Plot |
|---|---|
| CZT HV Monitor | 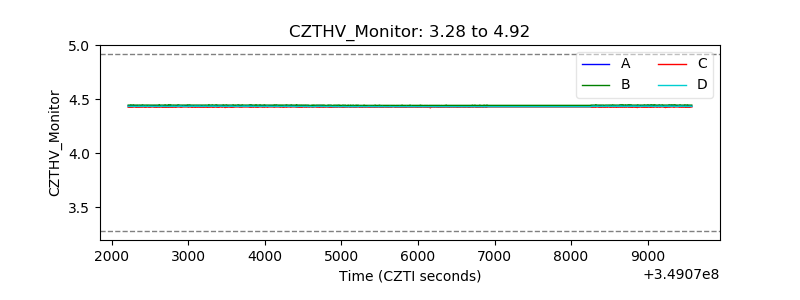 |
| D_VDD | 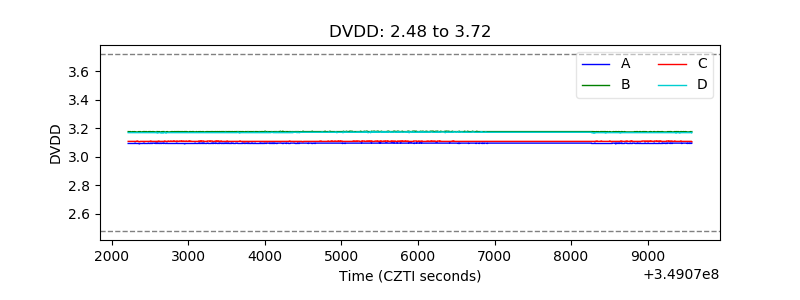 |
| Temperature 1 |  |
| Veto HV Monitor | 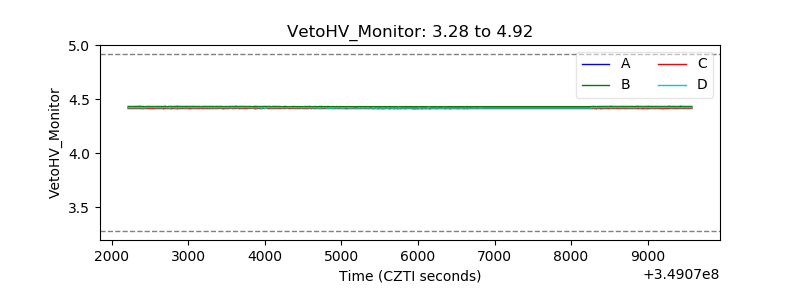 |
| Veto LLD |  |
| Alpha Counter |  |
| _CPM_Rate | 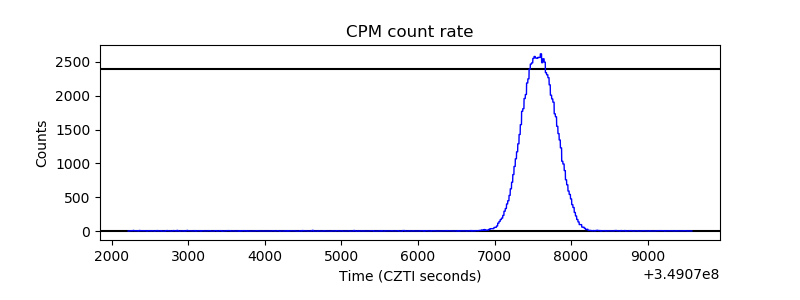 |
| CZT Counter | 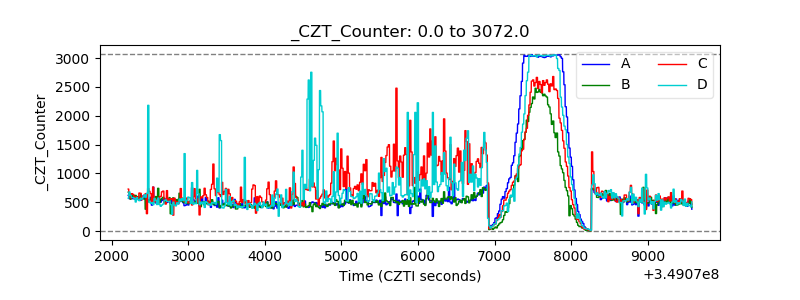 |
| +2.5 Volts monitor |  |
| +5 Volts monitor |  |
| _ROLL_ROT | 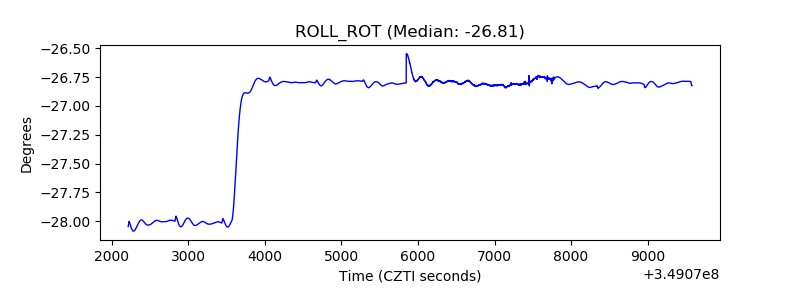 |
| _Roll_DEC | 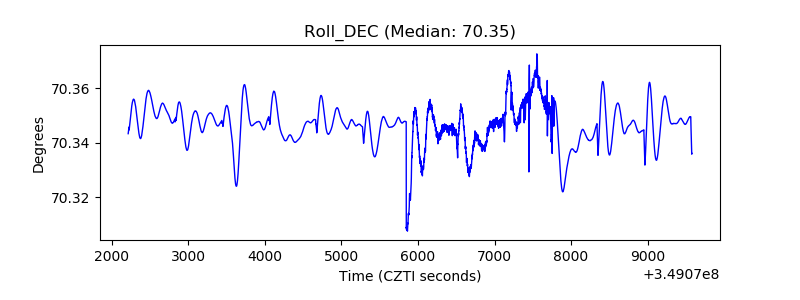 |
| _Roll_RA |  |
| Veto Counter | 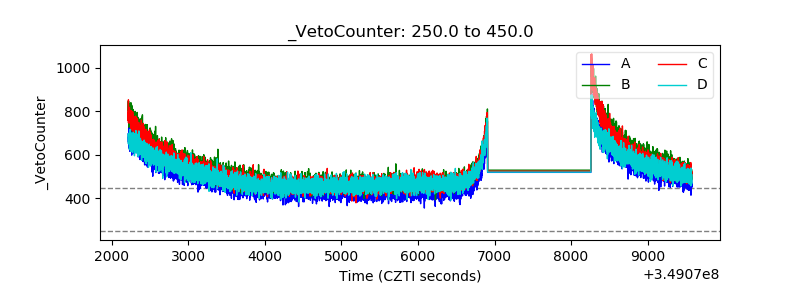 |