| Param | Original file | Final file |
|---|---|---|
| Filename | modeM0/AS1C05_019T04_9000004130_28778cztM0_level2.evt | modeM0/AS1C05_019T04_9000004130_28778cztM0_level2_quad_clean.evt |
| Size (bytes) | 588,242,880 | 102,294,720 |
| Size | 561.0 MB | 97.6 MB |
| Events in quadrant A | 2,858,634 | 701,195 |
| Events in quadrant B | 2,846,994 | 709,797 |
| Events in quadrant C | 5,673,207 | 642,341 |
| Events in quadrant D | 6,038,043 | 632,860 |
| Mode SS | |||
|---|---|---|---|
| Quadrant | BADHDUFLAG | Total packets | Discarded packets |
| A | 0 | 120 | 0 |
| B | 0 | 120 | 0 |
| C | 0 | 120 | 0 |
| D | 0 | 120 | 0 |
| Mode M9 | |||
|---|---|---|---|
| Quadrant | BADHDUFLAG | Total packets | Discarded packets |
| A | 0 | 11 | 0 |
| B | 0 | 11 | 0 |
| C | 0 | 11 | 0 |
| D | 0 | 11 | 0 |
| Mode M0 | |||
|---|---|---|---|
| Quadrant | BADHDUFLAG | Total packets | Discarded packets |
| A | 0 | 12051 | 1 |
| B | 0 | 12065 | 1 |
| C | 0 | 21105 | 1 |
| D | 0 | 21959 | 1 |
| Quadrant | Total seconds | Saturated seconds | Saturation percentage |
|---|---|---|---|
| A | 5889 | 52 | 0.883002% |
| B | 5890 | 57 | 0.967742% |
| C | 5890 | 326 | 5.534805% |
| D | 5890 | 559 | 9.490662% |
Noise dominated data is calculated using 1-second bins in cleaned event files. If a bin has >2000 counts, and if more than 50% of those come from <1% of pixels, then it is considered to be noise-dominated and hence unusable.
| Quadrant | # 1 sec bins | Bins with >0 counts | Bins with >2000 counts | High rate bins dominated by noise | Noise dominated (total time) | Noise dominated (detector-on time) | Marked lightcurve |
|---|---|---|---|---|---|---|---|
| A | 7024 | 5889 | 0 | 0 | 0.00% | 0.00% | 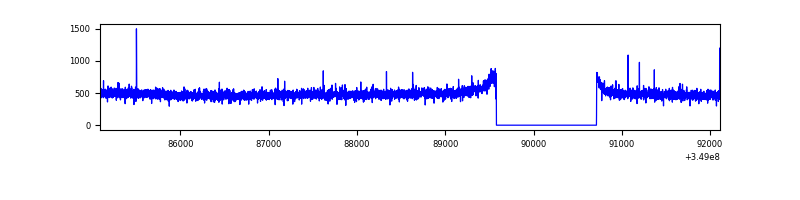 |
| B | 7025 | 5890 | 0 | 0 | 0.00% | 0.00% | 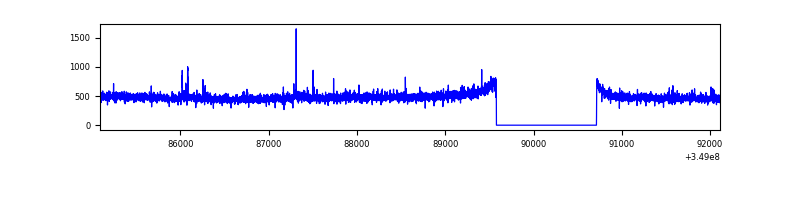 |
| C | 7025 | 5890 | 69 | 69 | 0.98% | 1.17% | 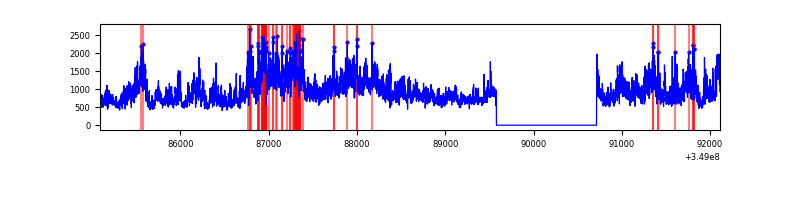 |
| D | 7025 | 5890 | 466 | 466 | 6.63% | 7.91% | 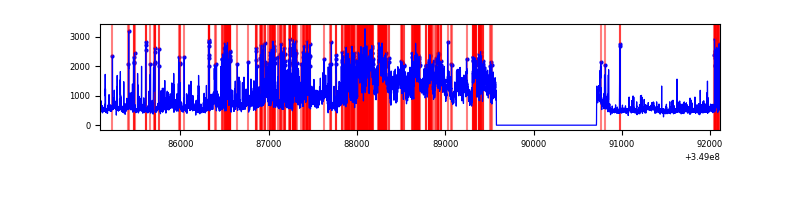 |
Top three noisy pixels from each quadrant. If the there are fewer than three noisy pixels in the level2.evt file, extra rows are filled as -1
| Pixel properties | Quadrant properties | ||||||
|---|---|---|---|---|---|---|---|
| Quadrant | DetID | PixID | Counts | Sigma | Mean | Median | Sigma |
| A | 13 | 254 | 10359 | 65.23 | 736 | 720 | 147.8 |
| A | 3 | 137 | 6772 | 40.96 | 736 | 720 | 147.8 |
| A | 0 | 226 | 6419 | 38.57 | 736 | 720 | 147.8 |
| B | 12 | 111 | 15995 | 113.58 | 721 | 703 | 134.6 |
| B | 11 | 111 | 14719 | 104.1 | 721 | 703 | 134.6 |
| B | 14 | 111 | 13449 | 94.67 | 721 | 703 | 134.6 |
| C | 3 | 233 | 2768997 | 17742.48 | 679 | 683 | 156.0 |
| C | 14 | 238 | 117881 | 751.14 | 679 | 683 | 156.0 |
| C | 15 | 208 | 90315 | 574.46 | 679 | 683 | 156.0 |
| D | 8 | 195 | 1961642 | 12135.42 | 686 | 667 | 161.6 |
| D | 1 | 52 | 1407253 | 8704.61 | 686 | 667 | 161.6 |
| D | 12 | 233 | 58413 | 357.36 | 686 | 667 | 161.6 |
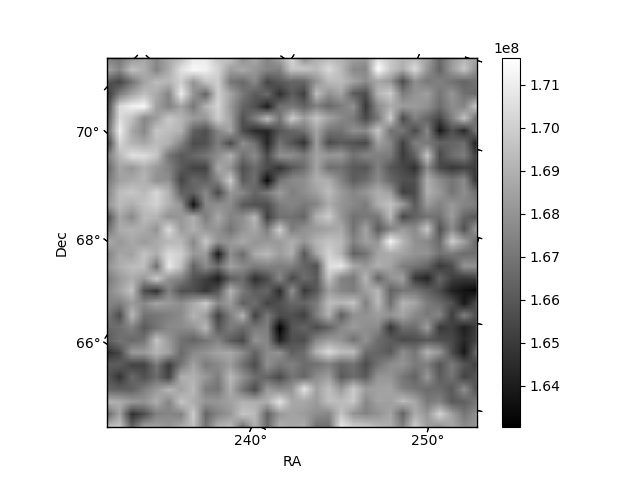
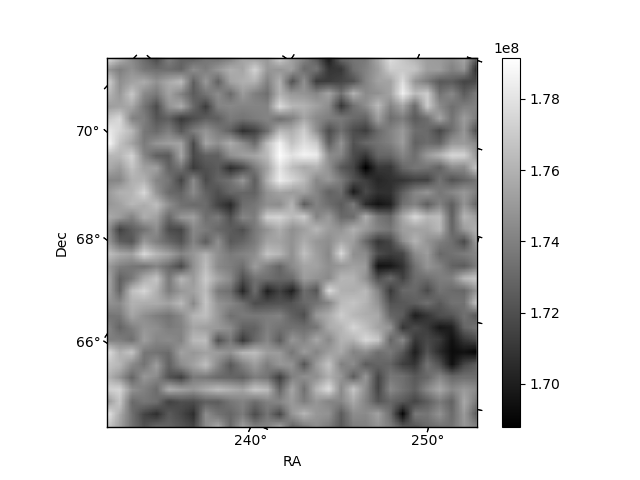
Histogram calculated using DETX and DETY for each event in the final _common_clean file
| Quadrant A | 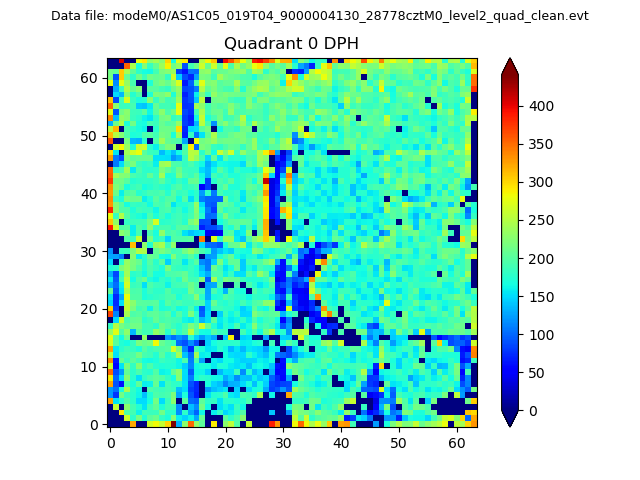 |
 |
Quadrant B |
|---|---|---|---|
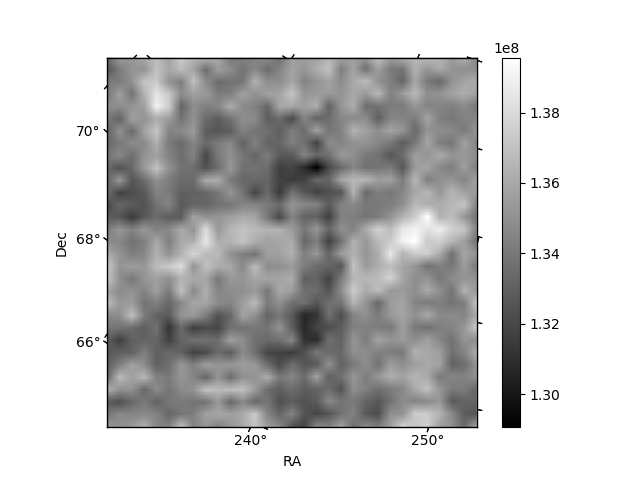
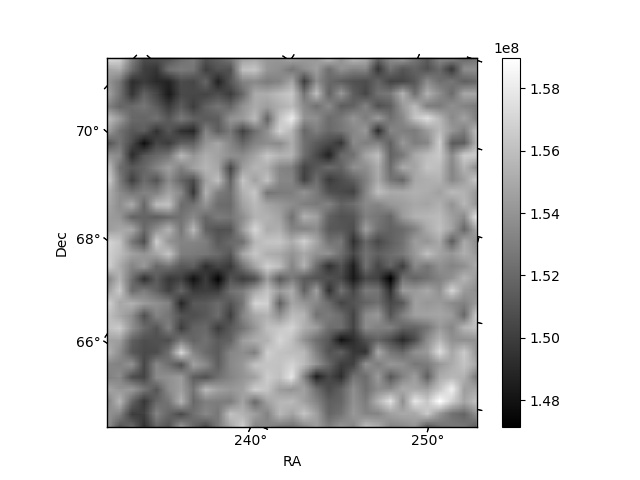
| Quadrant D | 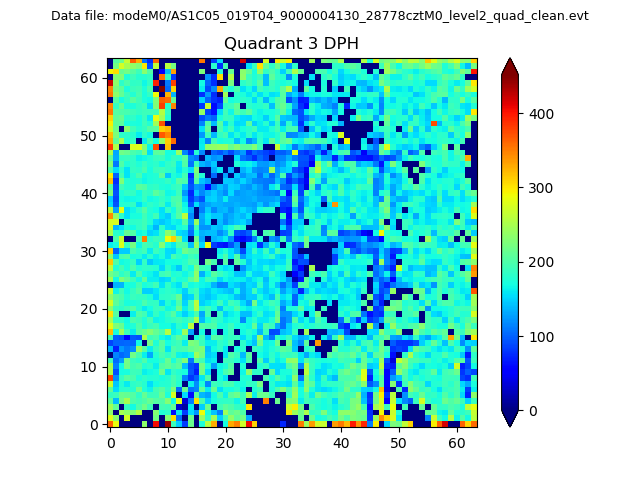 |
 |
Quadrant C |
| Plot type | Count rate plots | Images |
|---|---|---|
| Comparison with Poisson distribution Blue bars denote a histogram of data divided into 1 sec bins. Red curve is a Poisson curve with rate = median count rate of data. |
 |
 |
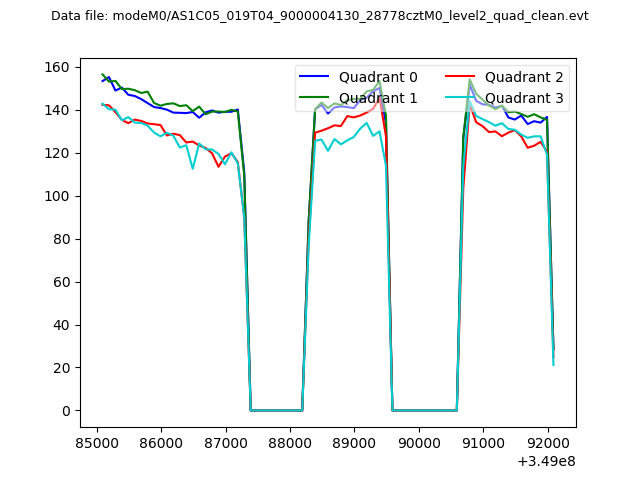
| Quadrant-wise count rates Data is divided into 100 sec bins |
 |
|
| Module-wise count rates for Quadrant A Data is divided into 100 sec bins |
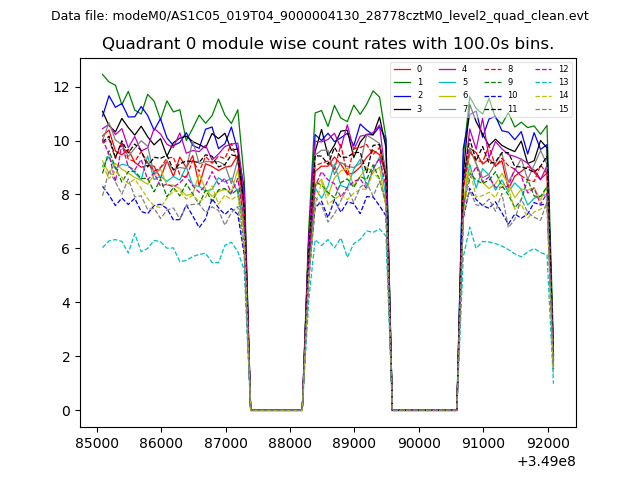 |
 |
| Module-wise count rates for Quadrant B Data is divided into 100 sec bins |
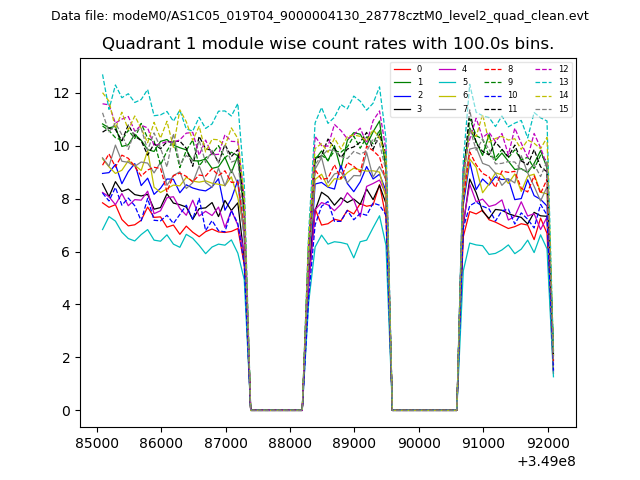 |
 |
| Module-wise count rates for Quadrant C Data is divided into 100 sec bins |
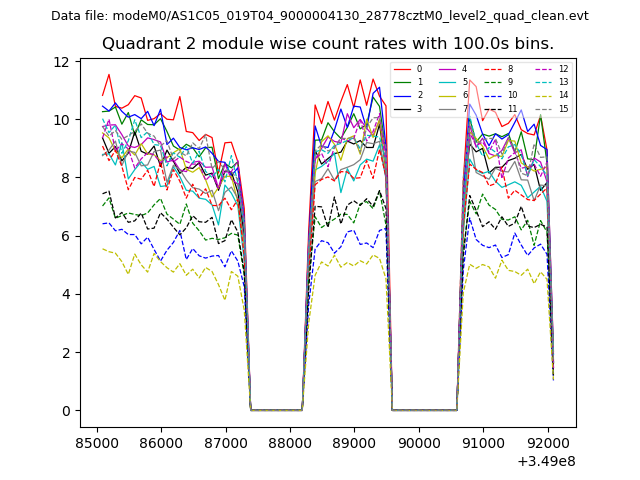 |
 |
| Module-wise count rates for Quadrant D Data is divided into 100 sec bins |
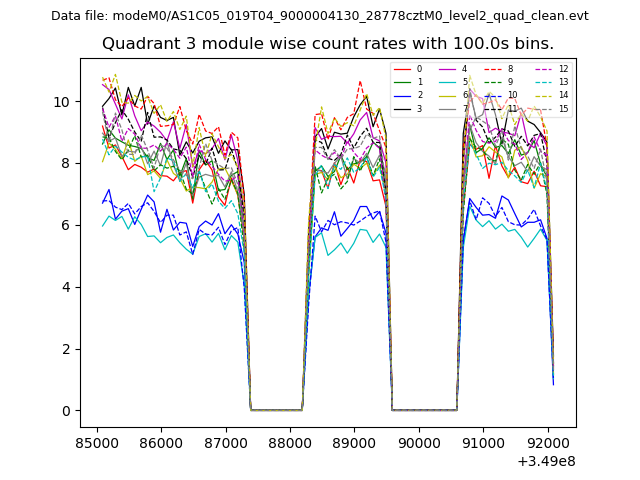 |
 |
| Parameter | Plot |
|---|---|
| CZT HV Monitor | 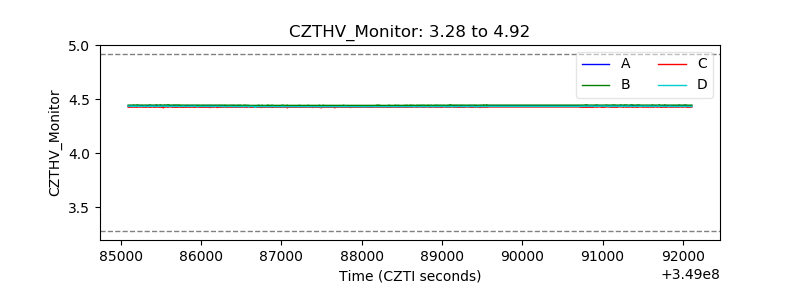 |
| D_VDD | 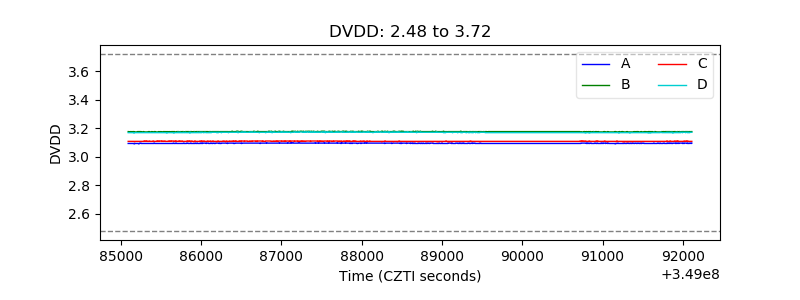 |
| Temperature 1 | 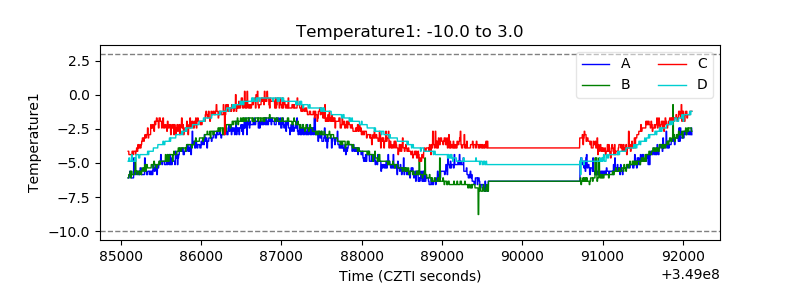 |
| Veto HV Monitor | 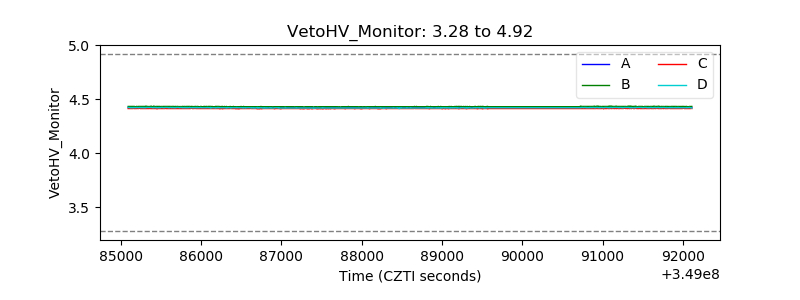 |
| Veto LLD | 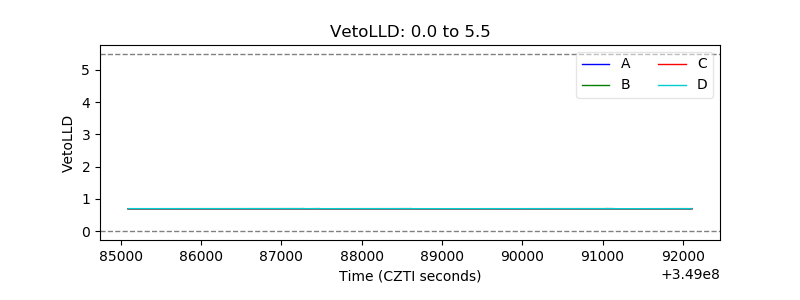 |
| Alpha Counter |  |
| _CPM_Rate | 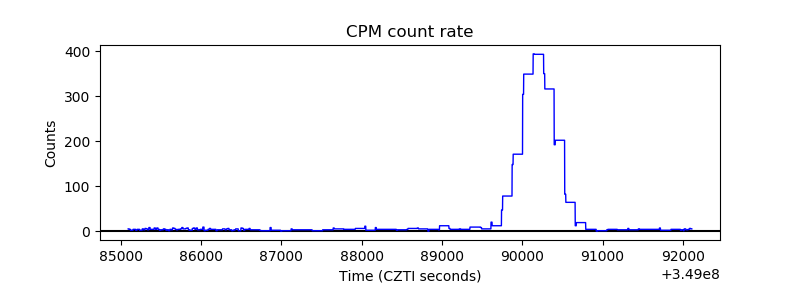 |
| CZT Counter | 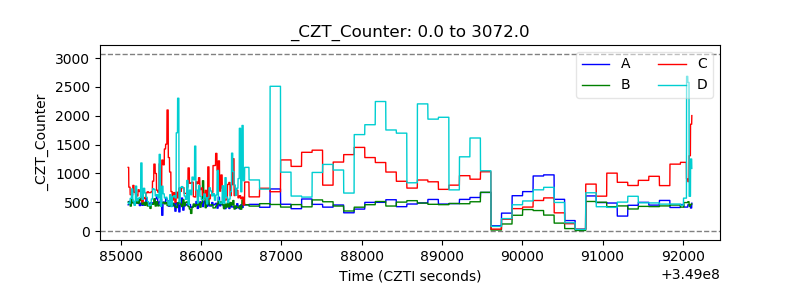 |
| +2.5 Volts monitor |  |
| +5 Volts monitor |  |
| _ROLL_ROT | 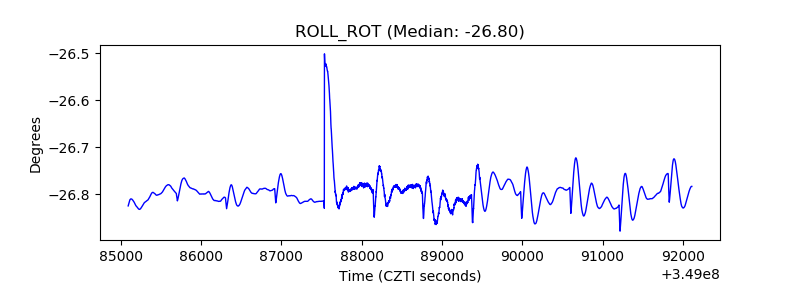 |
| _Roll_DEC | 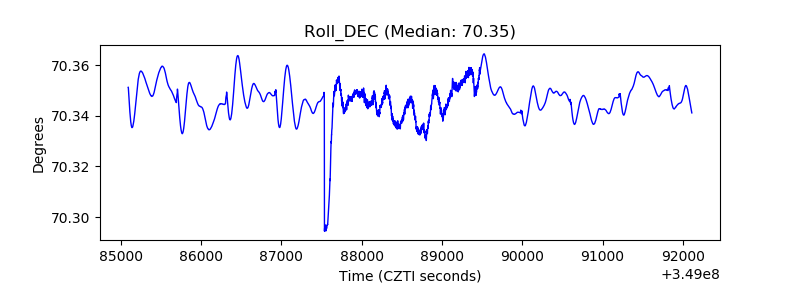 |
| _Roll_RA |  |
| Veto Counter | 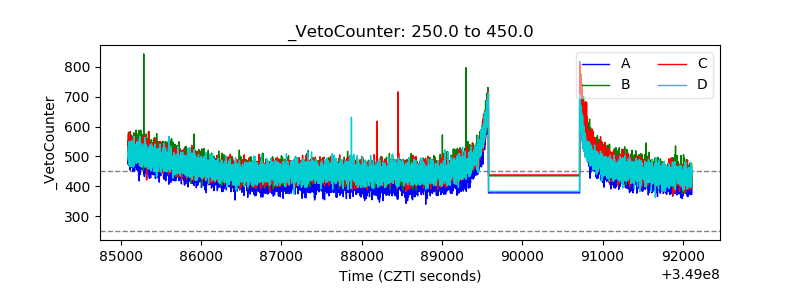 |