| Param | Original file | Final file |
|---|---|---|
| Filename | modeM0/AS1C05_019T04_9000004130_28779cztM0_level2.evt | modeM0/AS1C05_019T04_9000004130_28779cztM0_level2_quad_clean.evt |
| Size (bytes) | 645,390,720 | 103,734,720 |
| Size | 615.5 MB | 98.9 MB |
| Events in quadrant A | 2,954,853 | 708,217 |
| Events in quadrant B | 2,948,163 | 719,734 |
| Events in quadrant C | 8,015,144 | 635,967 |
| Events in quadrant D | 5,202,826 | 638,905 |
| Mode SS | |||
|---|---|---|---|
| Quadrant | BADHDUFLAG | Total packets | Discarded packets |
| A | 0 | 128 | 0 |
| B | 0 | 128 | 0 |
| C | 0 | 128 | 0 |
| D | 0 | 128 | 0 |
| Mode M9 | |||
|---|---|---|---|
| Quadrant | BADHDUFLAG | Total packets | Discarded packets |
| A | 0 | 7 | 0 |
| B | 0 | 7 | 0 |
| C | 0 | 7 | 0 |
| D | 0 | 7 | 0 |
| Mode M0 | |||
|---|---|---|---|
| Quadrant | BADHDUFLAG | Total packets | Discarded packets |
| A | 0 | 12827 | 2 |
| B | 0 | 12803 | 2 |
| C | 0 | 28279 | 2 |
| D | 0 | 19621 | 2 |
| Quadrant | Total seconds | Saturated seconds | Saturation percentage |
|---|---|---|---|
| A | 6280 | 93 | 1.480892% |
| B | 6281 | 87 | 1.385130% |
| C | 6281 | 1044 | 16.621557% |
| D | 6281 | 636 | 10.125776% |
Noise dominated data is calculated using 1-second bins in cleaned event files. If a bin has >2000 counts, and if more than 50% of those come from <1% of pixels, then it is considered to be noise-dominated and hence unusable.
| Quadrant | # 1 sec bins | Bins with >0 counts | Bins with >2000 counts | High rate bins dominated by noise | Noise dominated (total time) | Noise dominated (detector-on time) | Marked lightcurve |
|---|---|---|---|---|---|---|---|
| A | 7020 | 6281 | 0 | 0 | 0.00% | 0.00% | 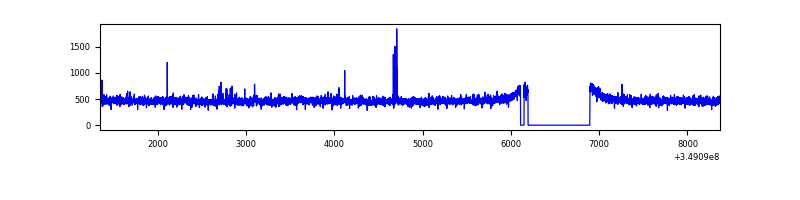 |
| B | 7021 | 6281 | 0 | 0 | 0.00% | 0.00% | 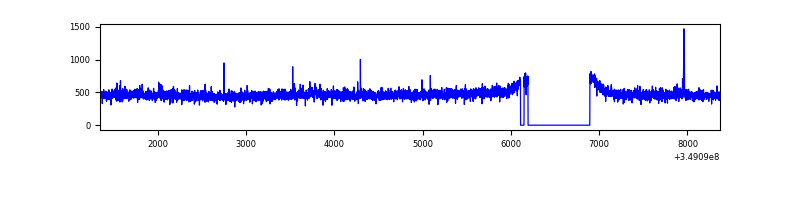 |
| C | 7021 | 6282 | 404 | 404 | 5.75% | 6.43% | 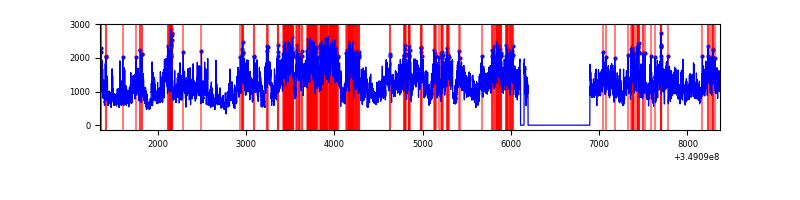 |
| D | 7021 | 6282 | 462 | 462 | 6.58% | 7.35% | 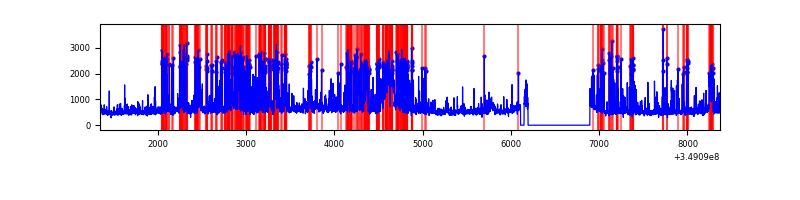 |
Top three noisy pixels from each quadrant. If the there are fewer than three noisy pixels in the level2.evt file, extra rows are filled as -1
| Pixel properties | Quadrant properties | ||||||
|---|---|---|---|---|---|---|---|
| Quadrant | DetID | PixID | Counts | Sigma | Mean | Median | Sigma |
| A | 15 | 174 | 16009 | 99.75 | 759 | 743 | 153.0 |
| A | 13 | 254 | 10586 | 64.32 | 759 | 743 | 153.0 |
| A | 3 | 137 | 7261 | 42.59 | 759 | 743 | 153.0 |
| B | 12 | 111 | 17129 | 114.86 | 747 | 728 | 142.8 |
| B | 11 | 111 | 15926 | 106.44 | 747 | 728 | 142.8 |
| B | 14 | 111 | 14431 | 95.97 | 747 | 728 | 142.8 |
| C | 3 | 233 | 5131446 | 32513.86 | 687 | 689 | 157.8 |
| C | 14 | 238 | 124265 | 783.11 | 687 | 689 | 157.8 |
| C | 4 | 254 | 34700 | 215.53 | 687 | 689 | 157.8 |
| D | 1 | 52 | 1840272 | 11001.08 | 703 | 683 | 167.2 |
| D | 8 | 195 | 629072 | 3757.88 | 703 | 683 | 167.2 |
| D | 7 | 238 | 32115 | 187.97 | 703 | 683 | 167.2 |
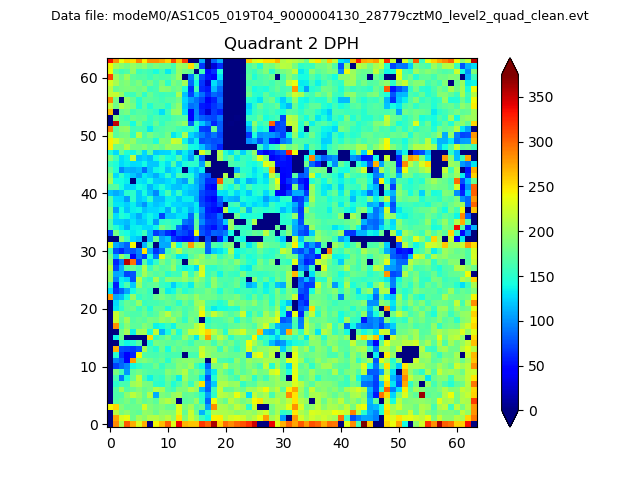
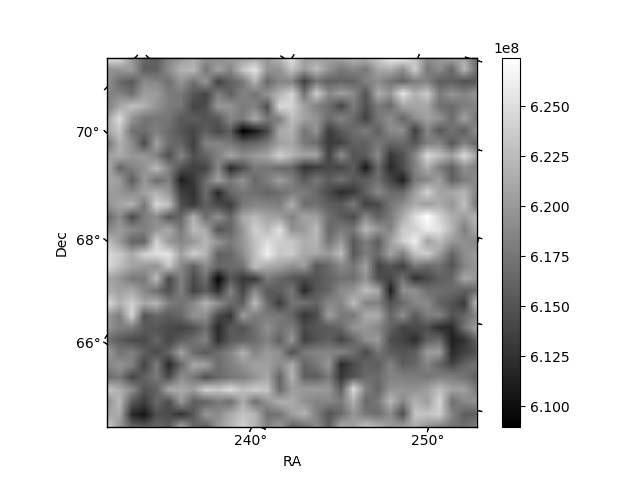
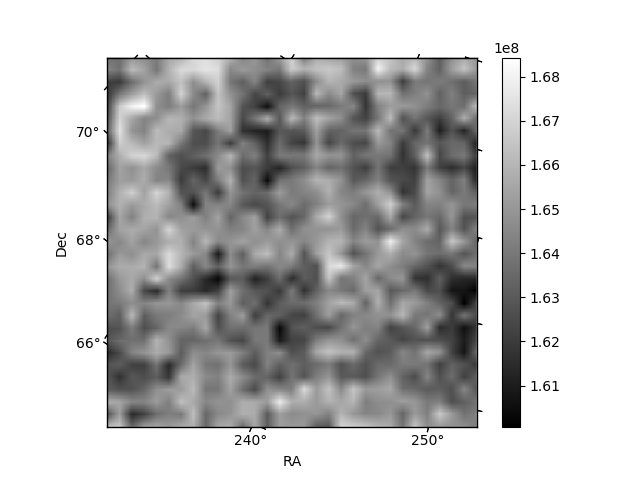
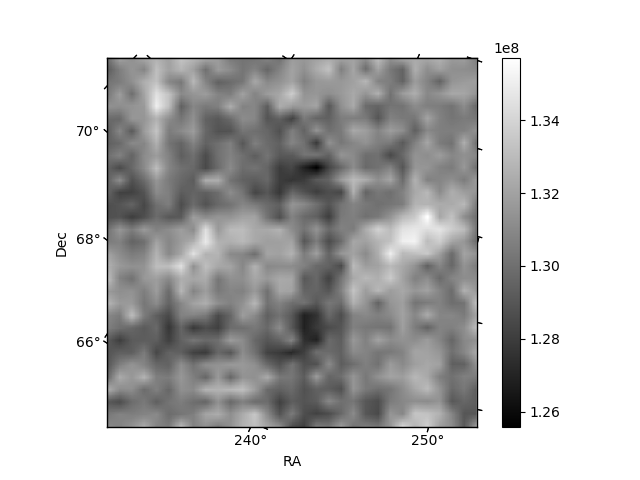
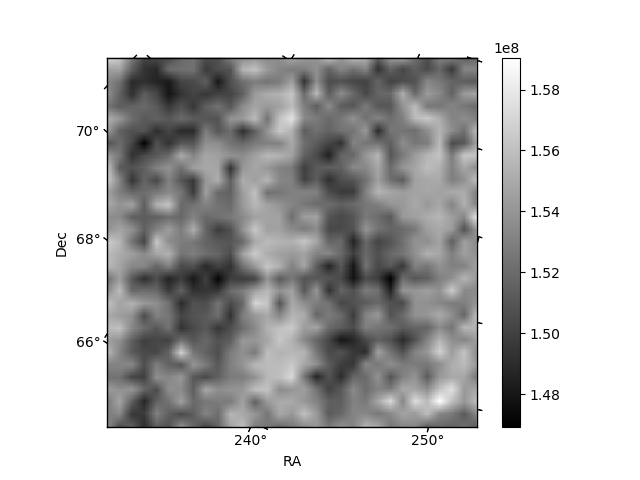
Histogram calculated using DETX and DETY for each event in the final _common_clean file
| Quadrant A | 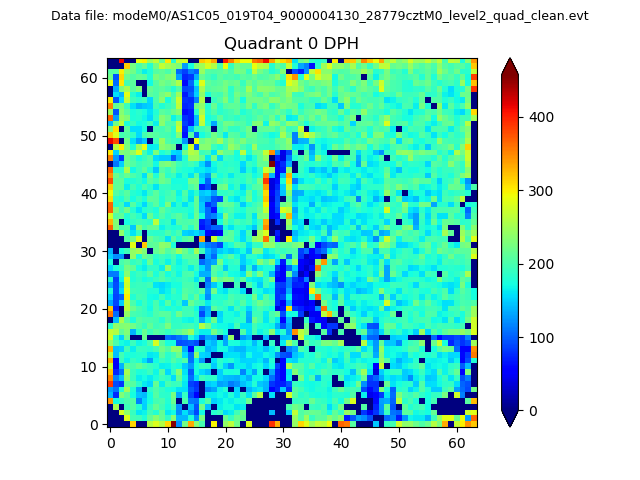 |
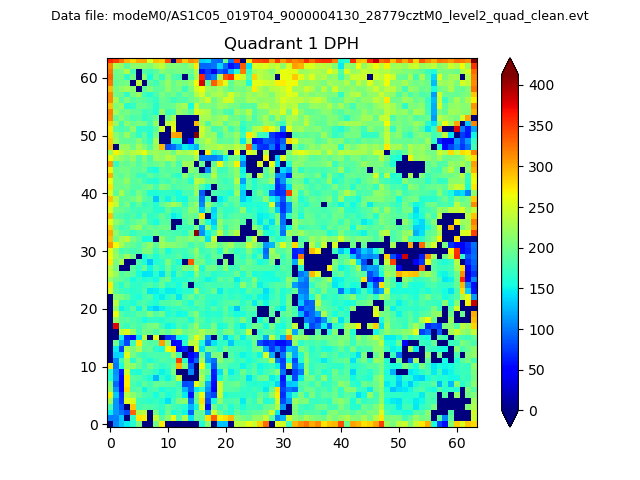 |
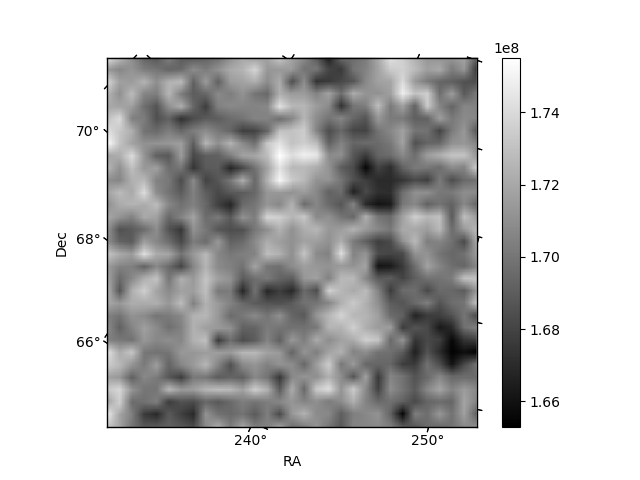
Quadrant B |
|---|---|---|---|
| Quadrant D | 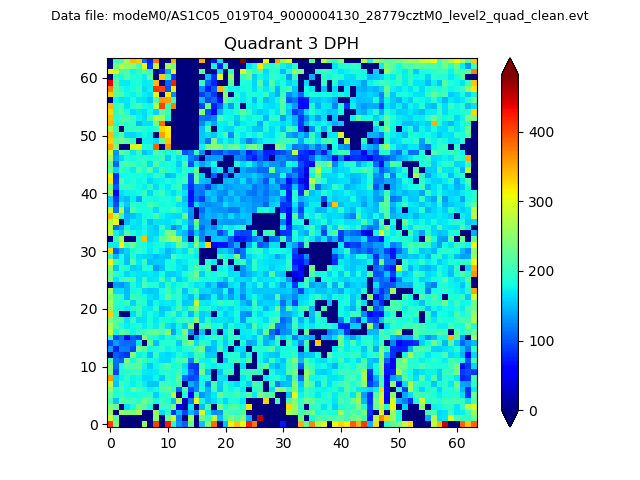 |
 |
Quadrant C |
| Plot type | Count rate plots | Images |
|---|---|---|
| Comparison with Poisson distribution Blue bars denote a histogram of data divided into 1 sec bins. Red curve is a Poisson curve with rate = median count rate of data. |
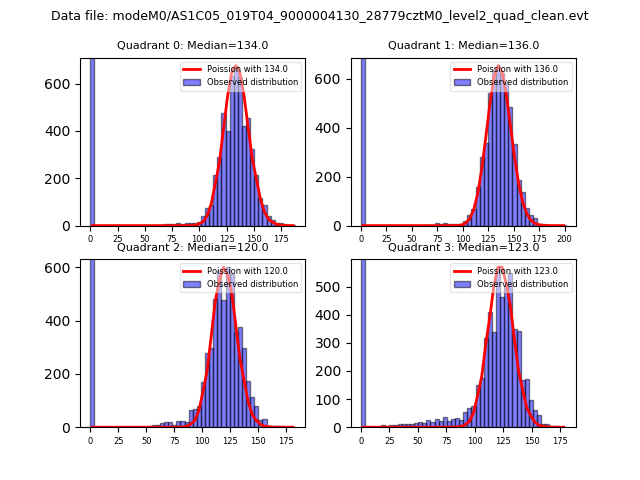 |
 |
| Quadrant-wise count rates Data is divided into 100 sec bins |
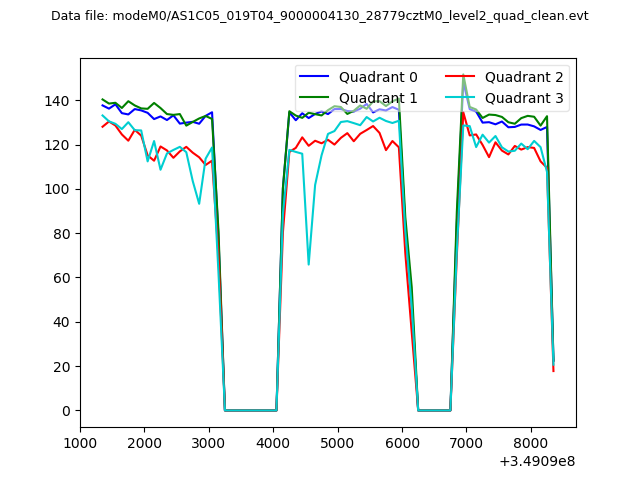 |
|
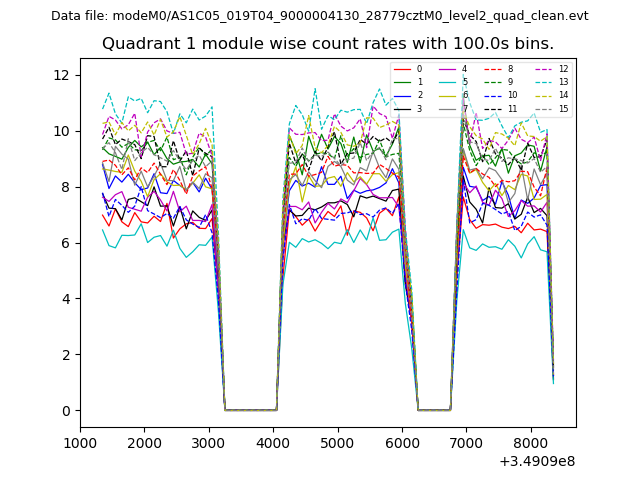
| Module-wise count rates for Quadrant A Data is divided into 100 sec bins |
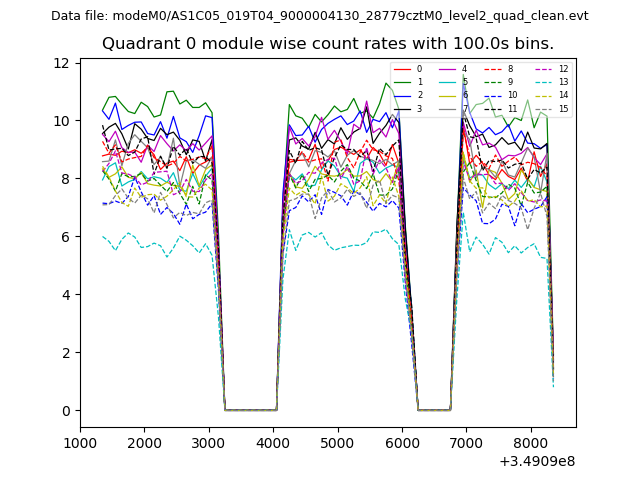 |
 |
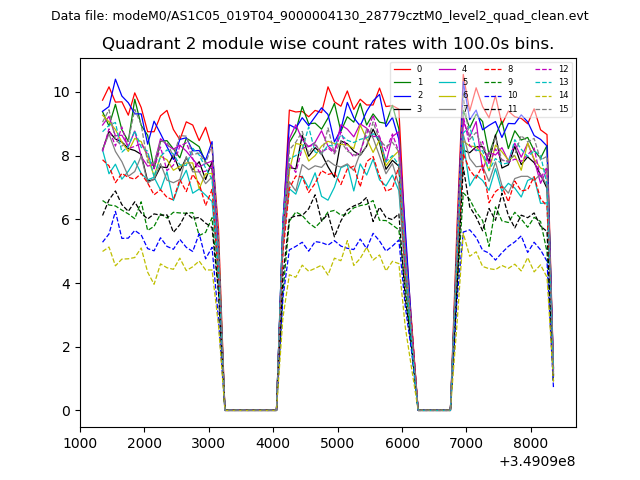
| Module-wise count rates for Quadrant B Data is divided into 100 sec bins |
 |
 |
| Module-wise count rates for Quadrant C Data is divided into 100 sec bins |
 |
 |
| Module-wise count rates for Quadrant D Data is divided into 100 sec bins |
 |
 |
| Parameter | Plot |
|---|---|
| CZT HV Monitor | 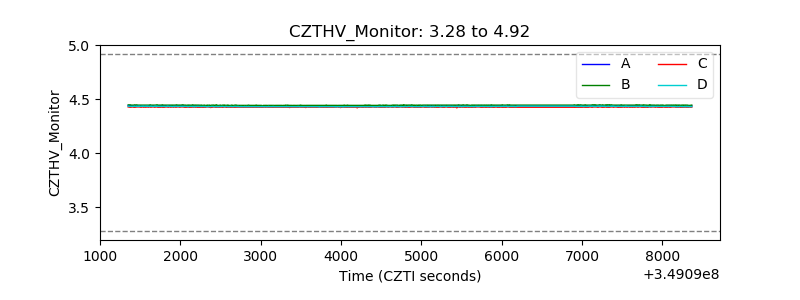 |
| D_VDD | 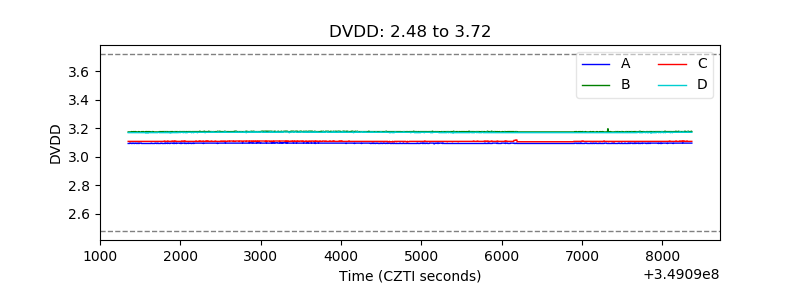 |
| Temperature 1 | 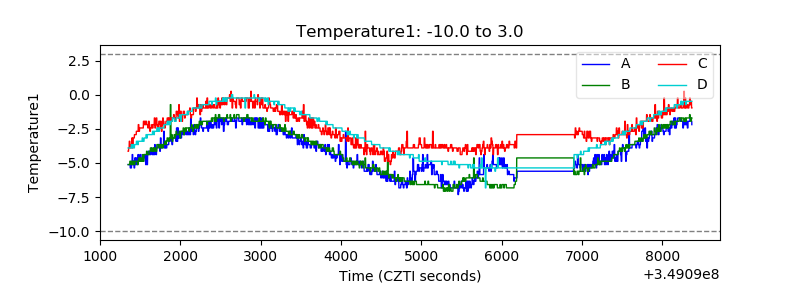 |
| Veto HV Monitor | 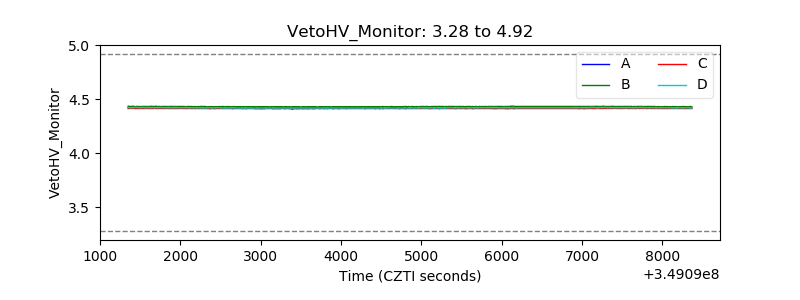 |
| Veto LLD |  |
| Alpha Counter | 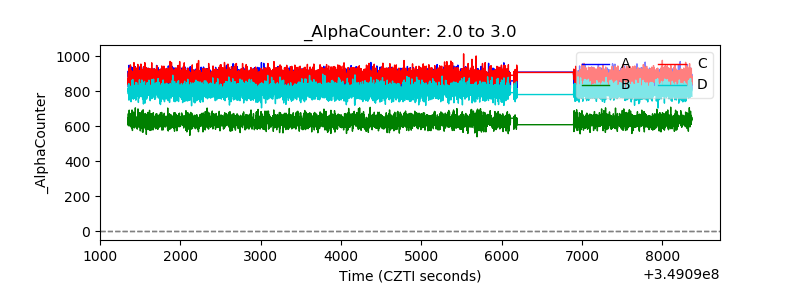 |
| _CPM_Rate | 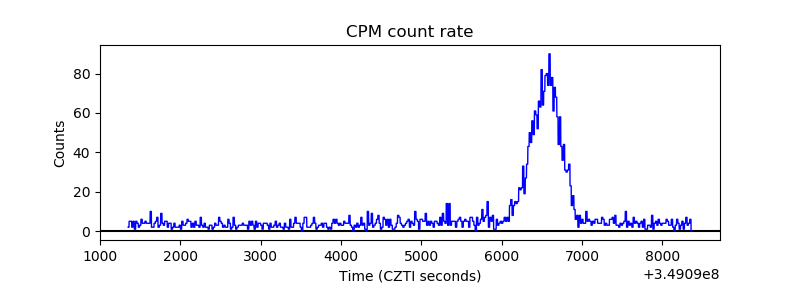 |
| CZT Counter | 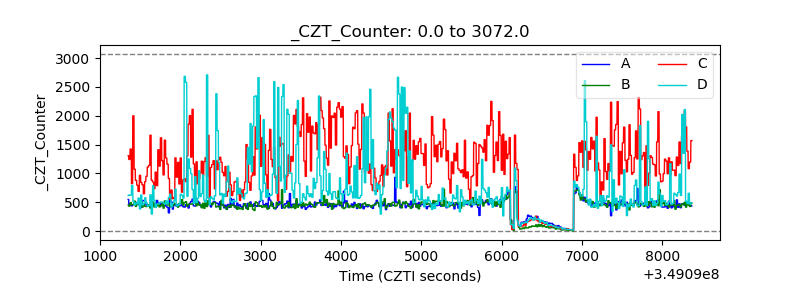 |
| +2.5 Volts monitor |  |
| +5 Volts monitor |  |
| _ROLL_ROT |  |
| _Roll_DEC | 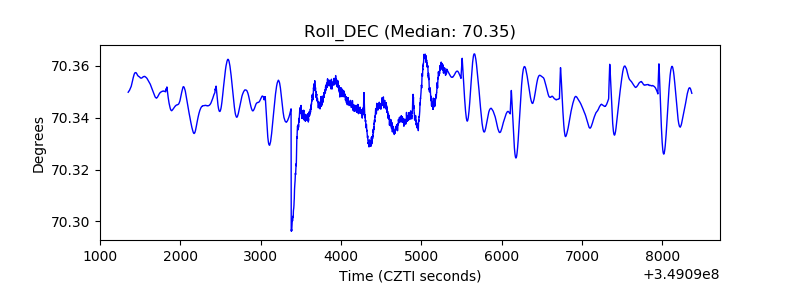 |
| _Roll_RA | 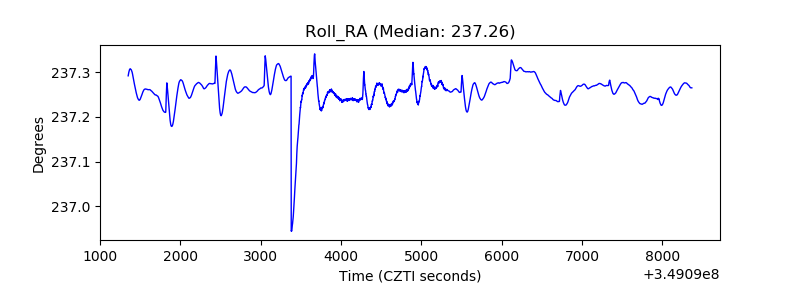 |
| Veto Counter | 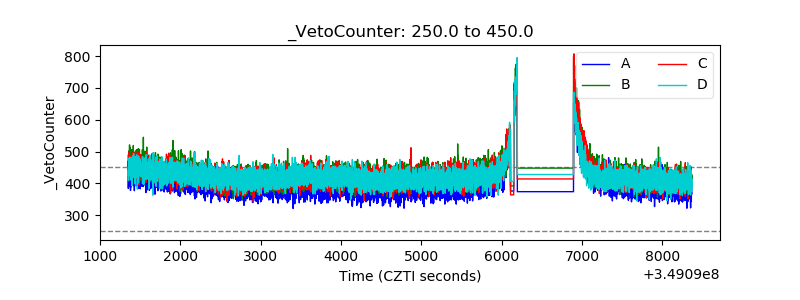 |