| Param | Original file | Final file |
|---|---|---|
| Filename | modeM0/AS1C05_019T04_9000004130_28780cztM0_level2.evt | modeM0/AS1C05_019T04_9000004130_28780cztM0_level2_quad_clean.evt |
| Size (bytes) | 742,060,800 | 108,835,200 |
| Size | 707.7 MB | 103.8 MB |
| Events in quadrant A | 3,151,277 | 752,355 |
| Events in quadrant B | 3,188,713 | 765,613 |
| Events in quadrant C | 7,829,579 | 643,375 |
| Events in quadrant D | 7,846,147 | 661,659 |
| Mode SS | |||
|---|---|---|---|
| Quadrant | BADHDUFLAG | Total packets | Discarded packets |
| A | 0 | 136 | 0 |
| B | 0 | 136 | 0 |
| C | 0 | 136 | 0 |
| D | 0 | 136 | 0 |
| Mode M9 | |||
|---|---|---|---|
| Quadrant | BADHDUFLAG | Total packets | Discarded packets |
| A | 0 | 3 | 0 |
| B | 0 | 3 | 0 |
| C | 0 | 3 | 0 |
| D | 0 | 3 | 0 |
| Mode M0 | |||
|---|---|---|---|
| Quadrant | BADHDUFLAG | Total packets | Discarded packets |
| A | 0 | 13881 | 1 |
| B | 0 | 13944 | 1 |
| C | 0 | 27985 | 1 |
| D | 0 | 27957 | 1 |
| Quadrant | Total seconds | Saturated seconds | Saturation percentage |
|---|---|---|---|
| A | 6776 | 130 | 1.918536% |
| B | 6777 | 133 | 1.962520% |
| C | 6777 | 1572 | 23.196104% |
| D | 6777 | 1065 | 15.714918% |
Noise dominated data is calculated using 1-second bins in cleaned event files. If a bin has >2000 counts, and if more than 50% of those come from <1% of pixels, then it is considered to be noise-dominated and hence unusable.
| Quadrant | # 1 sec bins | Bins with >0 counts | Bins with >2000 counts | High rate bins dominated by noise | Noise dominated (total time) | Noise dominated (detector-on time) | Marked lightcurve |
|---|---|---|---|---|---|---|---|
| A | 7021 | 6776 | 0 | 0 | 0.00% | 0.00% | 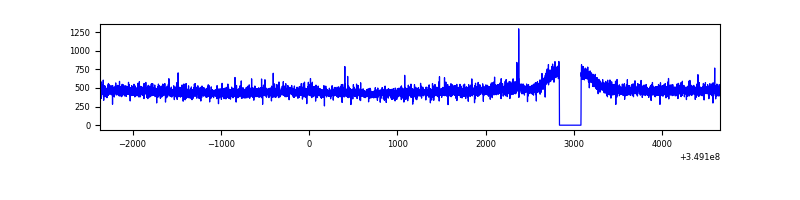 |
| B | 7022 | 6778 | 4 | 4 | 0.06% | 0.06% | 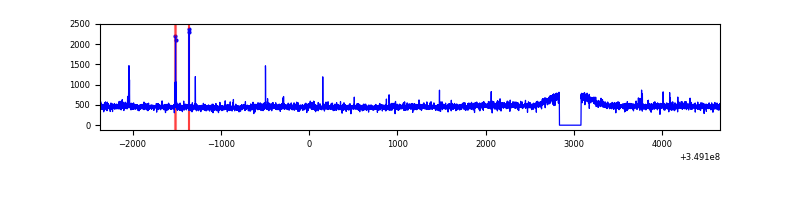 |
| C | 7022 | 6777 | 449 | 449 | 6.39% | 6.63% | 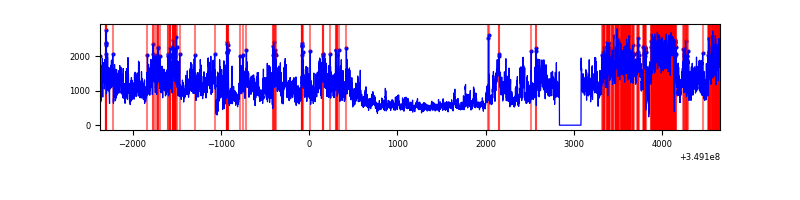 |
| D | 7021 | 6776 | 907 | 907 | 12.92% | 13.39% | 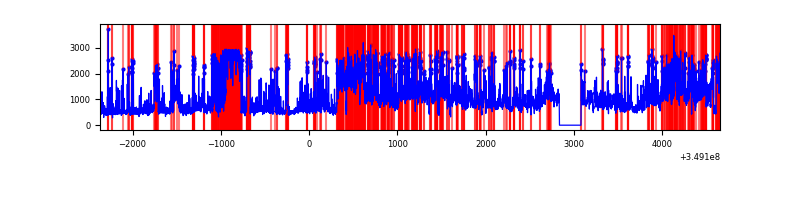 |
Top three noisy pixels from each quadrant. If the there are fewer than three noisy pixels in the level2.evt file, extra rows are filled as -1
| Pixel properties | Quadrant properties | ||||||
|---|---|---|---|---|---|---|---|
| Quadrant | DetID | PixID | Counts | Sigma | Mean | Median | Sigma |
| A | 13 | 254 | 12281 | 70.01 | 813 | 795 | 164.1 |
| A | 3 | 137 | 7954 | 43.63 | 813 | 795 | 164.1 |
| A | 0 | 226 | 6948 | 37.5 | 813 | 795 | 164.1 |
| B | 12 | 111 | 18699 | 115.79 | 804 | 784 | 154.7 |
| B | 11 | 111 | 17248 | 106.41 | 804 | 784 | 154.7 |
| B | 0 | 156 | 16022 | 98.49 | 804 | 784 | 154.7 |
| C | 3 | 233 | 4648546 | 28144.2 | 715 | 718 | 165.1 |
| C | 14 | 238 | 213246 | 1286.93 | 715 | 718 | 165.1 |
| C | 14 | 254 | 143066 | 861.97 | 715 | 718 | 165.1 |
| D | 8 | 195 | 3180158 | 18158.08 | 736 | 715 | 175.1 |
| D | 1 | 52 | 1746877 | 9972.49 | 736 | 715 | 175.1 |
| D | 12 | 233 | 88253 | 499.94 | 736 | 715 | 175.1 |
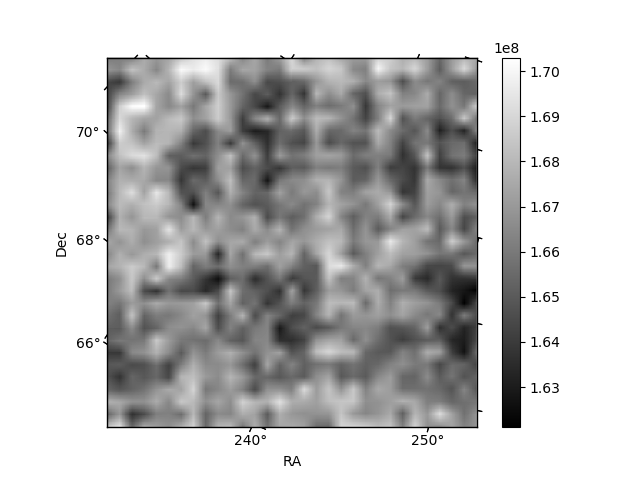
Histogram calculated using DETX and DETY for each event in the final _common_clean file
| Quadrant A |  |
 |
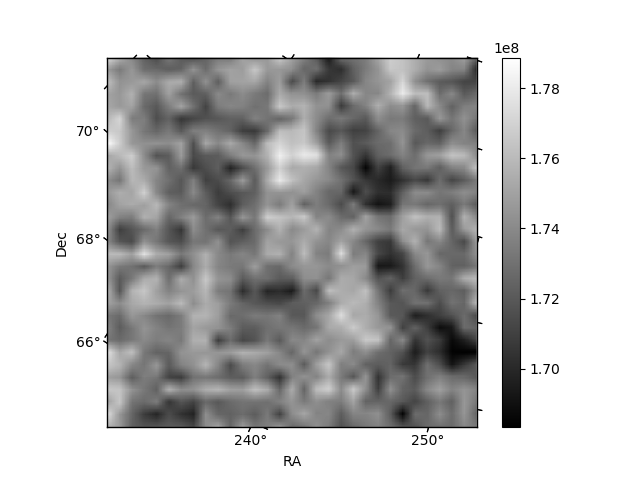
Quadrant B |
|---|---|---|---|
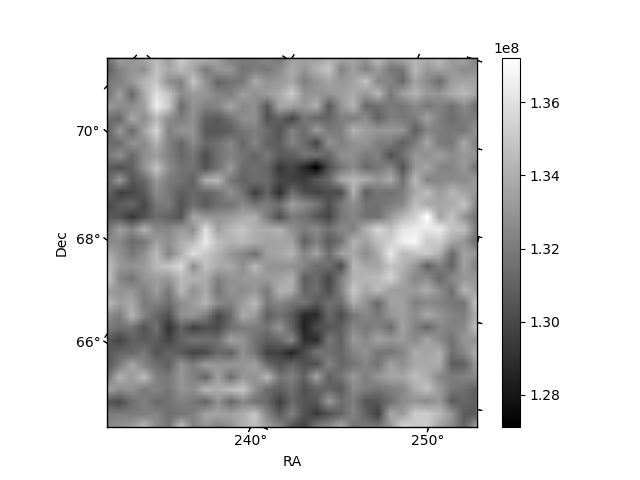
| Quadrant D |  |
 |
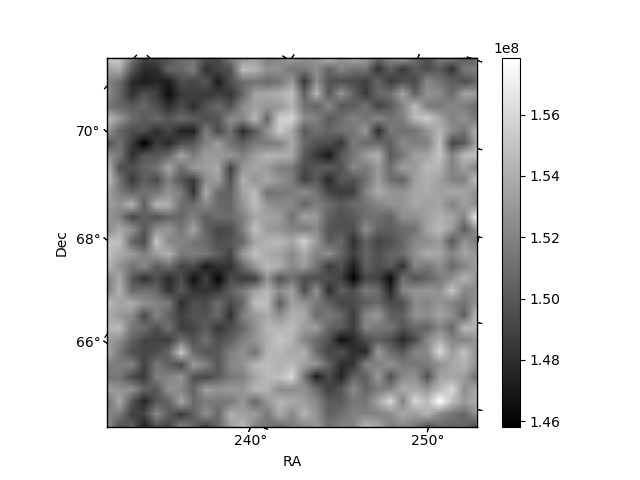
Quadrant C |
| Plot type | Count rate plots | Images |
|---|---|---|
| Comparison with Poisson distribution Blue bars denote a histogram of data divided into 1 sec bins. Red curve is a Poisson curve with rate = median count rate of data. |
 |
 |
| Quadrant-wise count rates Data is divided into 100 sec bins |
 |
|
| Module-wise count rates for Quadrant A Data is divided into 100 sec bins |
 |
 |
| Module-wise count rates for Quadrant B Data is divided into 100 sec bins |
 |
 |
| Module-wise count rates for Quadrant C Data is divided into 100 sec bins |
 |
 |
| Module-wise count rates for Quadrant D Data is divided into 100 sec bins |
 |
 |
| Parameter | Plot |
|---|---|
| CZT HV Monitor |  |
| D_VDD | 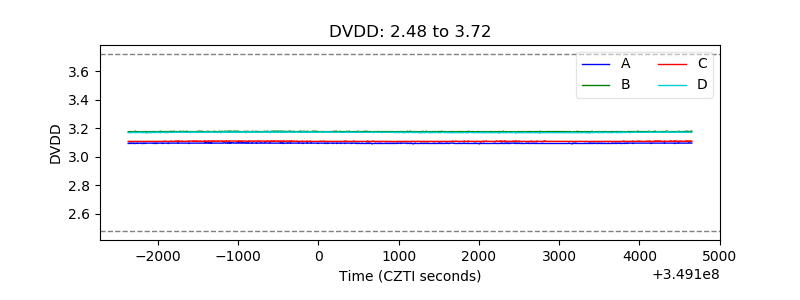 |
| Temperature 1 |  |
| Veto HV Monitor |  |
| Veto LLD |  |
| Alpha Counter |  |
| _CPM_Rate |  |
| CZT Counter |  |
| +2.5 Volts monitor |  |
| +5 Volts monitor |  |
| _ROLL_ROT |  |
| _Roll_DEC |  |
| _Roll_RA |  |
| Veto Counter |  |