| Param | Original file | Final file |
|---|---|---|
| Filename | modeM0/AS1C05_019T04_9000004130_28781cztM0_level2.evt | modeM0/AS1C05_019T04_9000004130_28781cztM0_level2_quad_clean.evt |
| Size (bytes) | 773,873,280 | 112,662,720 |
| Size | 738.0 MB | 107.4 MB |
| Events in quadrant A | 3,521,509 | 768,626 |
| Events in quadrant B | 3,542,405 | 782,953 |
| Events in quadrant C | 7,788,748 | 647,333 |
| Events in quadrant D | 8,080,954 | 694,564 |
| Mode SS | |||
|---|---|---|---|
| Quadrant | BADHDUFLAG | Total packets | Discarded packets |
| A | 0 | 150 | 0 |
| B | 0 | 150 | 0 |
| C | 0 | 150 | 0 |
| D | 0 | 150 | 0 |
| Mode M0 | |||
|---|---|---|---|
| Quadrant | BADHDUFLAG | Total packets | Discarded packets |
| A | 0 | 15412 | 2 |
| B | 0 | 15400 | 2 |
| C | 0 | 28150 | 2 |
| D | 0 | 29157 | 2 |
| Quadrant | Total seconds | Saturated seconds | Saturation percentage |
|---|---|---|---|
| A | 7428 | 157 | 2.113624% |
| B | 7429 | 198 | 2.665231% |
| C | 7429 | 2136 | 28.752187% |
| D | 7429 | 1289 | 17.350922% |
Noise dominated data is calculated using 1-second bins in cleaned event files. If a bin has >2000 counts, and if more than 50% of those come from <1% of pixels, then it is considered to be noise-dominated and hence unusable.
| Quadrant | # 1 sec bins | Bins with >0 counts | Bins with >2000 counts | High rate bins dominated by noise | Noise dominated (total time) | Noise dominated (detector-on time) | Marked lightcurve |
|---|---|---|---|---|---|---|---|
| A | 7488 | 7428 | 0 | 0 | 0.00% | 0.00% | 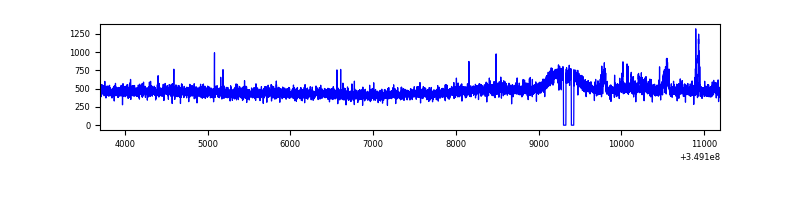 |
| B | 7489 | 7429 | 3 | 3 | 0.04% | 0.04% | 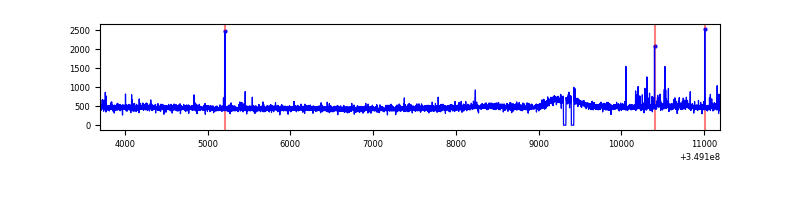 |
| C | 7489 | 7429 | 683 | 683 | 9.12% | 9.19% | 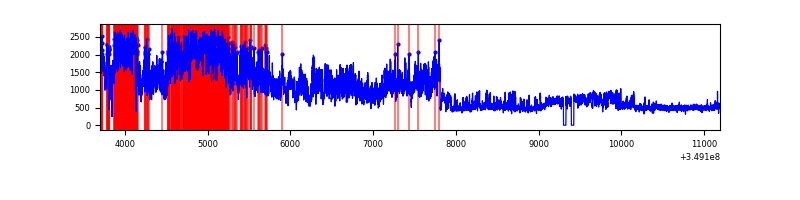 |
| D | 7489 | 7430 | 1142 | 1142 | 15.25% | 15.37% | 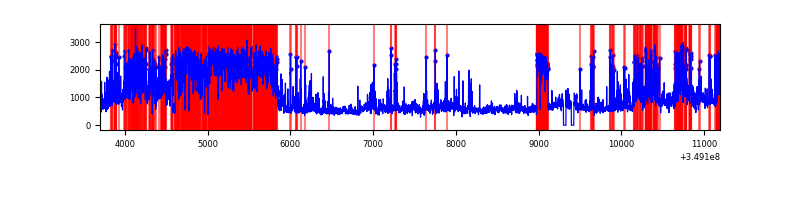 |
Top three noisy pixels from each quadrant. If the there are fewer than three noisy pixels in the level2.evt file, extra rows are filled as -1
| Pixel properties | Quadrant properties | ||||||
|---|---|---|---|---|---|---|---|
| Quadrant | DetID | PixID | Counts | Sigma | Mean | Median | Sigma |
| A | 15 | 174 | 55679 | 301.94 | 894 | 874 | 181.5 |
| A | 13 | 254 | 14584 | 75.53 | 894 | 874 | 181.5 |
| A | 3 | 137 | 8688 | 43.05 | 894 | 874 | 181.5 |
| B | 0 | 156 | 33665 | 194.44 | 881 | 857 | 168.7 |
| B | 12 | 111 | 20759 | 117.95 | 881 | 857 | 168.7 |
| B | 11 | 111 | 19026 | 107.68 | 881 | 857 | 168.7 |
| C | 3 | 233 | 4067636 | 22721.91 | 769 | 771 | 179.0 |
| C | 14 | 238 | 363242 | 2025.15 | 769 | 771 | 179.0 |
| C | 14 | 254 | 346462 | 1931.4 | 769 | 771 | 179.0 |
| D | 8 | 195 | 3500072 | 17695.85 | 826 | 804 | 197.7 |
| D | 1 | 52 | 1331010 | 6726.87 | 826 | 804 | 197.7 |
| D | 2 | 250 | 82037 | 410.8 | 826 | 804 | 197.7 |
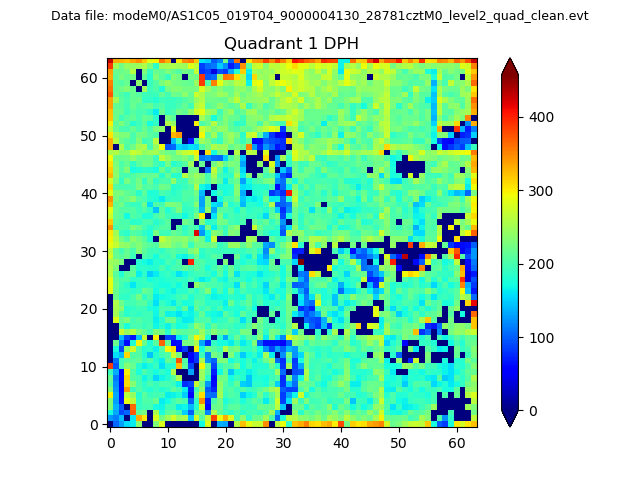
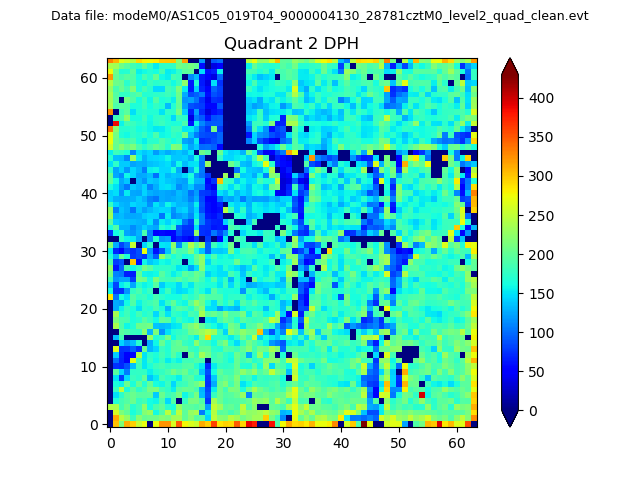
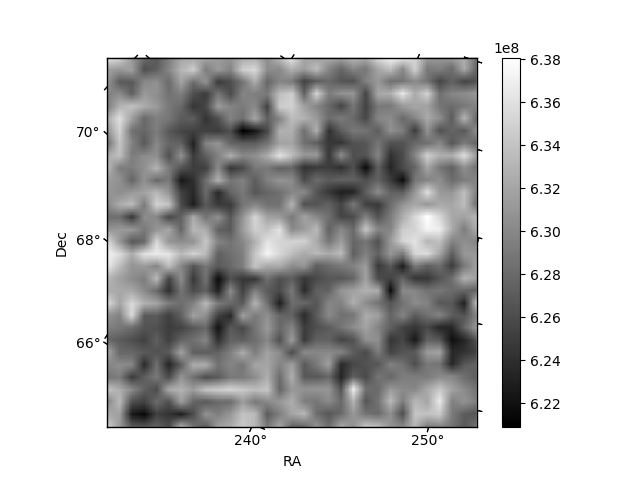
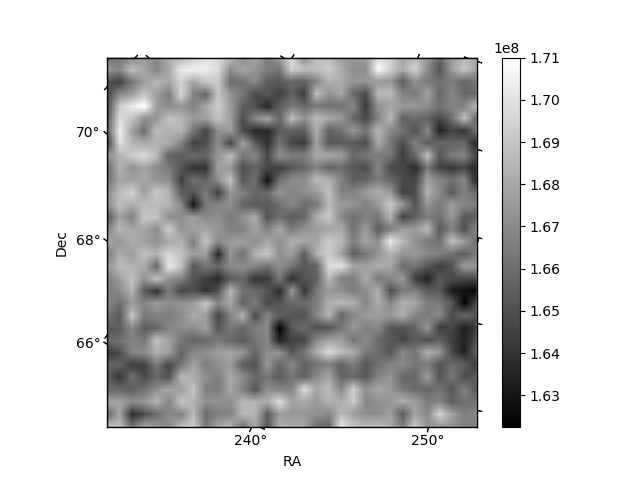
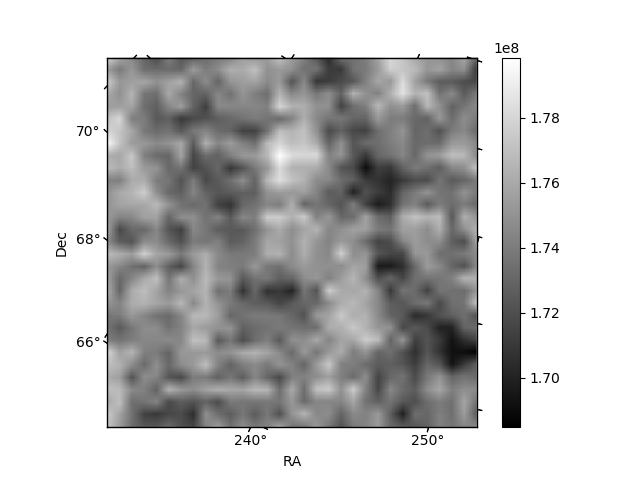
Histogram calculated using DETX and DETY for each event in the final _common_clean file
| Quadrant A |  |
 |
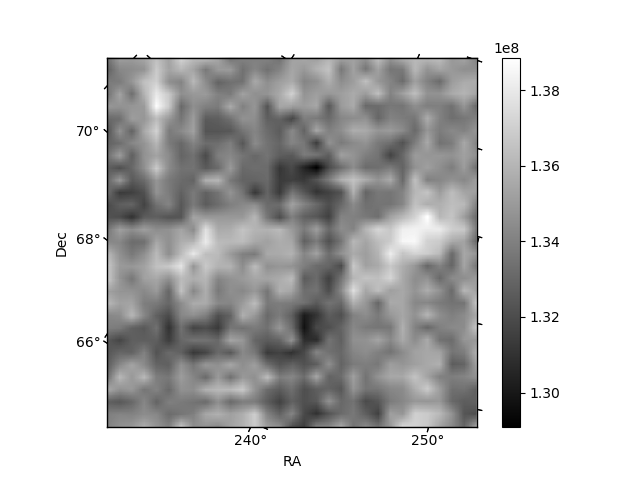
Quadrant B |
|---|---|---|---|
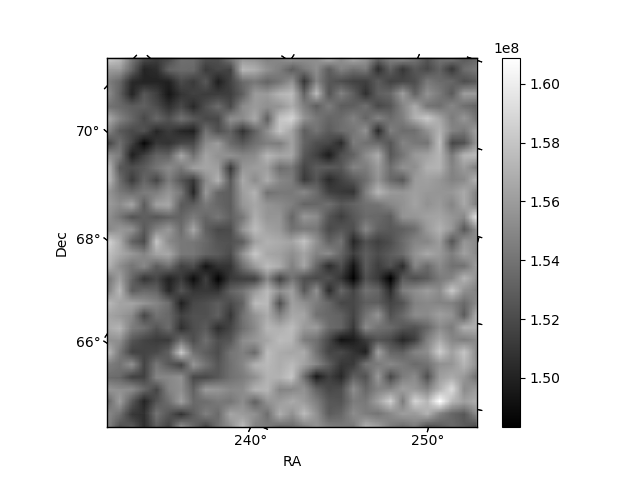
| Quadrant D | 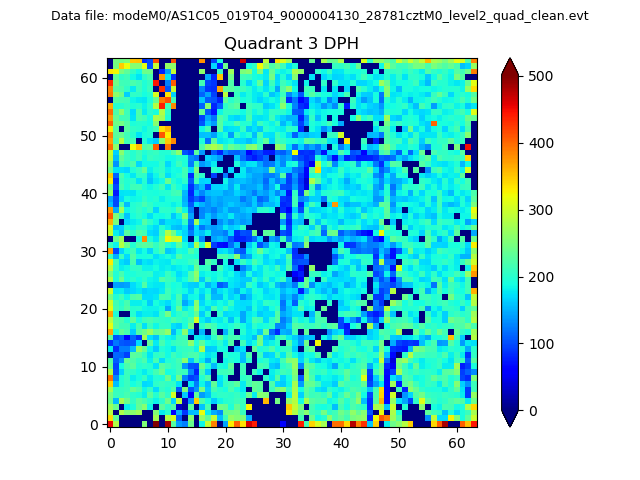 |
 |
Quadrant C |
| Plot type | Count rate plots | Images |
|---|---|---|
| Comparison with Poisson distribution Blue bars denote a histogram of data divided into 1 sec bins. Red curve is a Poisson curve with rate = median count rate of data. |
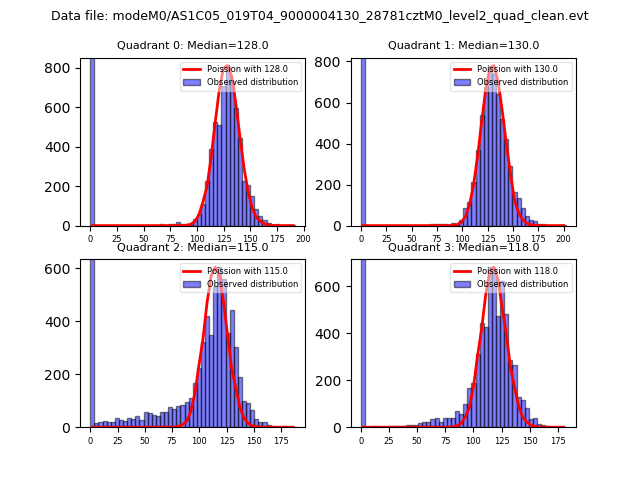 |
 |
| Quadrant-wise count rates Data is divided into 100 sec bins |
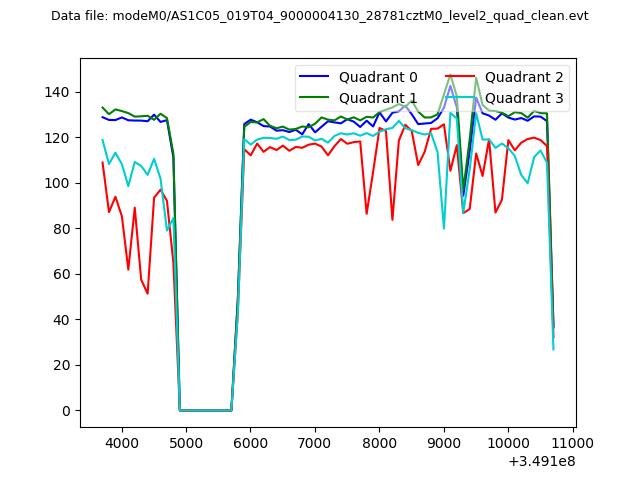 |
|
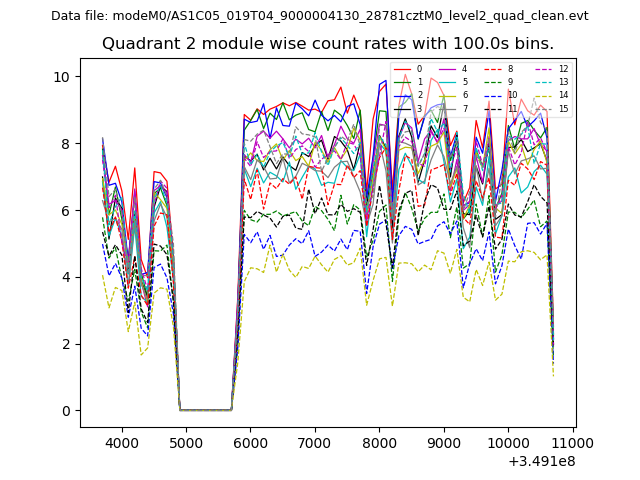
| Module-wise count rates for Quadrant A Data is divided into 100 sec bins |
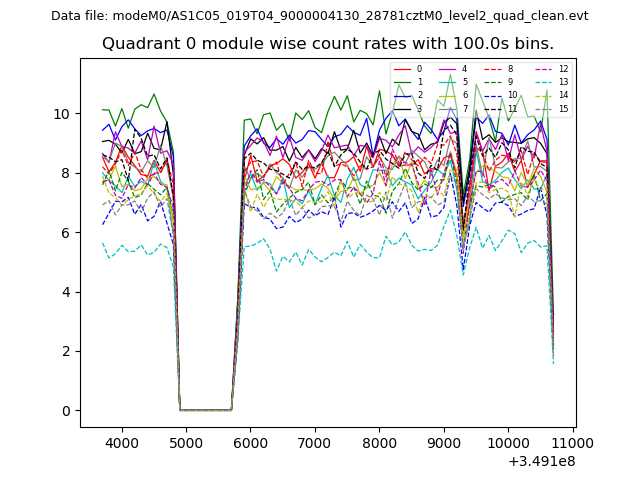 |
 |
| Module-wise count rates for Quadrant B Data is divided into 100 sec bins |
 |
 |
| Module-wise count rates for Quadrant C Data is divided into 100 sec bins |
 |
 |
| Module-wise count rates for Quadrant D Data is divided into 100 sec bins |
 |
 |
| Parameter | Plot |
|---|---|
| CZT HV Monitor | 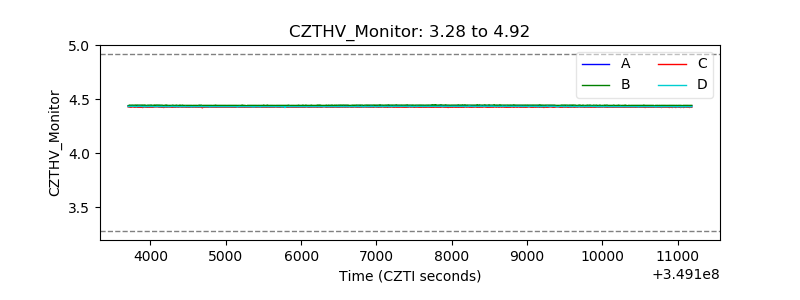 |
| D_VDD | 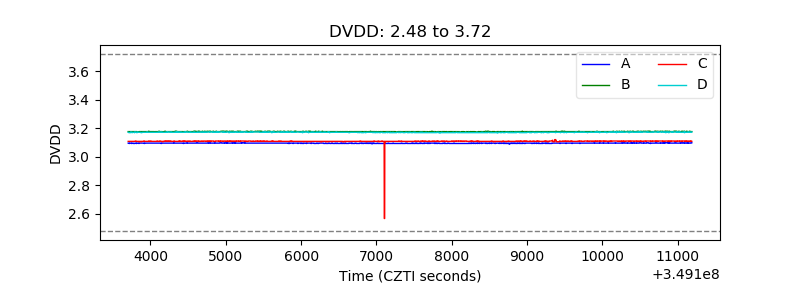 |
| Temperature 1 | 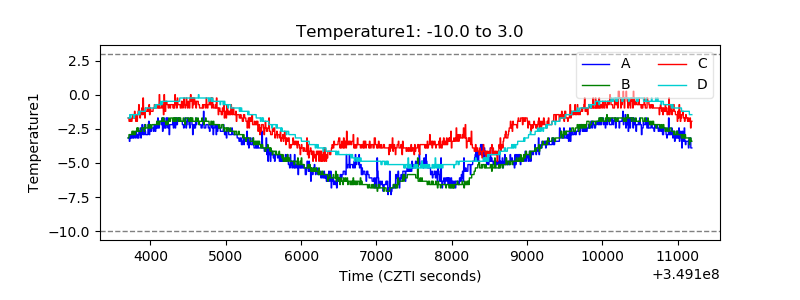 |
| Veto HV Monitor | 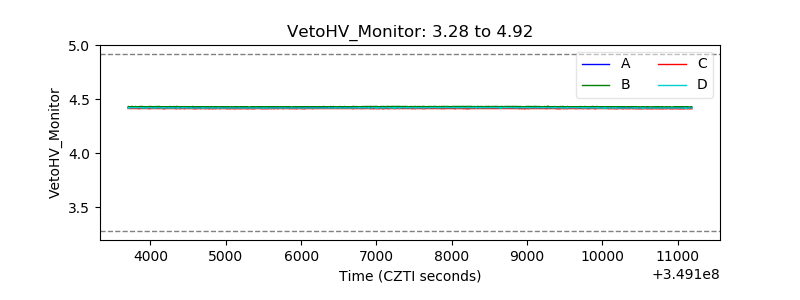 |
| Veto LLD | 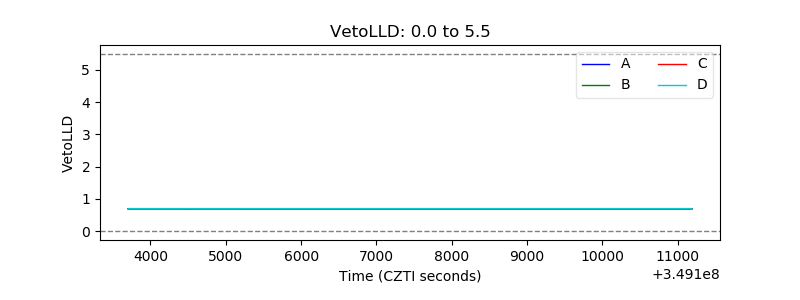 |
| Alpha Counter | 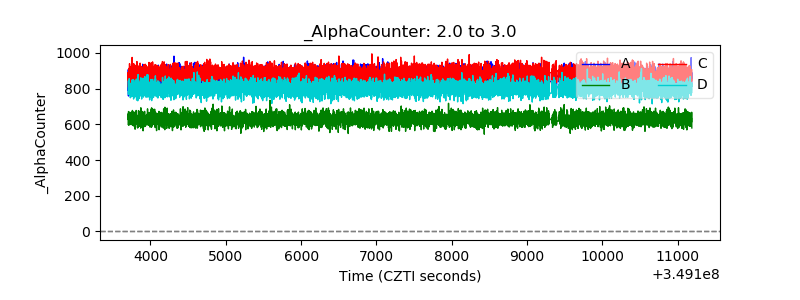 |
| _CPM_Rate | 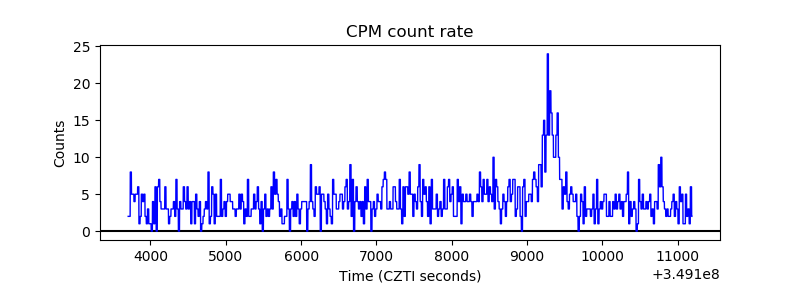 |
| CZT Counter | 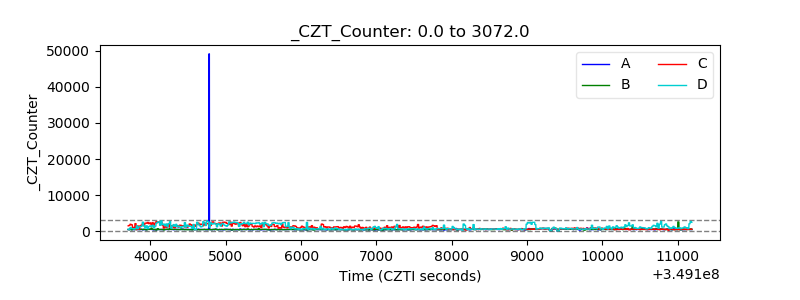 |
| +2.5 Volts monitor |  |
| +5 Volts monitor |  |
| _ROLL_ROT | 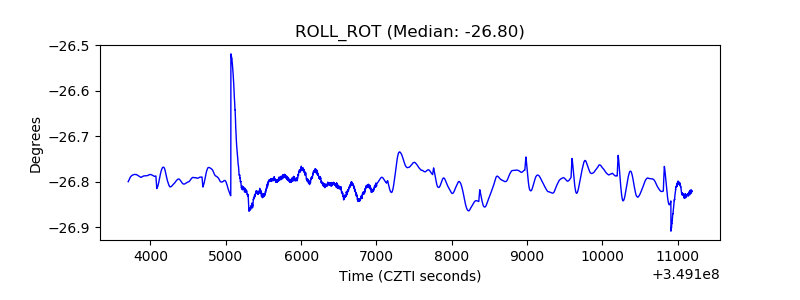 |
| _Roll_DEC | 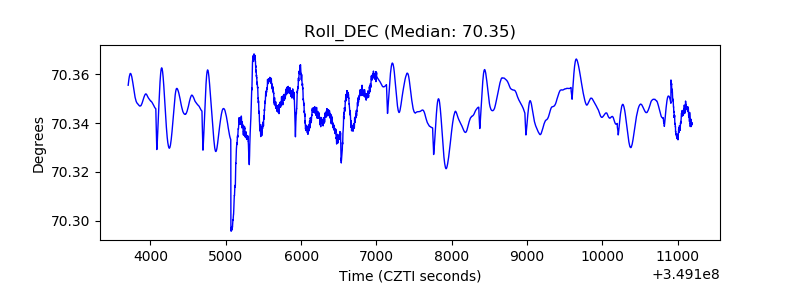 |
| _Roll_RA | 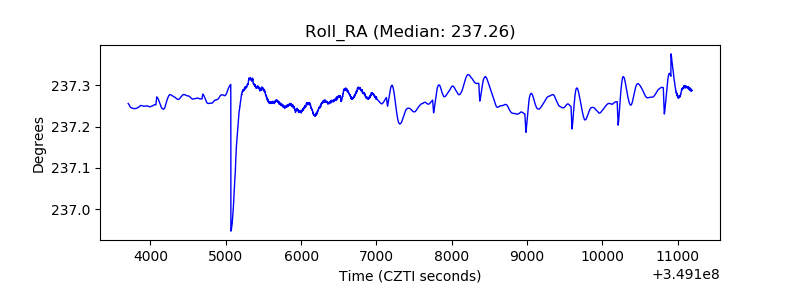 |
| Veto Counter | 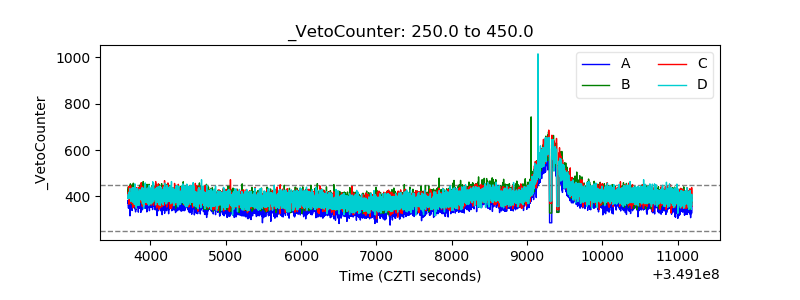 |