| Param | Original file | Final file |
|---|---|---|
| Filename | modeM0/AS1C05_019T04_9000004130_28782cztM0_level2.evt | modeM0/AS1C05_019T04_9000004130_28782cztM0_level2_quad_clean.evt |
| Size (bytes) | 720,239,040 | 91,555,200 |
| Size | 686.9 MB | 87.3 MB |
| Events in quadrant A | 3,205,747 | 622,532 |
| Events in quadrant B | 3,339,045 | 631,730 |
| Events in quadrant C | 3,414,284 | 594,203 |
| Events in quadrant D | 11,403,722 | 460,051 |
| Mode SS | |||
|---|---|---|---|
| Quadrant | BADHDUFLAG | Total packets | Discarded packets |
| A | 0 | 136 | 0 |
| B | 0 | 136 | 0 |
| C | 0 | 136 | 0 |
| D | 0 | 136 | 0 |
| Mode M9 | |||
|---|---|---|---|
| Quadrant | BADHDUFLAG | Total packets | Discarded packets |
| A | 0 | 3 | 0 |
| B | 0 | 3 | 0 |
| C | 0 | 3 | 0 |
| D | 0 | 3 | 0 |
| Mode M0 | |||
|---|---|---|---|
| Quadrant | BADHDUFLAG | Total packets | Discarded packets |
| A | 0 | 13835 | 1 |
| B | 0 | 14243 | 1 |
| C | 0 | 14311 | 1 |
| D | 0 | 38376 | 1 |
| Quadrant | Total seconds | Saturated seconds | Saturation percentage |
|---|---|---|---|
| A | 6630 | 73 | 1.101056% |
| B | 6631 | 132 | 1.990650% |
| C | 6631 | 230 | 3.468557% |
| D | 6631 | 3639 | 54.878601% |
Noise dominated data is calculated using 1-second bins in cleaned event files. If a bin has >2000 counts, and if more than 50% of those come from <1% of pixels, then it is considered to be noise-dominated and hence unusable.
| Quadrant | # 1 sec bins | Bins with >0 counts | Bins with >2000 counts | High rate bins dominated by noise | Noise dominated (total time) | Noise dominated (detector-on time) | Marked lightcurve |
|---|---|---|---|---|---|---|---|
| A | 6945 | 6630 | 0 | 0 | 0.00% | 0.00% | 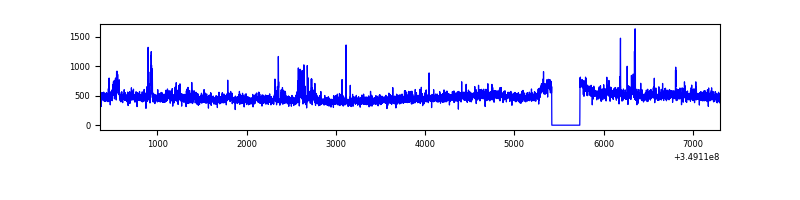 |
| B | 6946 | 6631 | 24 | 24 | 0.35% | 0.36% | 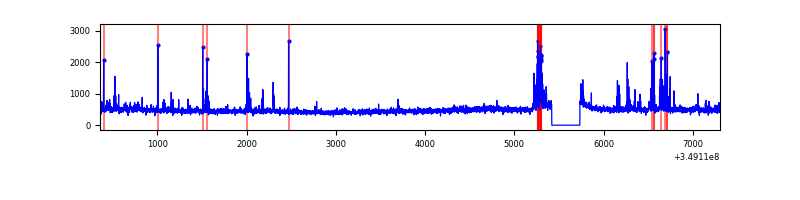 |
| C | 6946 | 6631 | 10 | 10 | 0.14% | 0.15% | 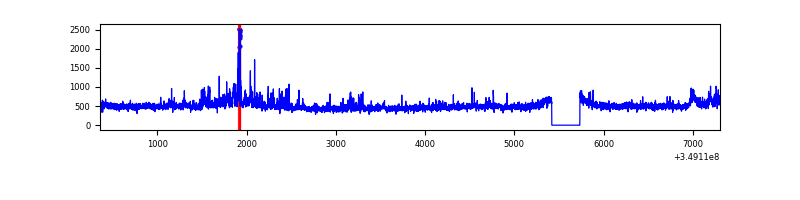 |
| D | 6945 | 6630 | 3500 | 3500 | 50.40% | 52.79% | 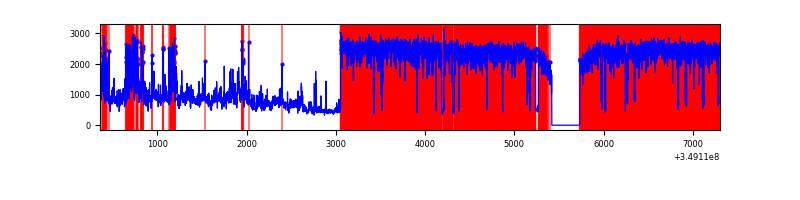 |
Top three noisy pixels from each quadrant. If the there are fewer than three noisy pixels in the level2.evt file, extra rows are filled as -1
| Pixel properties | Quadrant properties | ||||||
|---|---|---|---|---|---|---|---|
| Quadrant | DetID | PixID | Counts | Sigma | Mean | Median | Sigma |
| A | 15 | 174 | 99575 | 621.79 | 788 | 771 | 158.9 |
| A | 5 | 98 | 39493 | 243.68 | 788 | 771 | 158.9 |
| A | 13 | 254 | 12161 | 71.68 | 788 | 771 | 158.9 |
| B | 5 | 255 | 216288 | 1454.93 | 778 | 758 | 148.1 |
| B | 0 | 229 | 23722 | 155.02 | 778 | 758 | 148.1 |
| B | 0 | 156 | 20200 | 131.24 | 778 | 758 | 148.1 |
| C | 3 | 233 | 267124 | 1520.39 | 747 | 747 | 175.2 |
| C | 14 | 238 | 167058 | 949.25 | 747 | 747 | 175.2 |
| C | 14 | 254 | 68040 | 384.09 | 747 | 747 | 175.2 |
| D | 8 | 195 | 7823212 | 52327.32 | 628 | 609 | 149.5 |
| D | 1 | 52 | 908809 | 6075.17 | 628 | 609 | 149.5 |
| D | 13 | 104 | 186615 | 1244.24 | 628 | 609 | 149.5 |
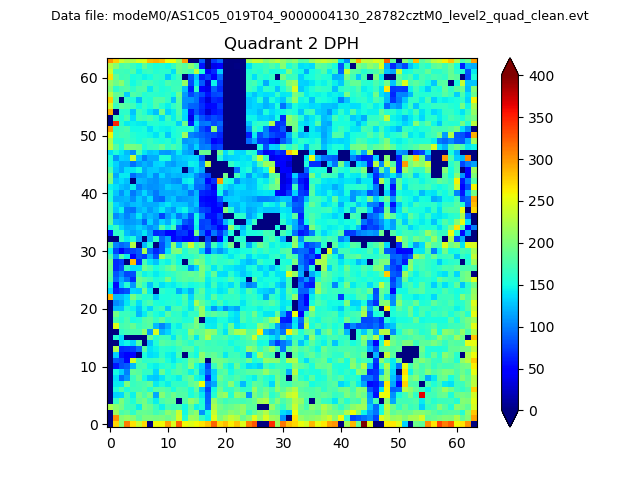
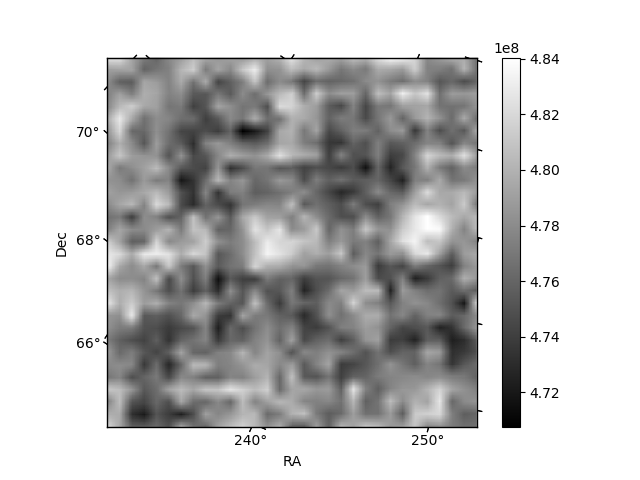
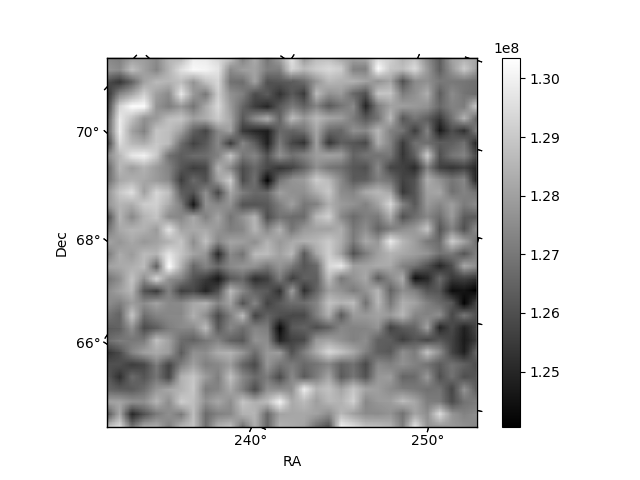
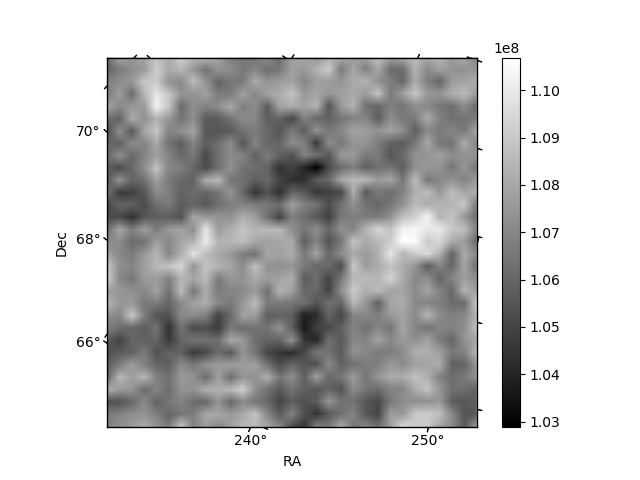
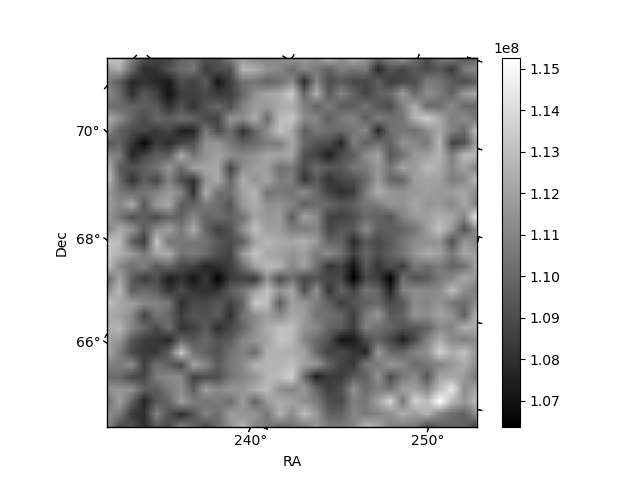
Histogram calculated using DETX and DETY for each event in the final _common_clean file
| Quadrant A | 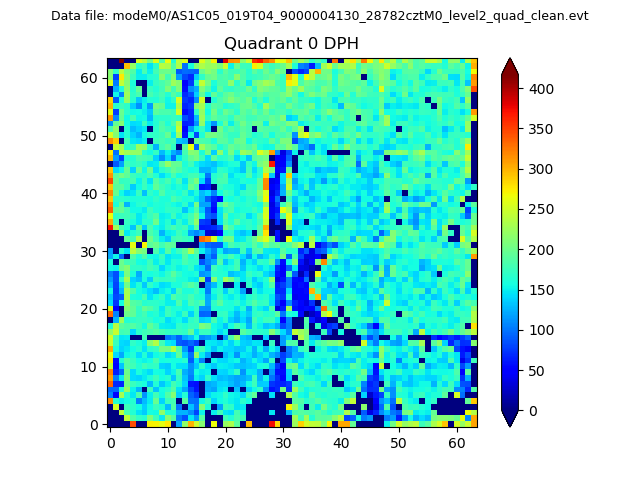 |
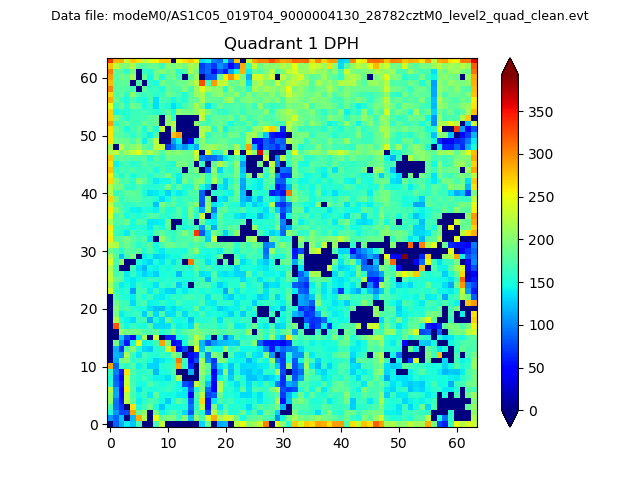 |
Quadrant B |
|---|---|---|---|
| Quadrant D | 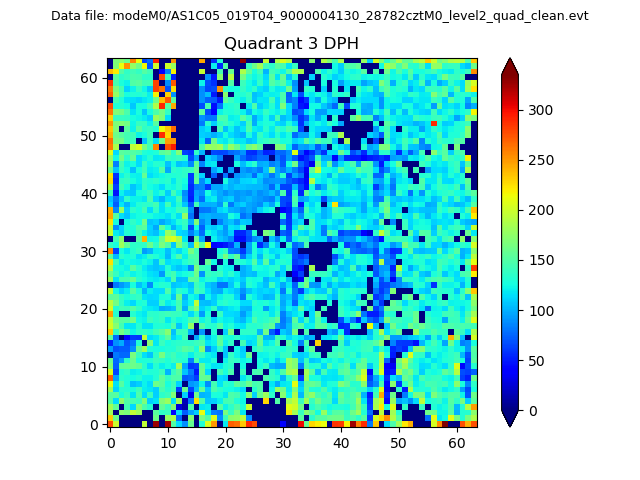 |
 |
Quadrant C |
| Plot type | Count rate plots | Images |
|---|---|---|
| Comparison with Poisson distribution Blue bars denote a histogram of data divided into 1 sec bins. Red curve is a Poisson curve with rate = median count rate of data. |
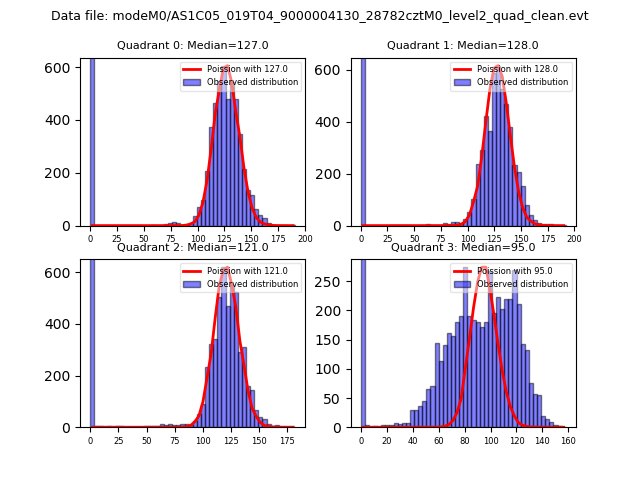 |
 |
| Quadrant-wise count rates Data is divided into 100 sec bins |
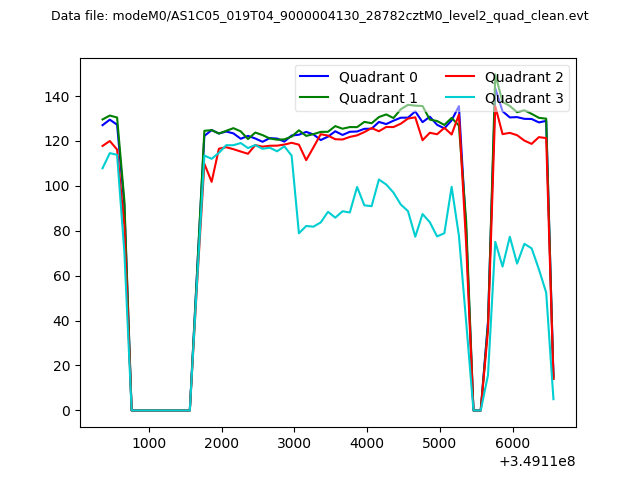 |
|
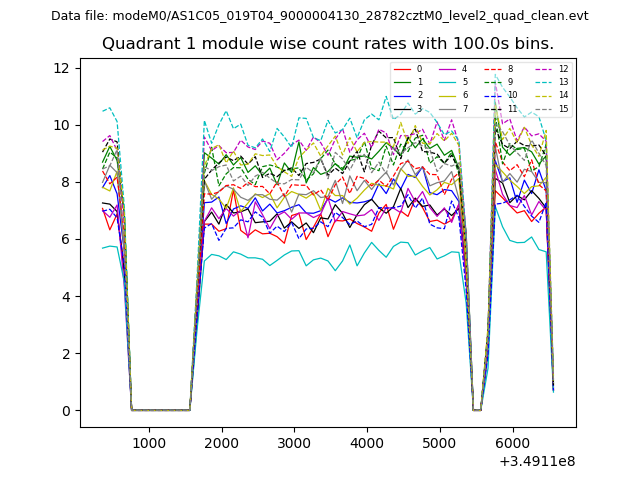
| Module-wise count rates for Quadrant A Data is divided into 100 sec bins |
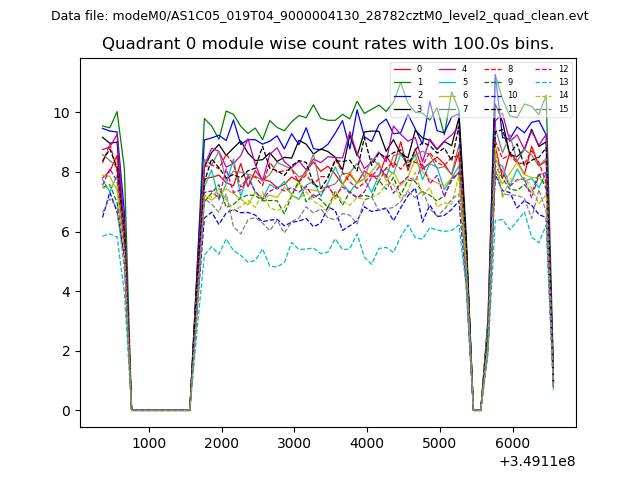 |
 |
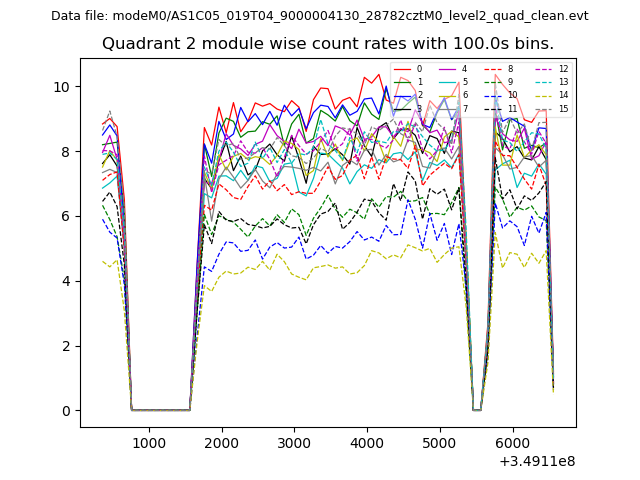
| Module-wise count rates for Quadrant B Data is divided into 100 sec bins |
 |
 |
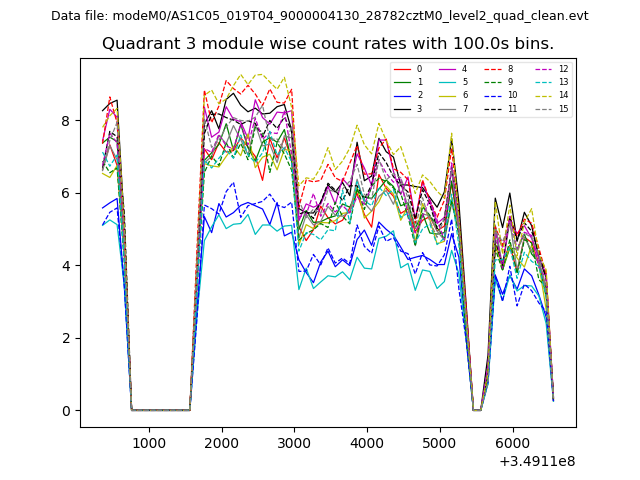
| Module-wise count rates for Quadrant C Data is divided into 100 sec bins |
 |
 |
| Module-wise count rates for Quadrant D Data is divided into 100 sec bins |
 |
 |
| Parameter | Plot |
|---|---|
| CZT HV Monitor | 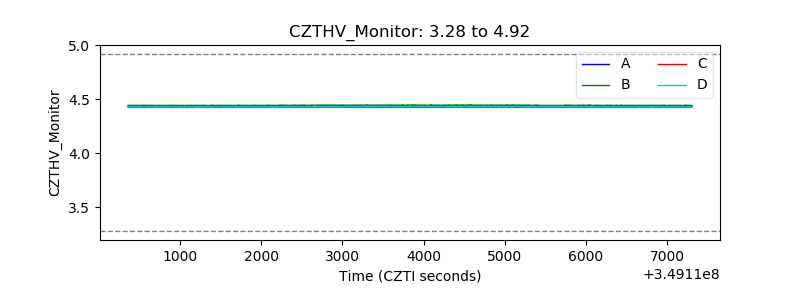 |
| D_VDD | 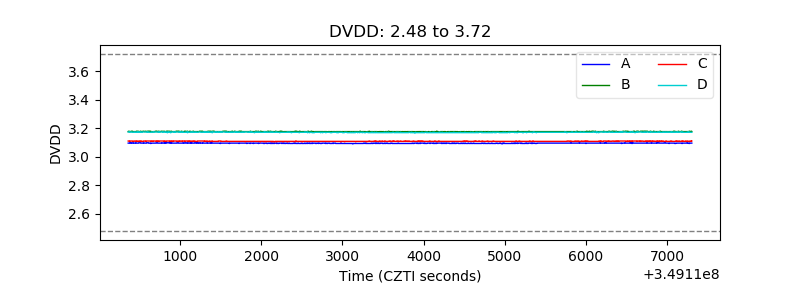 |
| Temperature 1 | 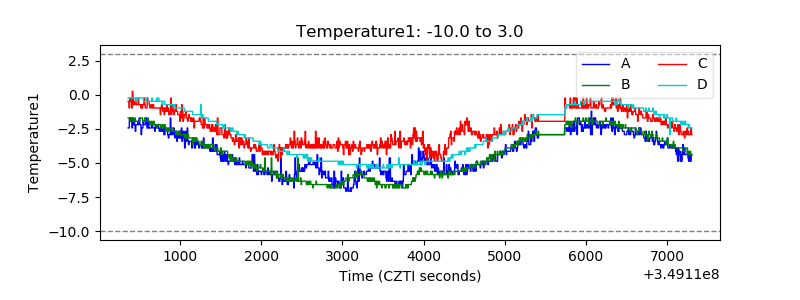 |
| Veto HV Monitor | 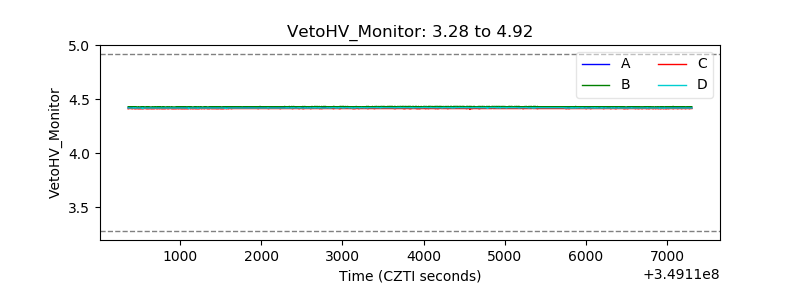 |
| Veto LLD | 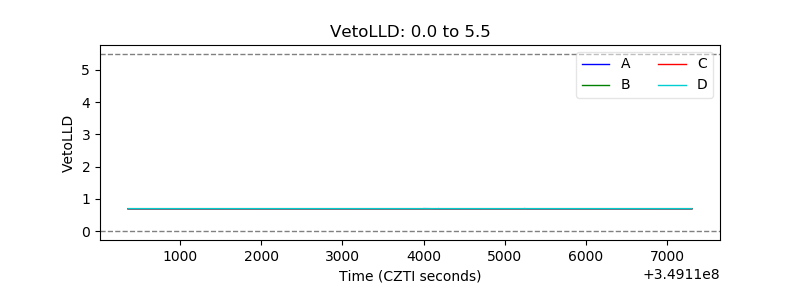 |
| Alpha Counter | 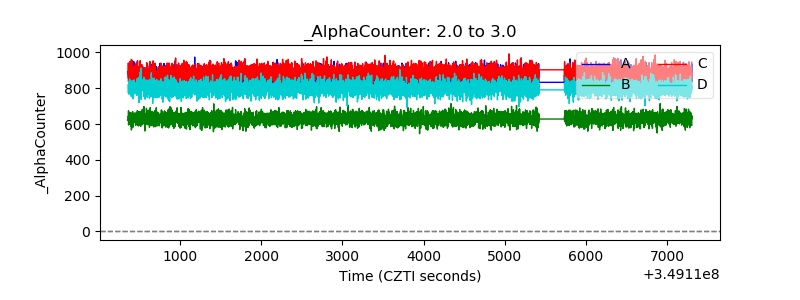 |
| _CPM_Rate | 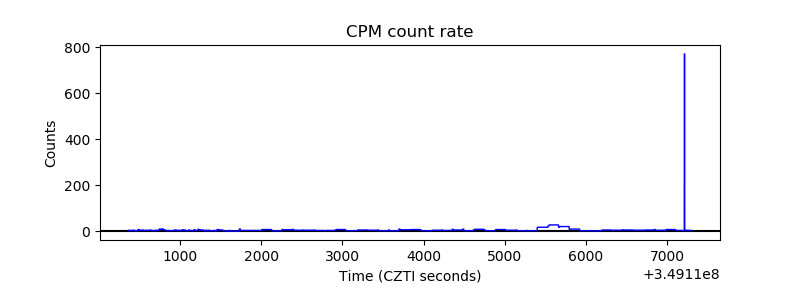 |
| CZT Counter | 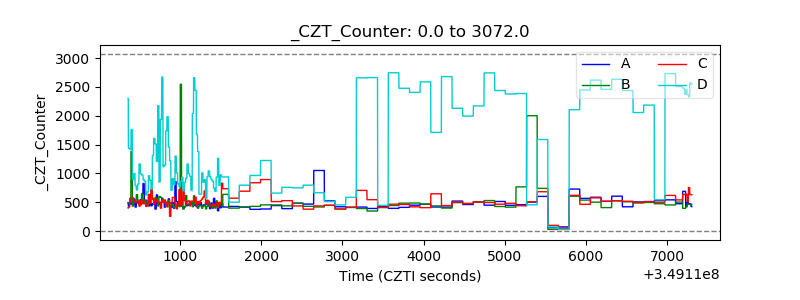 |
| +2.5 Volts monitor |  |
| +5 Volts monitor | 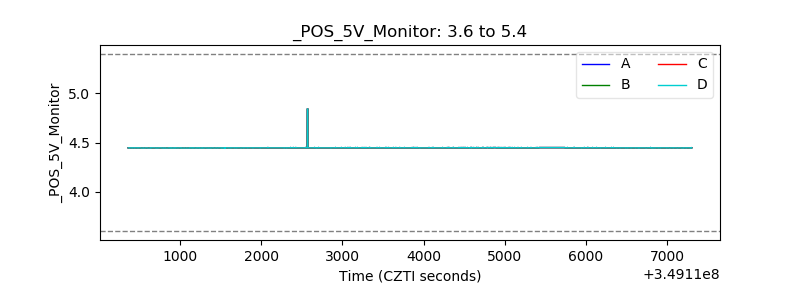 |
| _ROLL_ROT | 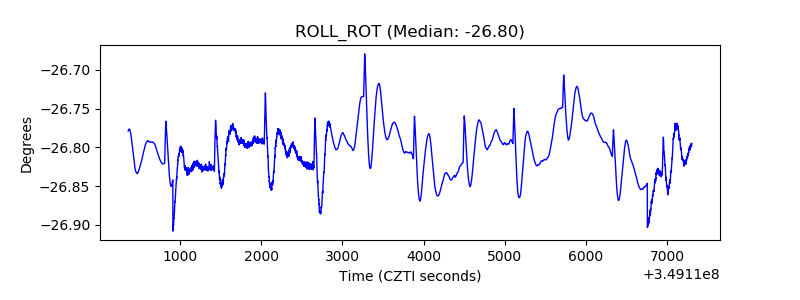 |
| _Roll_DEC | 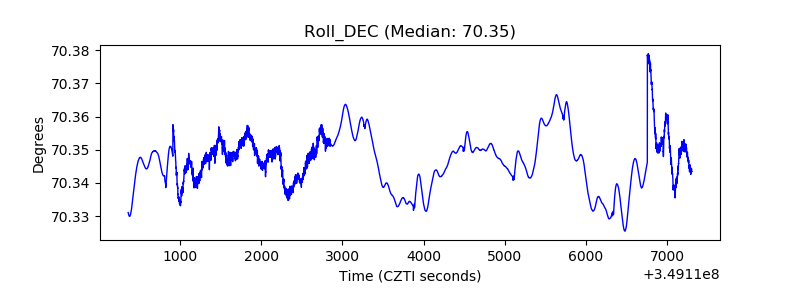 |
| _Roll_RA | 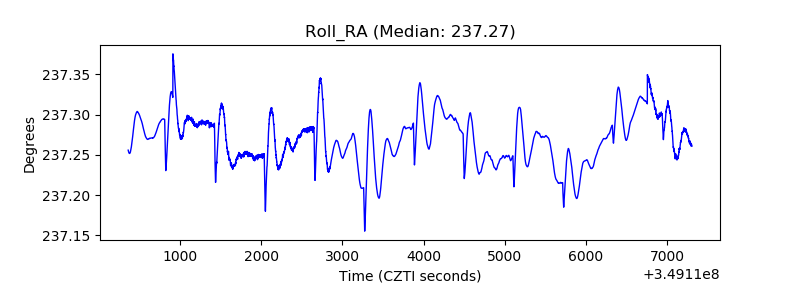 |
| Veto Counter | 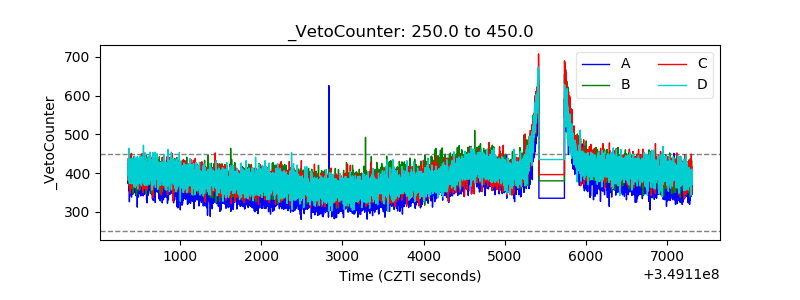 |