| Param | Original file | Final file |
|---|---|---|
| Filename | modeM0/AS1C05_019T04_9000004130_28784cztM0_level2.evt | modeM0/AS1C05_019T04_9000004130_28784cztM0_level2_quad_clean.evt |
| Size (bytes) | 1,231,954,560 | 172,704,960 |
| Size | 1.1 GB | 164.7 MB |
| Events in quadrant A | 5,691,411 | 1,172,003 |
| Events in quadrant B | 5,754,556 | 1,187,632 |
| Events in quadrant C | 6,786,912 | 1,134,223 |
| Events in quadrant D | 18,250,274 | 889,157 |
| Mode SS | |||
|---|---|---|---|
| Quadrant | BADHDUFLAG | Total packets | Discarded packets |
| A | 0 | 248 | 0 |
| B | 0 | 248 | 0 |
| C | 0 | 248 | 0 |
| D | 0 | 248 | 0 |
| Mode M9 | |||
|---|---|---|---|
| Quadrant | BADHDUFLAG | Total packets | Discarded packets |
| A | 0 | 14 | 0 |
| B | 0 | 14 | 0 |
| C | 0 | 14 | 0 |
| D | 0 | 14 | 0 |
| Mode M0 | |||
|---|---|---|---|
| Quadrant | BADHDUFLAG | Total packets | Discarded packets |
| A | 0 | 25042 | 2 |
| B | 0 | 25186 | 2 |
| C | 0 | 27972 | 2 |
| D | 0 | 62649 | 2 |
| Quadrant | Total seconds | Saturated seconds | Saturation percentage |
|---|---|---|---|
| A | 12244 | 58 | 0.473701% |
| B | 12244 | 54 | 0.441032% |
| C | 12244 | 249 | 2.033649% |
| D | 12244 | 5232 | 42.731134% |
Noise dominated data is calculated using 1-second bins in cleaned event files. If a bin has >2000 counts, and if more than 50% of those come from <1% of pixels, then it is considered to be noise-dominated and hence unusable.
| Quadrant | # 1 sec bins | Bins with >0 counts | Bins with >2000 counts | High rate bins dominated by noise | Noise dominated (total time) | Noise dominated (detector-on time) | Marked lightcurve |
|---|---|---|---|---|---|---|---|
| A | 13529 | 12245 | 20 | 20 | 0.15% | 0.16% | 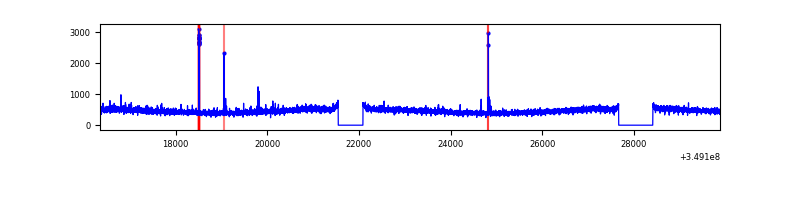 |
| B | 13529 | 12245 | 11 | 11 | 0.08% | 0.09% | 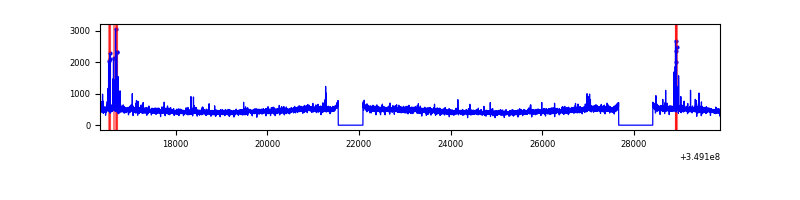 |
| C | 13529 | 12244 | 1 | 1 | 0.01% | 0.01% | 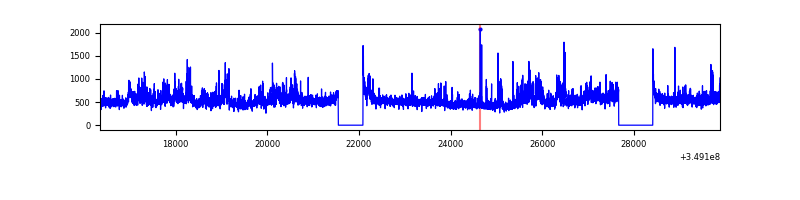 |
| D | 13529 | 12244 | 4540 | 4540 | 33.56% | 37.08% | 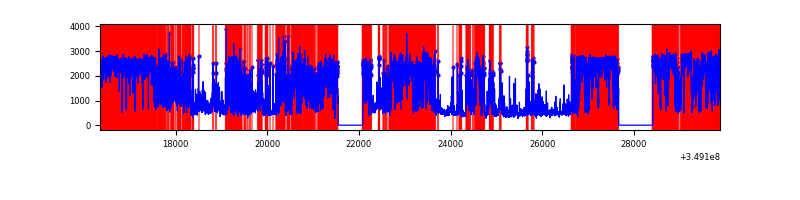 |
Top three noisy pixels from each quadrant. If the there are fewer than three noisy pixels in the level2.evt file, extra rows are filled as -1
| Pixel properties | Quadrant properties | ||||||
|---|---|---|---|---|---|---|---|
| Quadrant | DetID | PixID | Counts | Sigma | Mean | Median | Sigma |
| A | 15 | 174 | 69022 | 234.42 | 1441 | 1409 | 288.4 |
| A | 1 | 113 | 34268 | 113.92 | 1441 | 1409 | 288.4 |
| A | 13 | 254 | 22667 | 73.7 | 1441 | 1409 | 288.4 |
| B | 5 | 255 | 71792 | 259.55 | 1430 | 1392 | 271.2 |
| B | 0 | 229 | 45153 | 161.34 | 1430 | 1392 | 271.2 |
| B | 12 | 111 | 34488 | 122.02 | 1430 | 1392 | 271.2 |
| C | 3 | 233 | 1059345 | 3299.99 | 1376 | 1383 | 320.6 |
| C | 14 | 238 | 273908 | 850.06 | 1376 | 1383 | 320.6 |
| C | 14 | 254 | 80936 | 248.14 | 1376 | 1383 | 320.6 |
| D | 1 | 52 | 7226550 | 28466.2 | 1064 | 1032 | 253.8 |
| D | 8 | 195 | 5009222 | 19730.65 | 1064 | 1032 | 253.8 |
| D | 13 | 104 | 1791845 | 7055.22 | 1064 | 1032 | 253.8 |
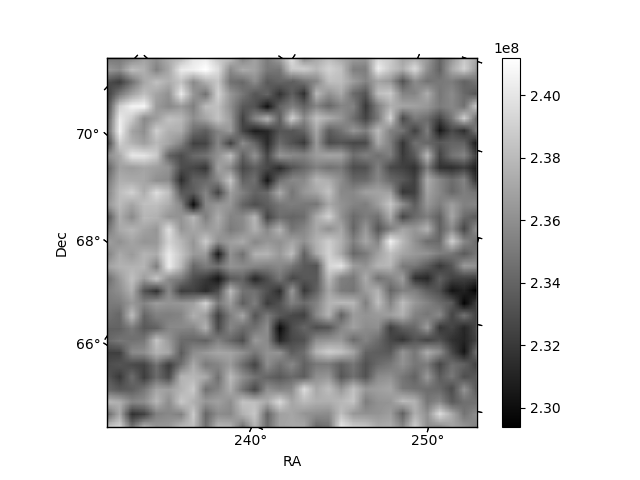
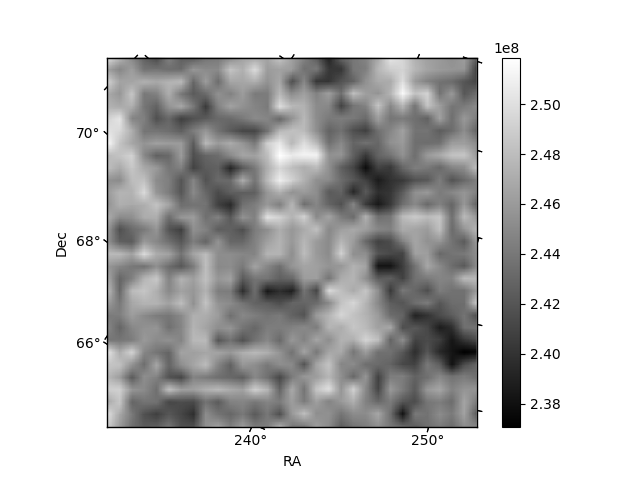
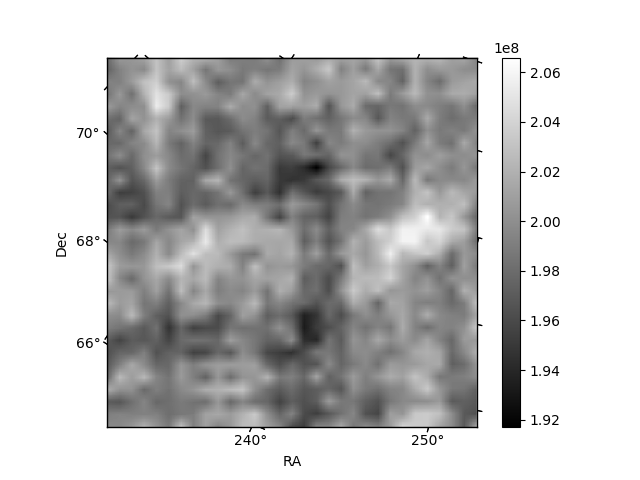
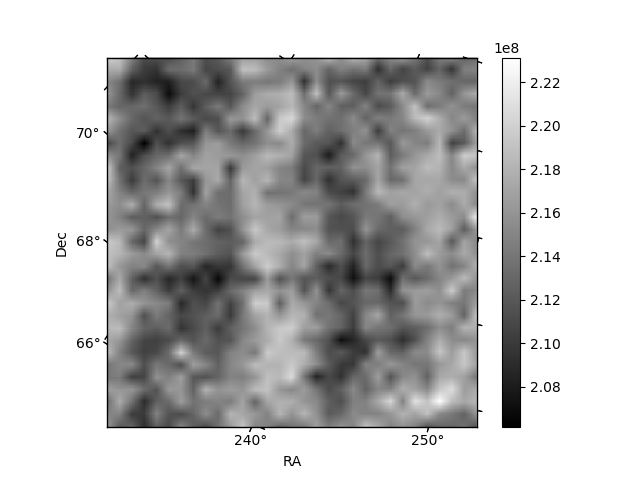
Histogram calculated using DETX and DETY for each event in the final _common_clean file
| Quadrant A | 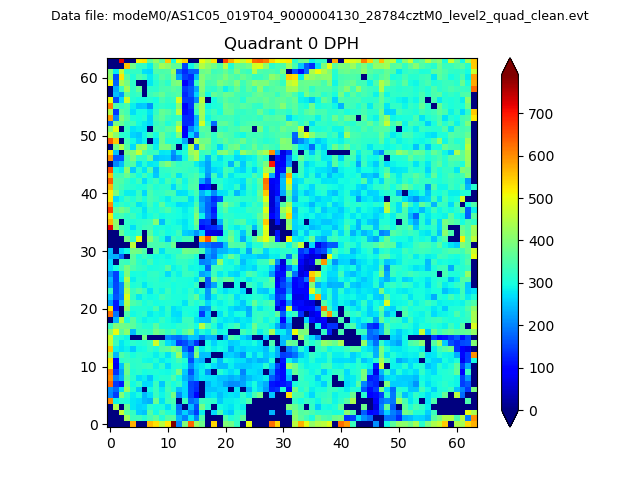 |
 |
Quadrant B |
|---|---|---|---|
| Quadrant D | 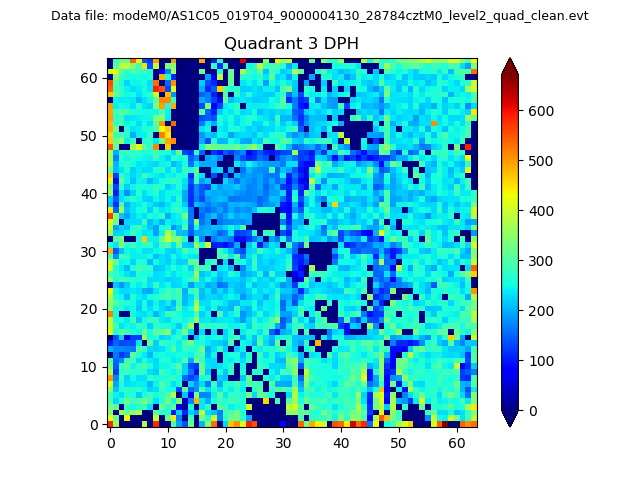 |
 |
Quadrant C |
| Plot type | Count rate plots | Images |
|---|---|---|
| Comparison with Poisson distribution Blue bars denote a histogram of data divided into 1 sec bins. Red curve is a Poisson curve with rate = median count rate of data. |
 |
 |
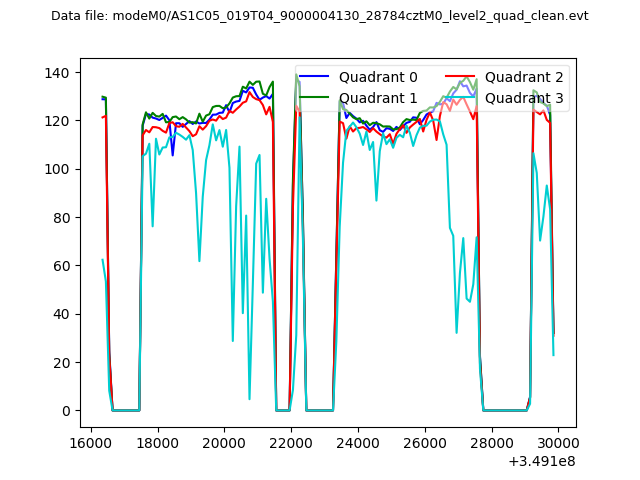
| Quadrant-wise count rates Data is divided into 100 sec bins |
 |
|
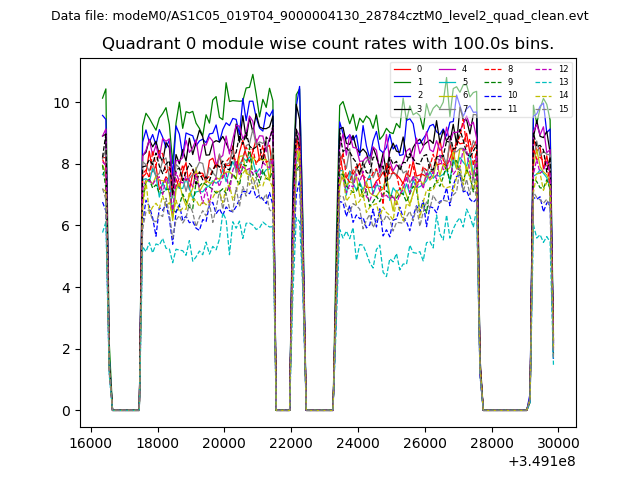
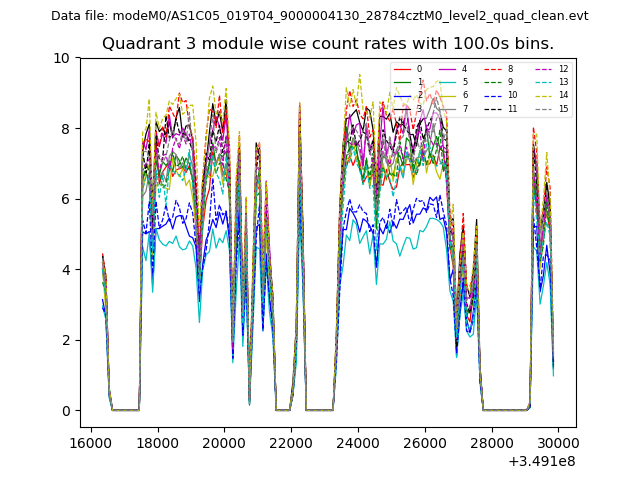
| Module-wise count rates for Quadrant A Data is divided into 100 sec bins |
 |
 |
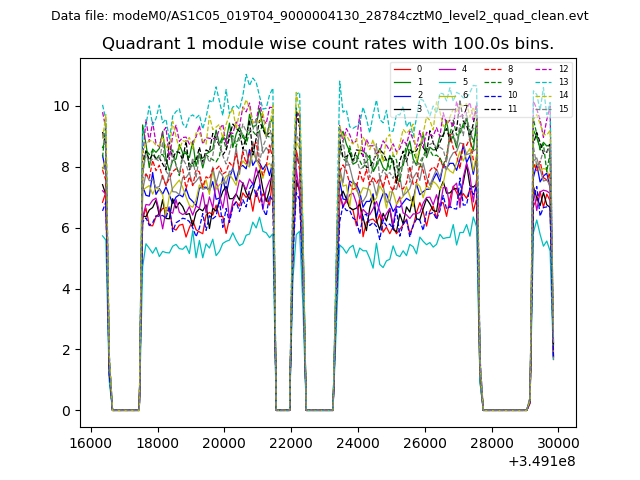
| Module-wise count rates for Quadrant B Data is divided into 100 sec bins |
 |
 |
| Module-wise count rates for Quadrant C Data is divided into 100 sec bins |
 |
 |
| Module-wise count rates for Quadrant D Data is divided into 100 sec bins |
 |
 |
| Parameter | Plot |
|---|---|
| CZT HV Monitor | 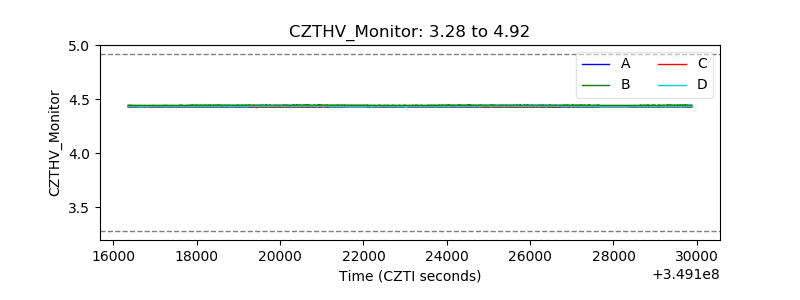 |
| D_VDD | 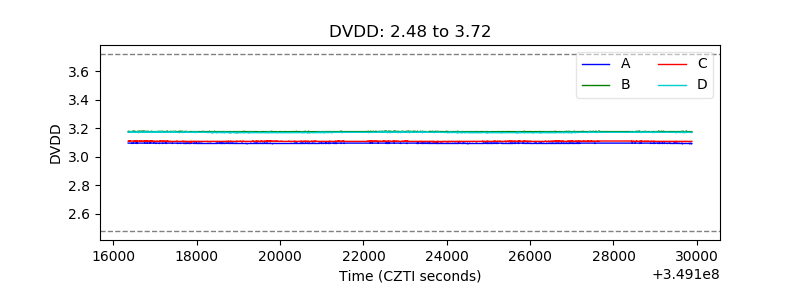 |
| Temperature 1 | 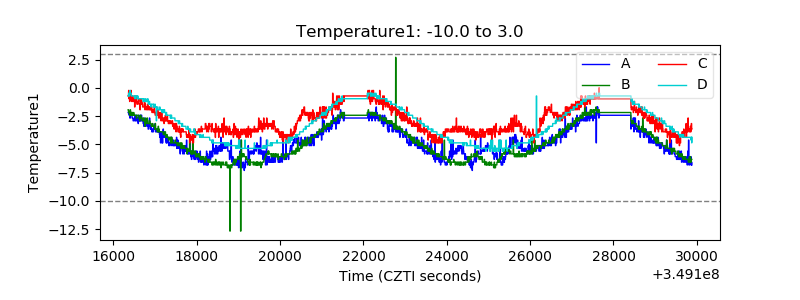 |
| Veto HV Monitor | 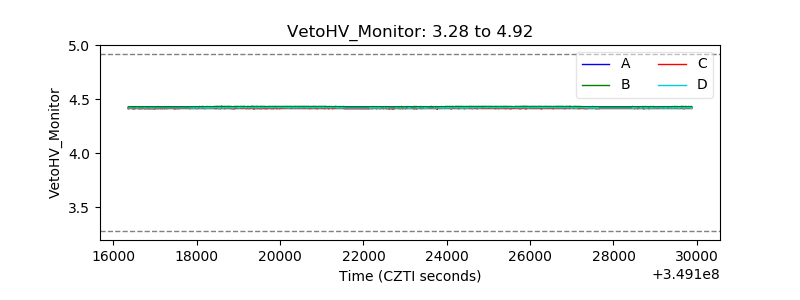 |
| Veto LLD | 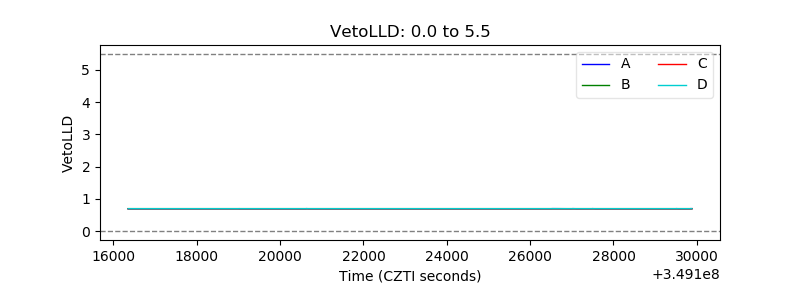 |
| Alpha Counter |  |
| _CPM_Rate | 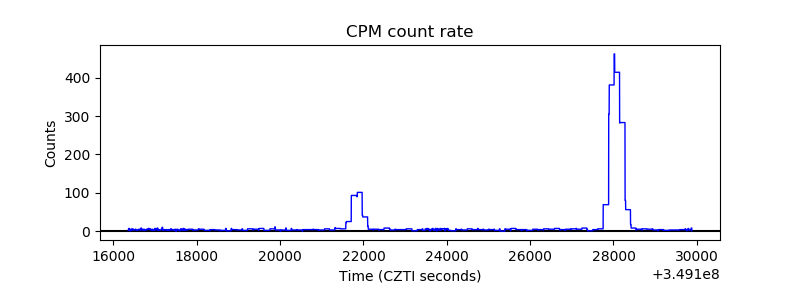 |
| CZT Counter |  |
| +2.5 Volts monitor |  |
| +5 Volts monitor |  |
| _ROLL_ROT | 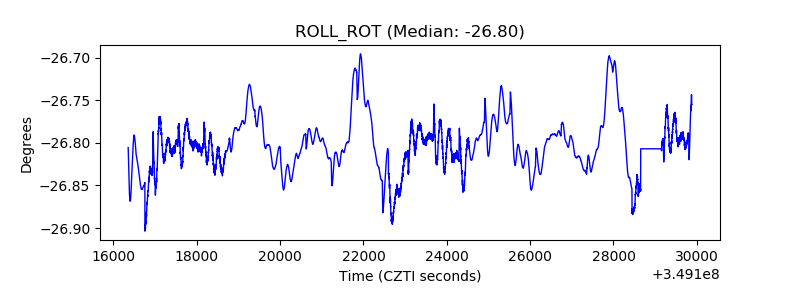 |
| _Roll_DEC | 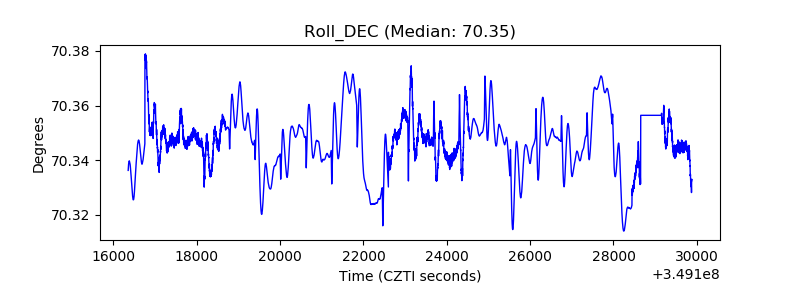 |
| _Roll_RA | 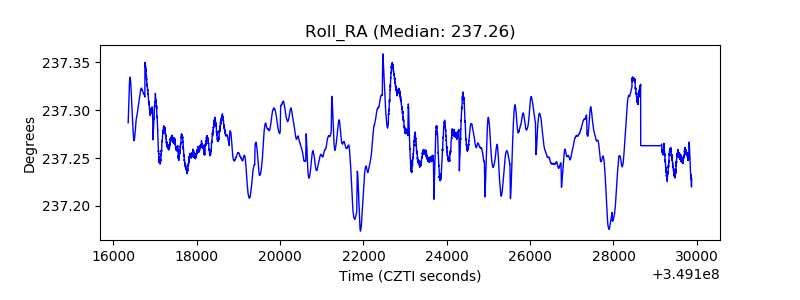 |
| Veto Counter | 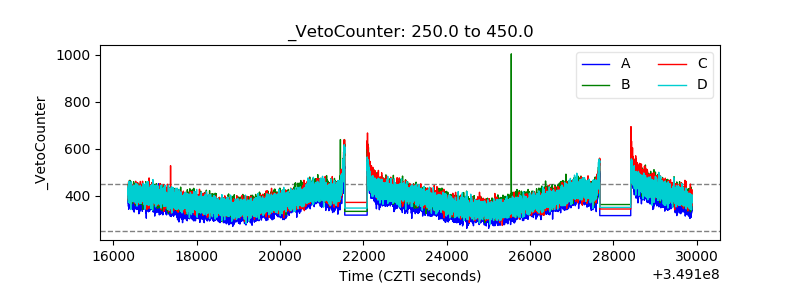 |