| Param | Original file | Final file |
|---|---|---|
| Filename | modeM0/AS1C05_019T04_9000004130_28786cztM0_level2.evt | modeM0/AS1C05_019T04_9000004130_28786cztM0_level2_quad_clean.evt |
| Size (bytes) | 790,162,560 | 95,955,840 |
| Size | 753.6 MB | 91.5 MB |
| Events in quadrant A | 2,900,431 | 676,822 |
| Events in quadrant B | 2,990,582 | 688,447 |
| Events in quadrant C | 4,422,991 | 649,729 |
| Events in quadrant D | 13,188,350 | 447,799 |
| Mode SS | |||
|---|---|---|---|
| Quadrant | BADHDUFLAG | Total packets | Discarded packets |
| A | 0 | 128 | 0 |
| B | 0 | 128 | 0 |
| C | 0 | 128 | 0 |
| D | 0 | 128 | 0 |
| Mode M9 | |||
|---|---|---|---|
| Quadrant | BADHDUFLAG | Total packets | Discarded packets |
| A | 0 | 9 | 0 |
| B | 0 | 9 | 0 |
| C | 0 | 9 | 0 |
| D | 0 | 9 | 0 |
| Mode M0 | |||
|---|---|---|---|
| Quadrant | BADHDUFLAG | Total packets | Discarded packets |
| A | 0 | 12881 | 1 |
| B | 0 | 13082 | 1 |
| C | 0 | 17441 | 1 |
| D | 0 | 43497 | 1 |
| Quadrant | Total seconds | Saturated seconds | Saturation percentage |
|---|---|---|---|
| A | 6326 | 17 | 0.268732% |
| B | 6327 | 40 | 0.632211% |
| C | 6327 | 189 | 2.987198% |
| D | 6327 | 4206 | 66.477003% |
Noise dominated data is calculated using 1-second bins in cleaned event files. If a bin has >2000 counts, and if more than 50% of those come from <1% of pixels, then it is considered to be noise-dominated and hence unusable.
| Quadrant | # 1 sec bins | Bins with >0 counts | Bins with >2000 counts | High rate bins dominated by noise | Noise dominated (total time) | Noise dominated (detector-on time) | Marked lightcurve |
|---|---|---|---|---|---|---|---|
| A | 7211 | 6327 | 1 | 1 | 0.01% | 0.02% | 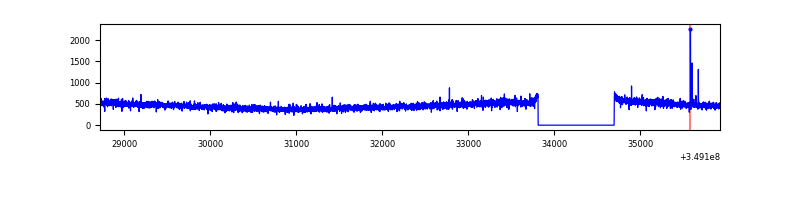 |
| B | 7212 | 6327 | 10 | 10 | 0.14% | 0.16% | 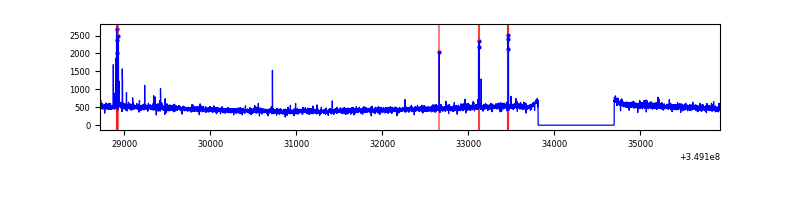 |
| C | 7212 | 6328 | 17 | 17 | 0.24% | 0.27% | 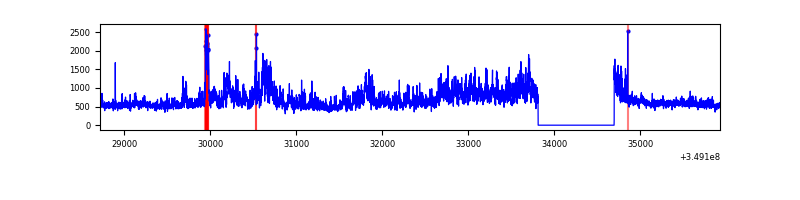 |
| D | 7212 | 6327 | 4288 | 4288 | 59.46% | 67.77% | 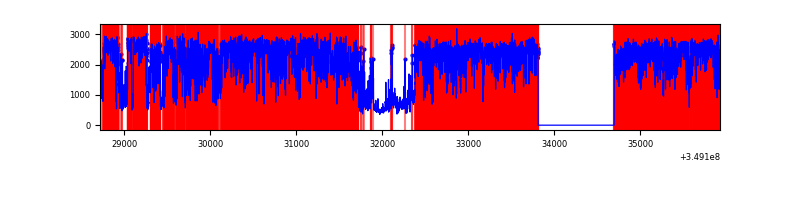 |
Top three noisy pixels from each quadrant. If the there are fewer than three noisy pixels in the level2.evt file, extra rows are filled as -1
| Pixel properties | Quadrant properties | ||||||
|---|---|---|---|---|---|---|---|
| Quadrant | DetID | PixID | Counts | Sigma | Mean | Median | Sigma |
| A | 13 | 254 | 11151 | 68.48 | 749 | 731 | 152.2 |
| A | 7 | 16 | 8207 | 49.13 | 749 | 731 | 152.2 |
| A | 3 | 137 | 7497 | 44.47 | 749 | 731 | 152.2 |
| B | 0 | 229 | 36396 | 250.09 | 746 | 727 | 142.6 |
| B | 12 | 111 | 17939 | 120.68 | 746 | 727 | 142.6 |
| B | 5 | 255 | 16229 | 108.69 | 746 | 727 | 142.6 |
| C | 3 | 233 | 1473466 | 8791.53 | 717 | 719 | 167.5 |
| C | 14 | 238 | 120018 | 712.15 | 717 | 719 | 167.5 |
| C | 15 | 208 | 22786 | 131.73 | 717 | 719 | 167.5 |
| D | 1 | 52 | 4994433 | 39661.62 | 529 | 515 | 125.9 |
| D | 8 | 195 | 4853207 | 38540.0 | 529 | 515 | 125.9 |
| D | 13 | 104 | 1293093 | 10265.63 | 529 | 515 | 125.9 |
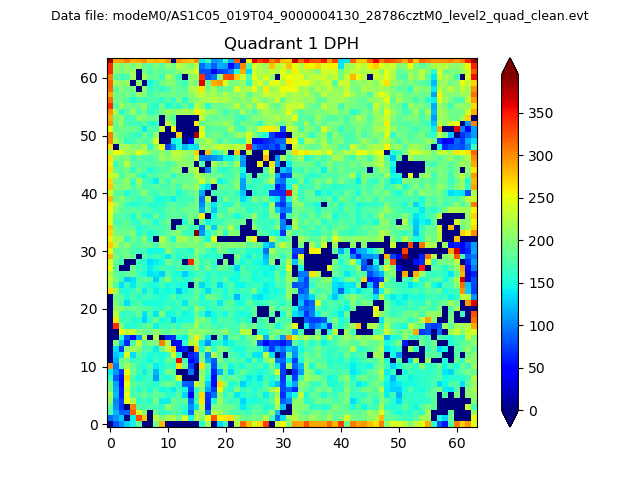
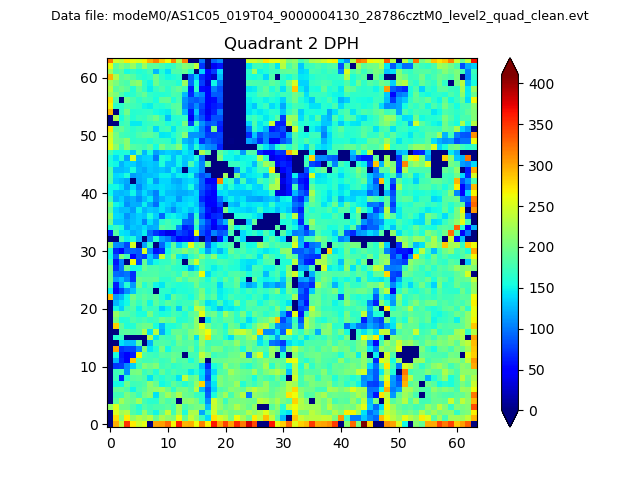
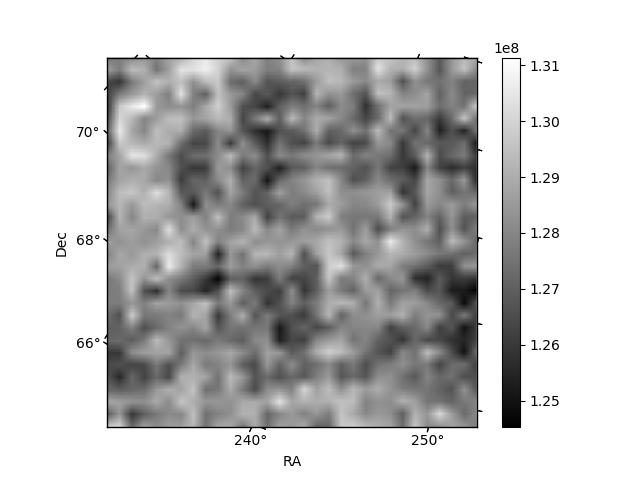
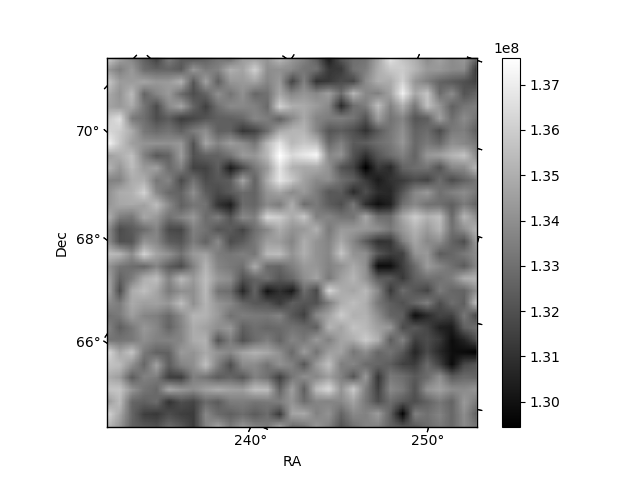
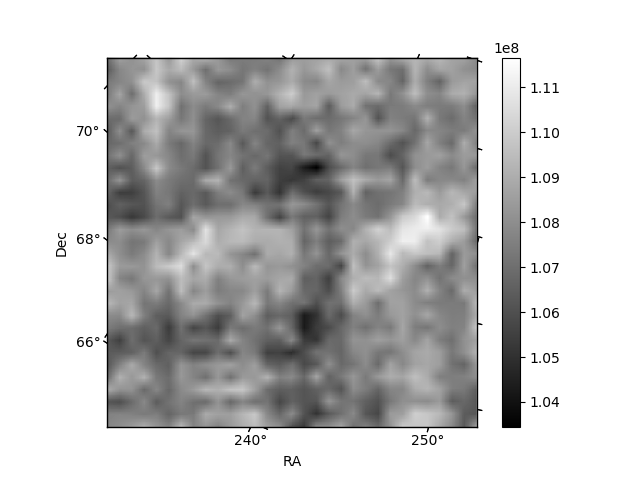
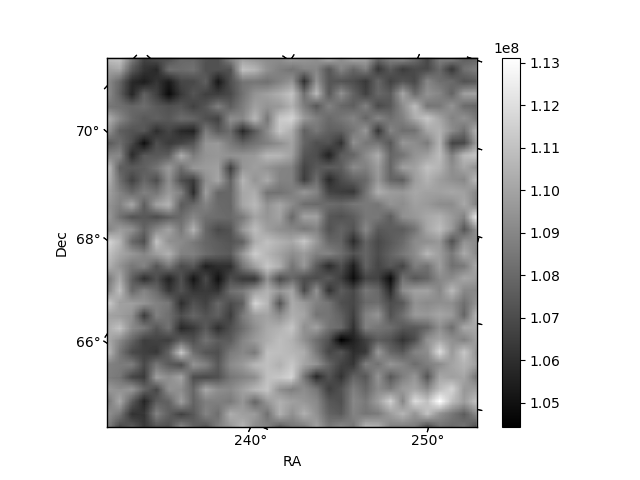
Histogram calculated using DETX and DETY for each event in the final _common_clean file
| Quadrant A |  |
 |
Quadrant B |
|---|---|---|---|
| Quadrant D |  |
 |
Quadrant C |
| Plot type | Count rate plots | Images |
|---|---|---|
| Comparison with Poisson distribution Blue bars denote a histogram of data divided into 1 sec bins. Red curve is a Poisson curve with rate = median count rate of data. |
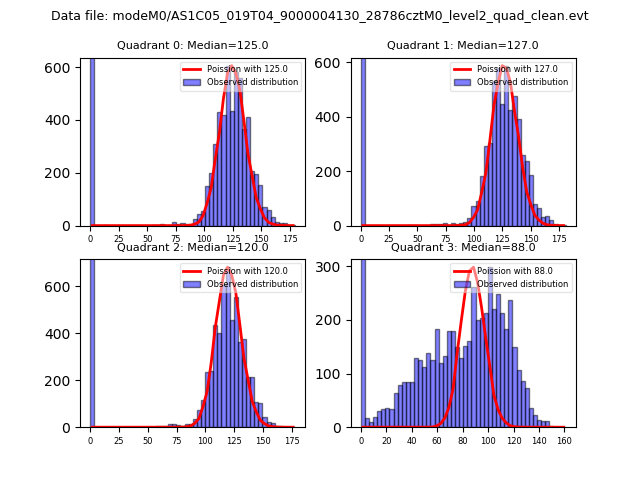 |
 |
| Quadrant-wise count rates Data is divided into 100 sec bins |
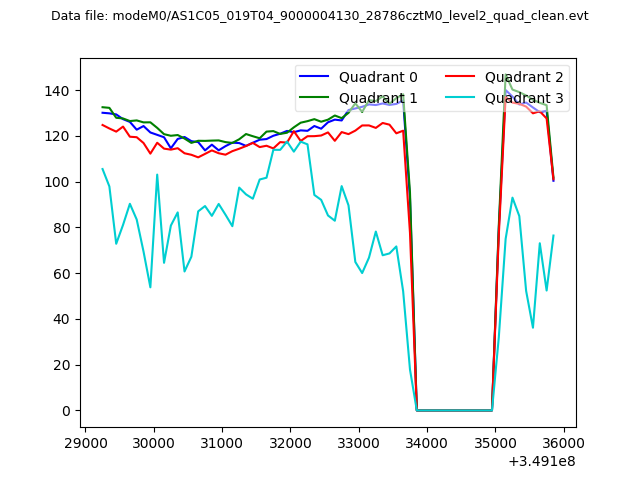 |
|
| Module-wise count rates for Quadrant A Data is divided into 100 sec bins |
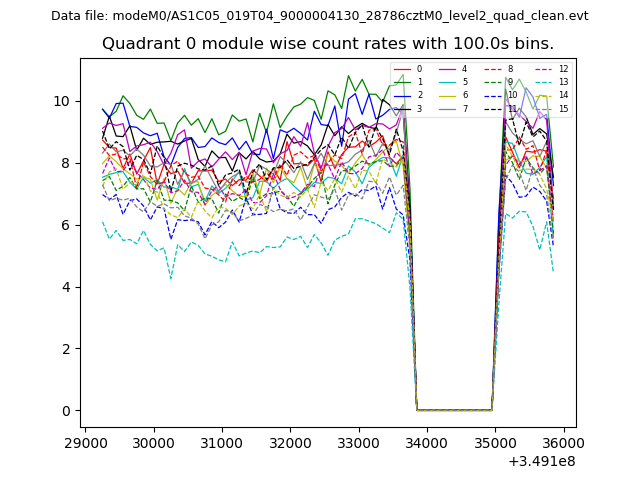 |
 |
| Module-wise count rates for Quadrant B Data is divided into 100 sec bins |
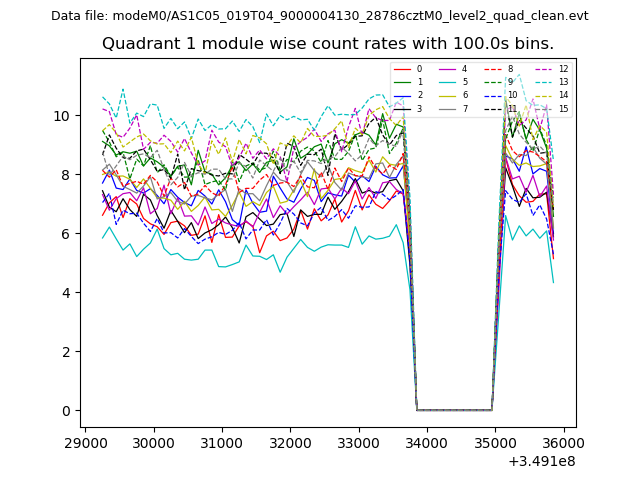 |
 |
| Module-wise count rates for Quadrant C Data is divided into 100 sec bins |
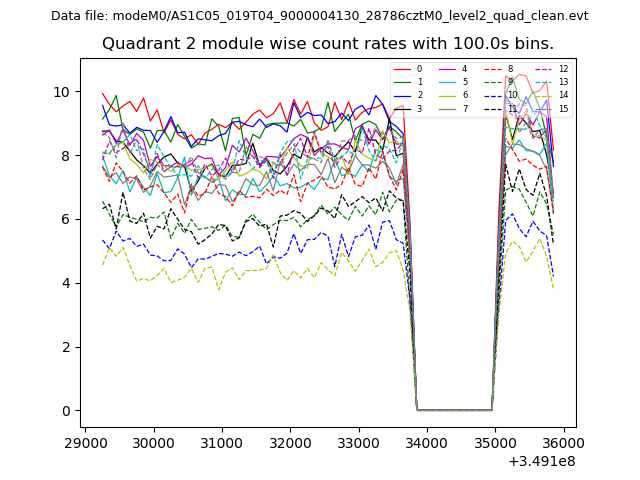 |
 |
| Module-wise count rates for Quadrant D Data is divided into 100 sec bins |
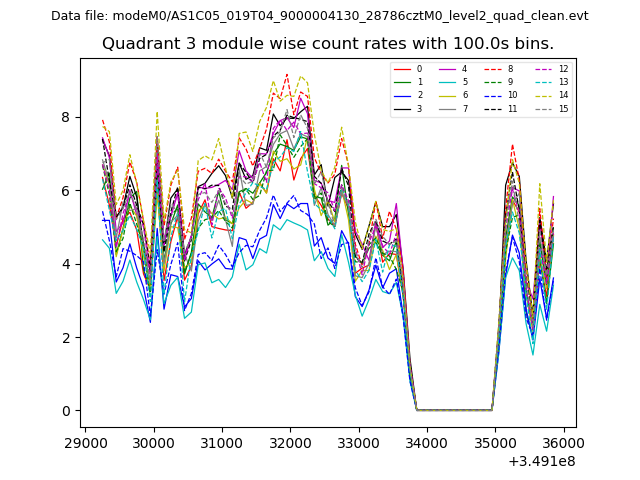 |
 |
| Parameter | Plot |
|---|---|
| CZT HV Monitor | 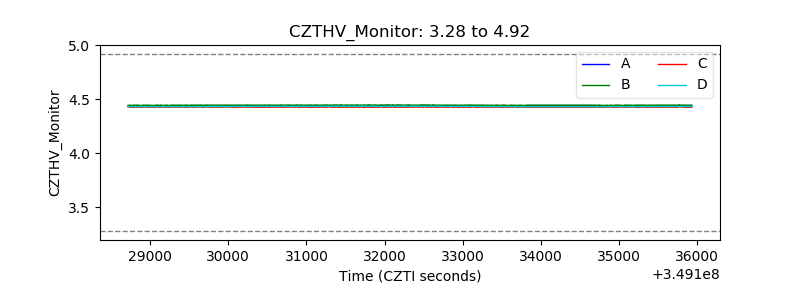 |
| D_VDD | 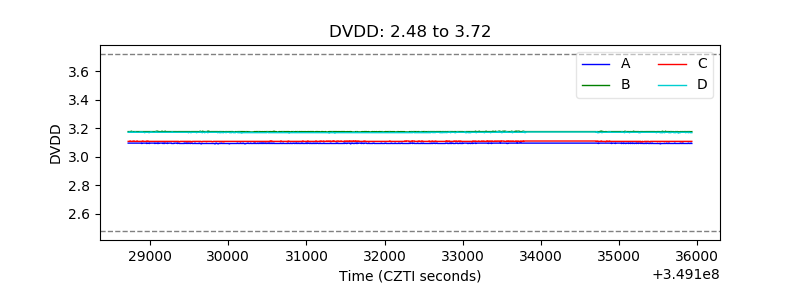 |
| Temperature 1 | 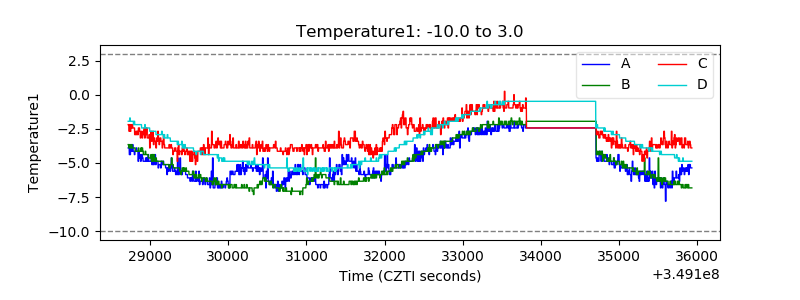 |
| Veto HV Monitor | 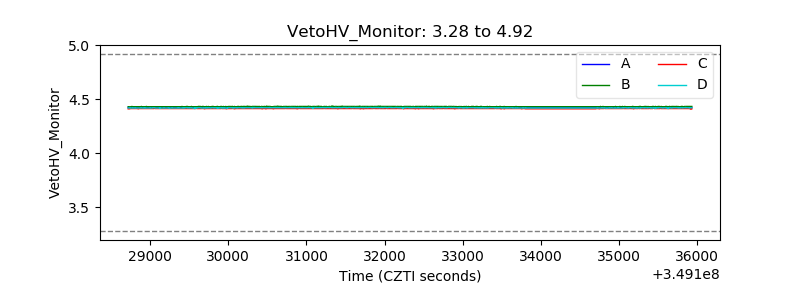 |
| Veto LLD | 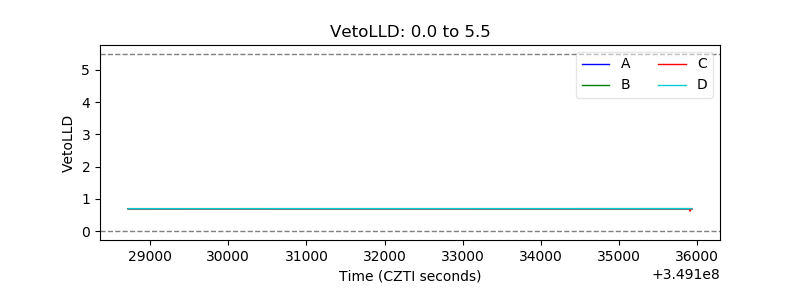 |
| Alpha Counter | 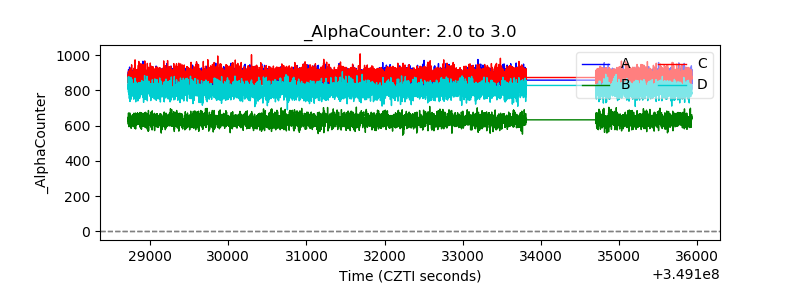 |
| _CPM_Rate | 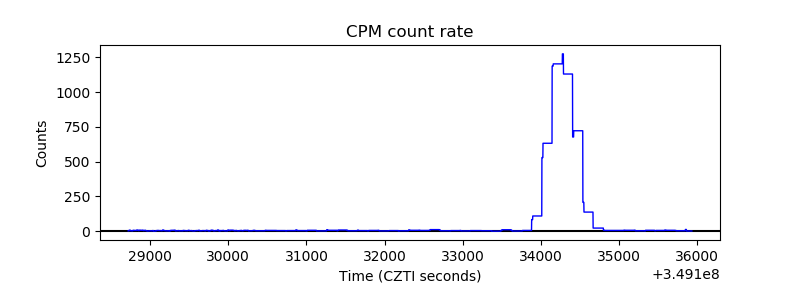 |
| CZT Counter | 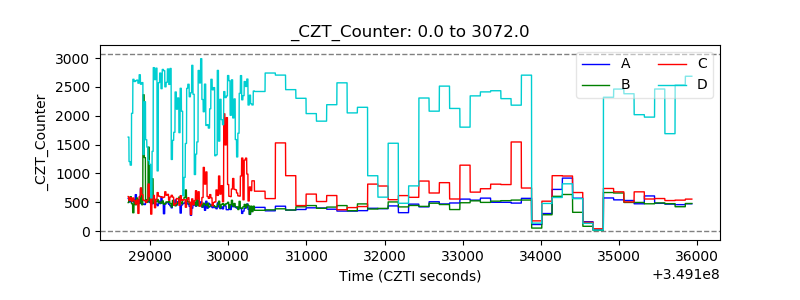 |
| +2.5 Volts monitor |  |
| +5 Volts monitor | 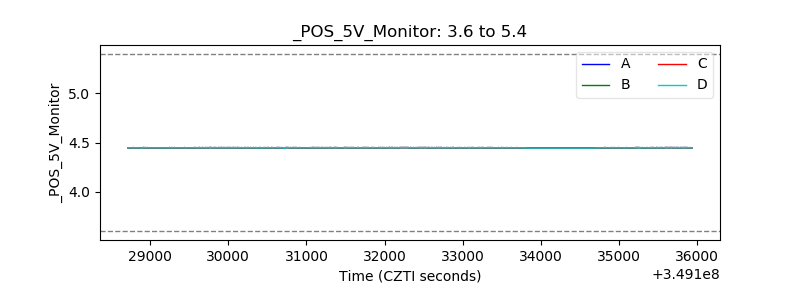 |
| _ROLL_ROT | 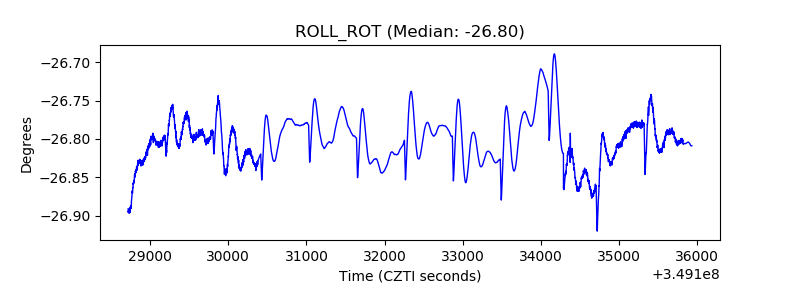 |
| _Roll_DEC | 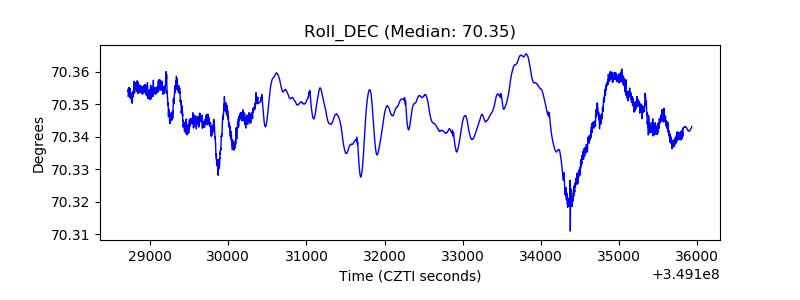 |
| _Roll_RA | 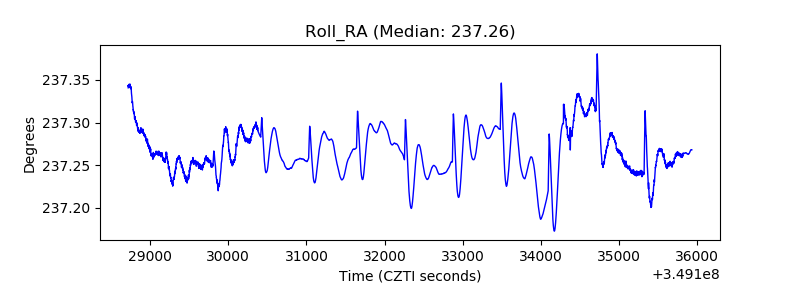 |
| Veto Counter | 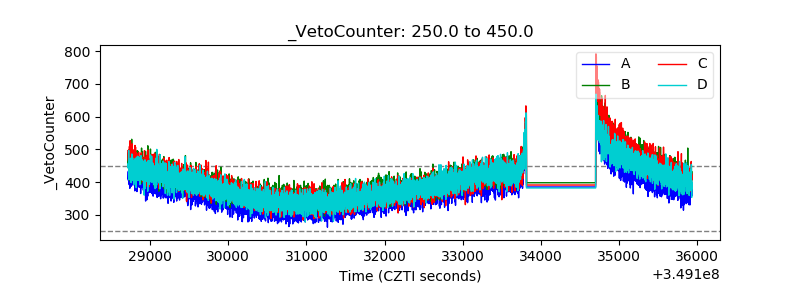 |