| Param | Original file | Final file |
|---|---|---|
| Filename | modeM0/AS1A10_103T01_9000004132_28789cztM0_level2.evt | modeM0/AS1A10_103T01_9000004132_28789cztM0_level2_quad_clean.evt |
| Size (bytes) | 672,094,080 | 102,378,240 |
| Size | 641.0 MB | 97.6 MB |
| Events in quadrant A | 3,433,522 | 679,656 |
| Events in quadrant B | 3,544,406 | 711,450 |
| Events in quadrant C | 3,912,602 | 678,364 |
| Events in quadrant D | 9,035,787 | 588,241 |
| Mode SS | |||
|---|---|---|---|
| Quadrant | BADHDUFLAG | Total packets | Discarded packets |
| A | 0 | 128 | 0 |
| B | 0 | 128 | 0 |
| C | 0 | 128 | 0 |
| D | 0 | 128 | 0 |
| Mode M0 | |||
|---|---|---|---|
| Quadrant | BADHDUFLAG | Total packets | Discarded packets |
| A | 0 | 14052 | 2 |
| B | 0 | 14444 | 2 |
| C | 0 | 15779 | 2 |
| D | 0 | 31350 | 2 |
| Mode M9 | |||
|---|---|---|---|
| Quadrant | BADHDUFLAG | Total packets | Discarded packets |
| A | 0 | 14 | 0 |
| B | 0 | 15 | 0 |
| C | 0 | 15 | 0 |
| D | 0 | 15 | 0 |
| Quadrant | Total seconds | Saturated seconds | Saturation percentage |
|---|---|---|---|
| A | 6343 | 38 | 0.599086% |
| B | 6343 | 96 | 1.513479% |
| C | 6343 | 202 | 3.184613% |
| D | 6343 | 1352 | 21.314835% |
Noise dominated data is calculated using 1-second bins in cleaned event files. If a bin has >2000 counts, and if more than 50% of those come from <1% of pixels, then it is considered to be noise-dominated and hence unusable.
| Quadrant | # 1 sec bins | Bins with >0 counts | Bins with >2000 counts | High rate bins dominated by noise | Noise dominated (total time) | Noise dominated (detector-on time) | Marked lightcurve |
|---|---|---|---|---|---|---|---|
| A | 7598 | 6343 | 5 | 5 | 0.07% | 0.08% | 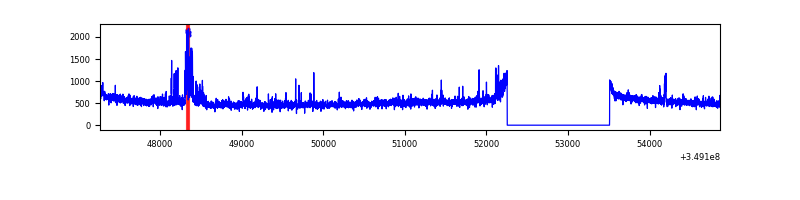 |
| B | 7598 | 6343 | 28 | 28 | 0.37% | 0.44% | 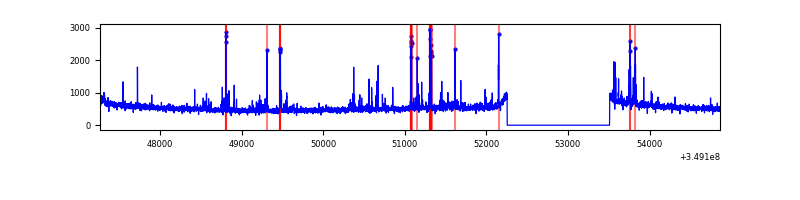 |
| C | 7598 | 6343 | 1 | 1 | 0.01% | 0.02% | 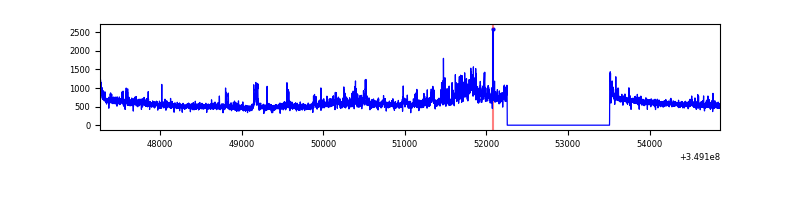 |
| D | 7597 | 6342 | 1328 | 1328 | 17.48% | 20.94% | 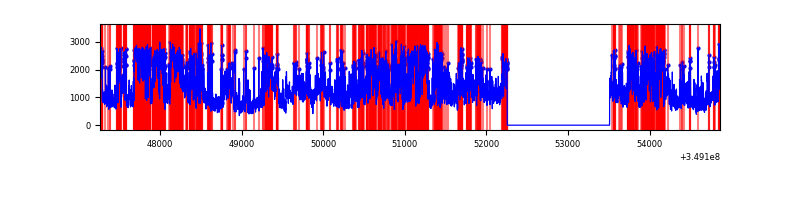 |
Top three noisy pixels from each quadrant. If the there are fewer than three noisy pixels in the level2.evt file, extra rows are filled as -1
| Pixel properties | Quadrant properties | ||||||
|---|---|---|---|---|---|---|---|
| Quadrant | DetID | PixID | Counts | Sigma | Mean | Median | Sigma |
| A | 14 | 235 | 189202 | 1147.09 | 831 | 815 | 164.2 |
| A | 4 | 2 | 15902 | 91.86 | 831 | 815 | 164.2 |
| A | 13 | 254 | 12233 | 69.52 | 831 | 815 | 164.2 |
| B | 10 | 246 | 208334 | 1345.62 | 839 | 820 | 154.2 |
| B | 12 | 111 | 18205 | 112.73 | 839 | 820 | 154.2 |
| B | 0 | 229 | 17816 | 110.21 | 839 | 820 | 154.2 |
| C | 3 | 233 | 512307 | 2690.68 | 820 | 827 | 190.1 |
| C | 14 | 238 | 156194 | 817.32 | 820 | 827 | 190.1 |
| C | 14 | 254 | 38405 | 197.68 | 820 | 827 | 190.1 |
| D | 1 | 52 | 3412222 | 18971.76 | 759 | 739 | 179.8 |
| D | 8 | 195 | 1384303 | 7694.2 | 759 | 739 | 179.8 |
| D | 13 | 104 | 1231998 | 6847.21 | 759 | 739 | 179.8 |
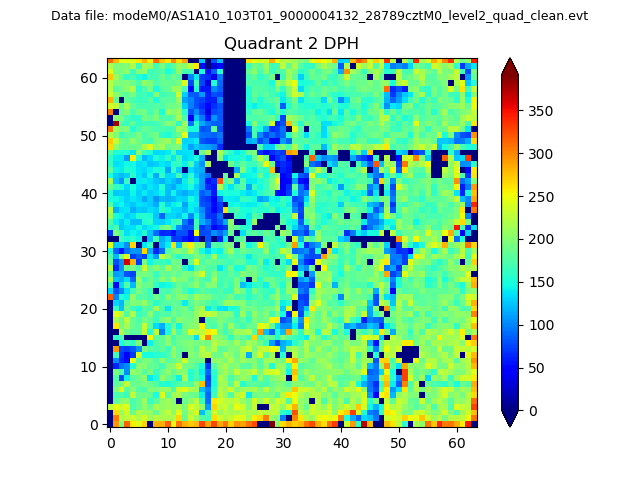
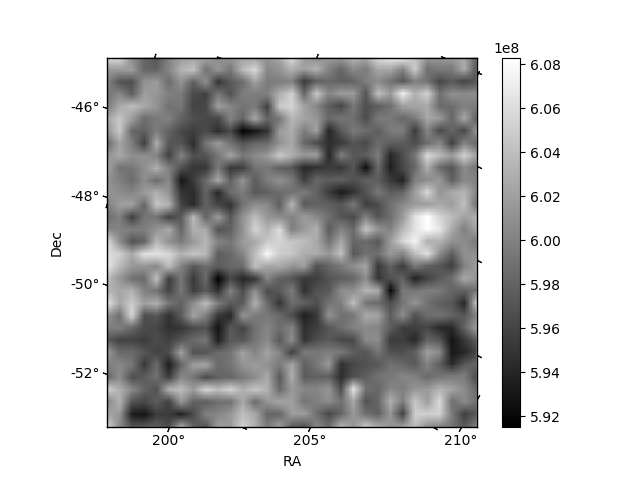
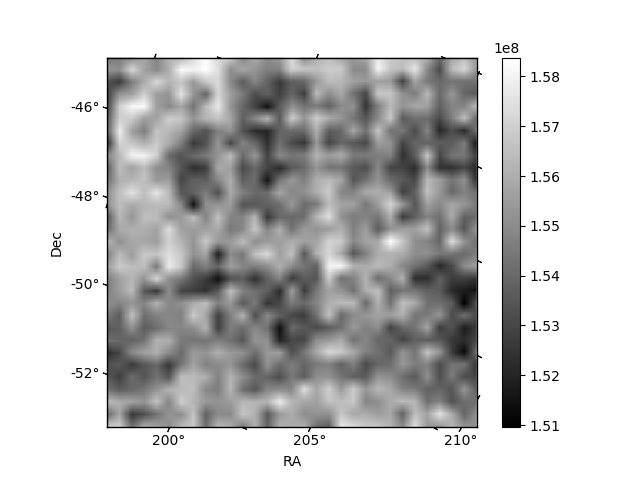
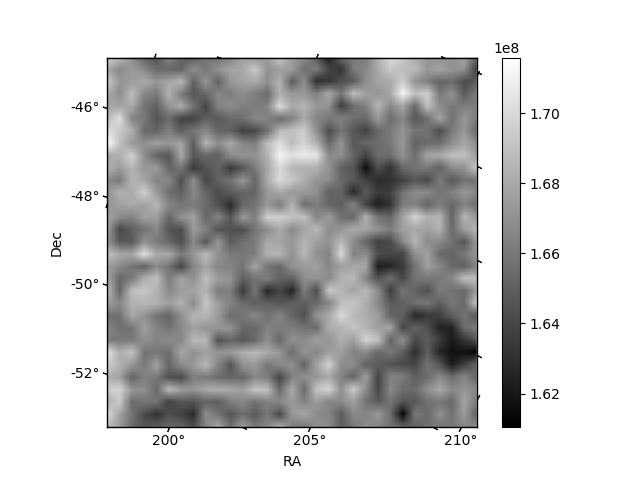
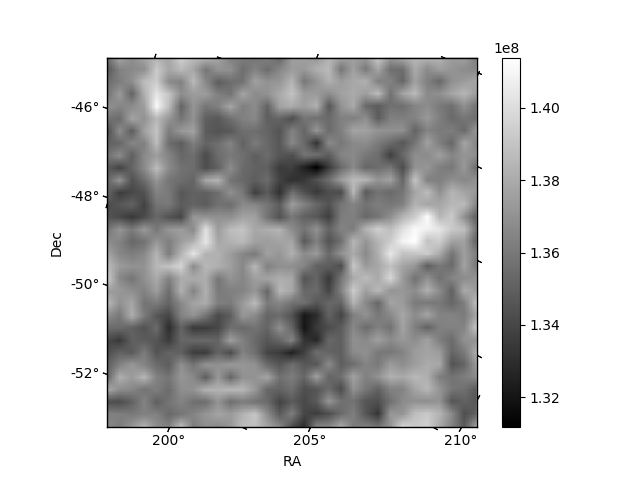
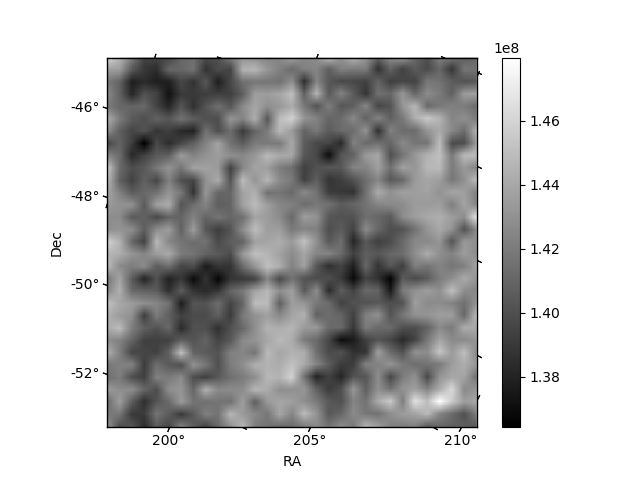
Histogram calculated using DETX and DETY for each event in the final _common_clean file
| Quadrant A | 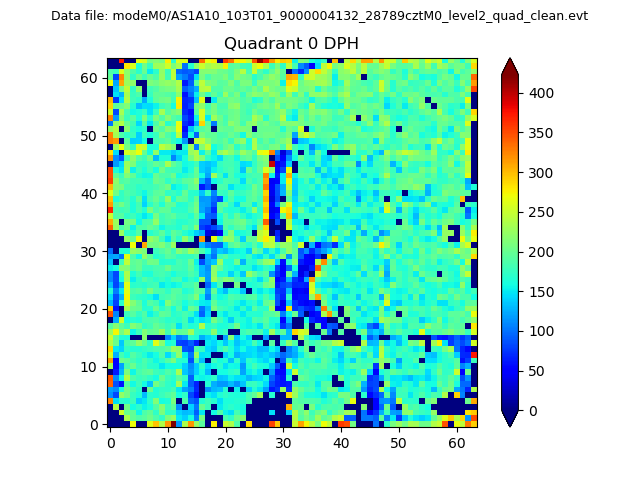 |
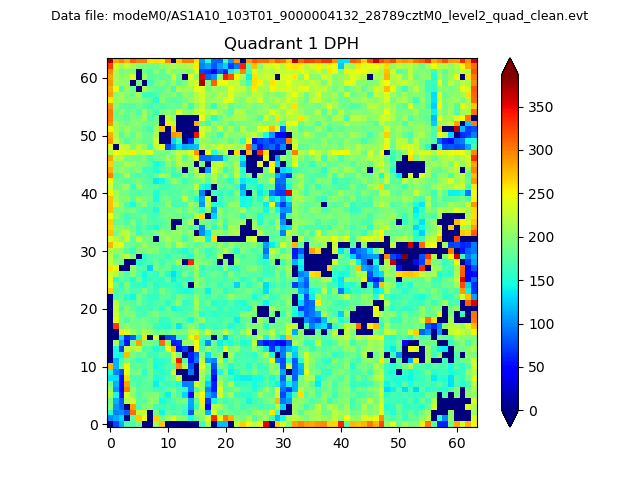 |
Quadrant B |
|---|---|---|---|
| Quadrant D | 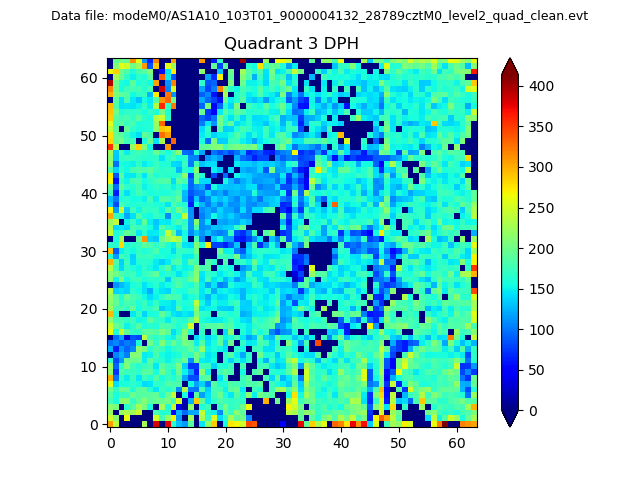 |
 |
Quadrant C |
| Plot type | Count rate plots | Images |
|---|---|---|
| Comparison with Poisson distribution Blue bars denote a histogram of data divided into 1 sec bins. Red curve is a Poisson curve with rate = median count rate of data. |
 |
 |
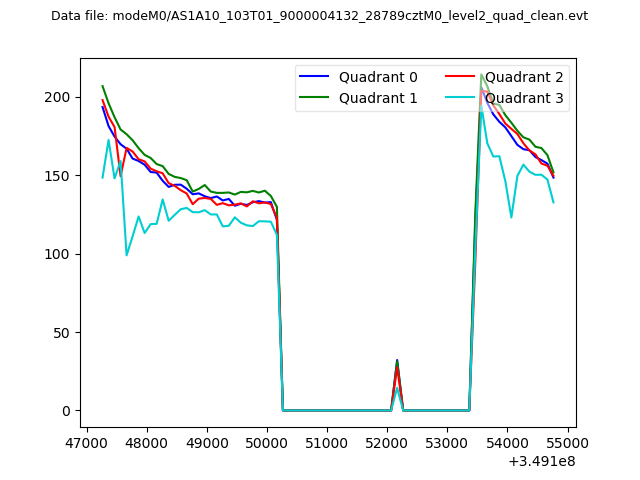
| Quadrant-wise count rates Data is divided into 100 sec bins |
 |
|
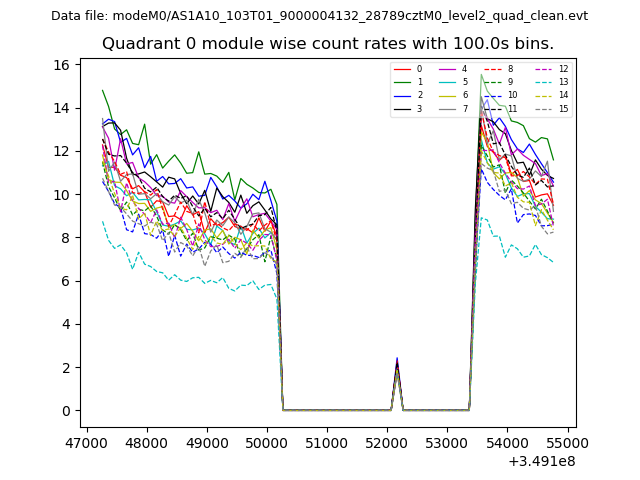
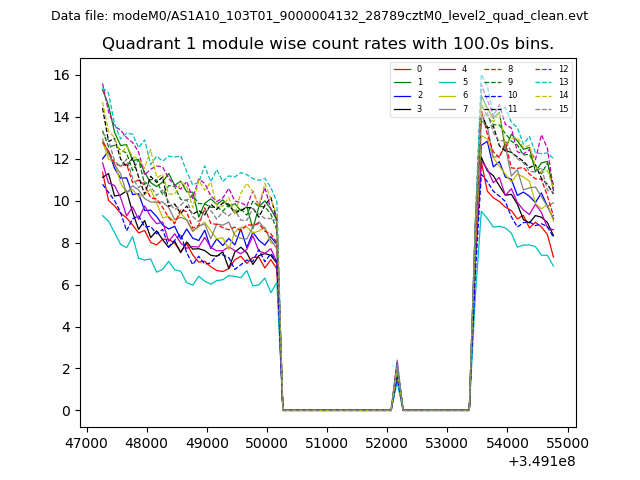
| Module-wise count rates for Quadrant A Data is divided into 100 sec bins |
 |
 |
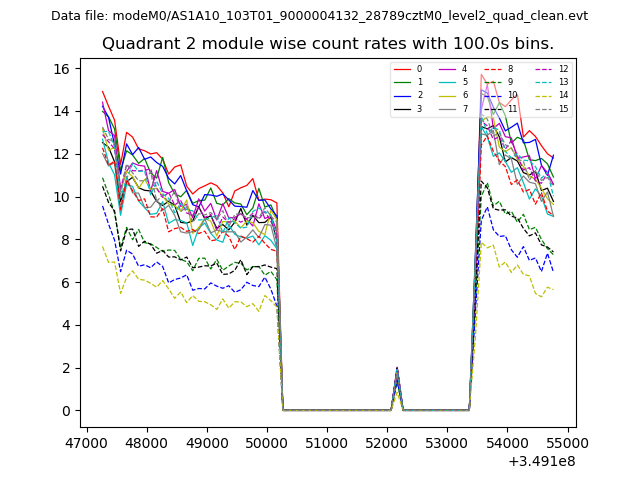
| Module-wise count rates for Quadrant B Data is divided into 100 sec bins |
 |
 |
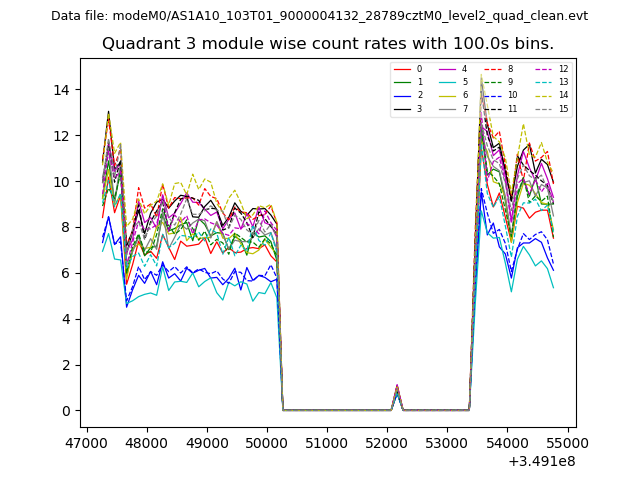
| Module-wise count rates for Quadrant C Data is divided into 100 sec bins |
 |
 |
| Module-wise count rates for Quadrant D Data is divided into 100 sec bins |
 |
 |
| Parameter | Plot |
|---|---|
| CZT HV Monitor | 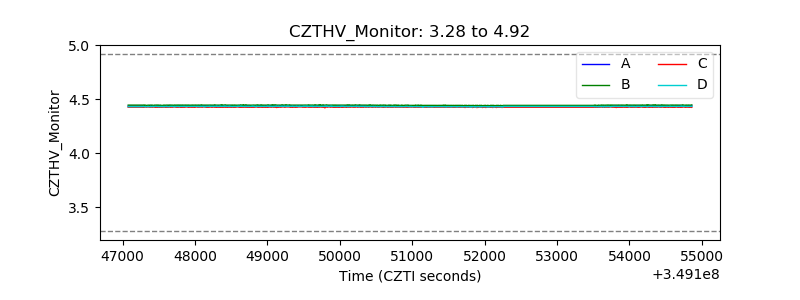 |
| D_VDD | 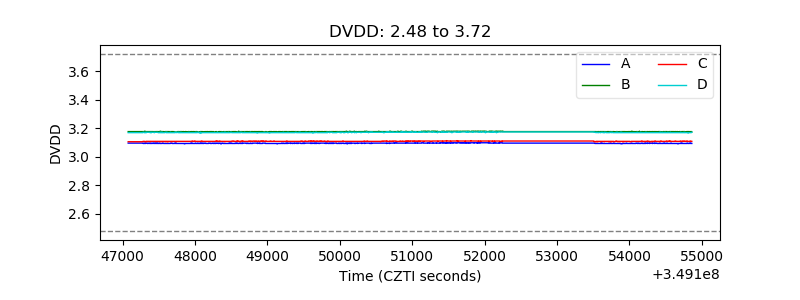 |
| Temperature 1 | 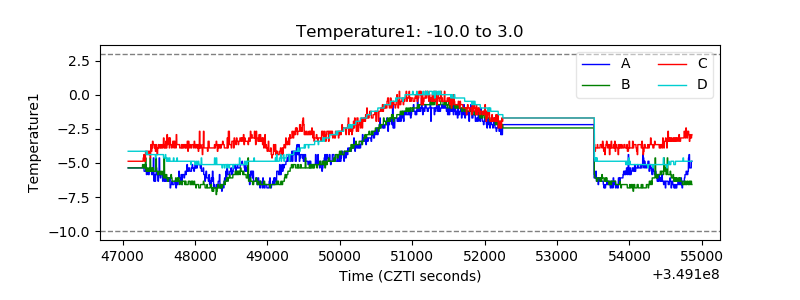 |
| Veto HV Monitor | 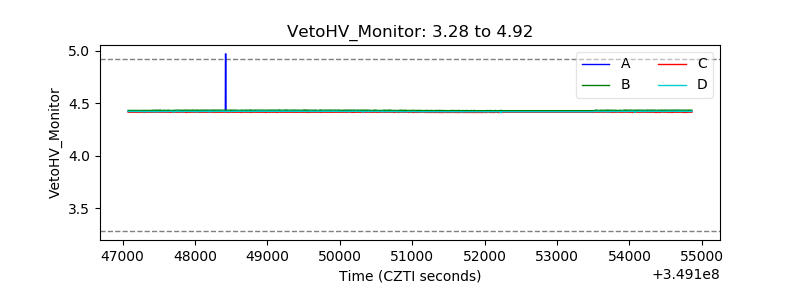 |
| Veto LLD | 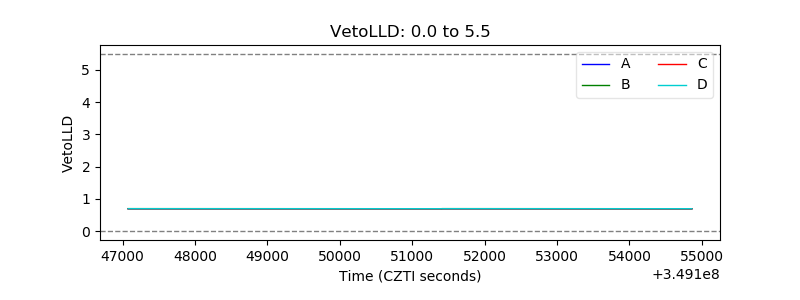 |
| Alpha Counter | 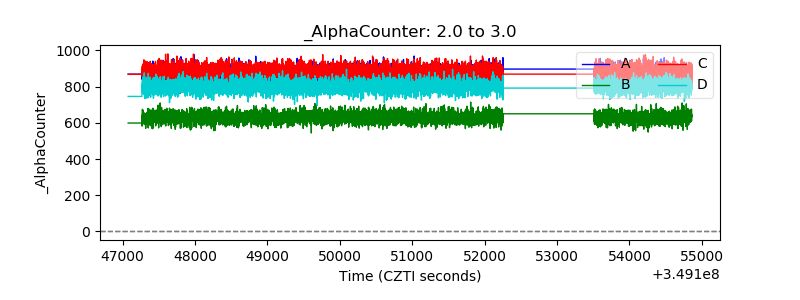 |
| _CPM_Rate | 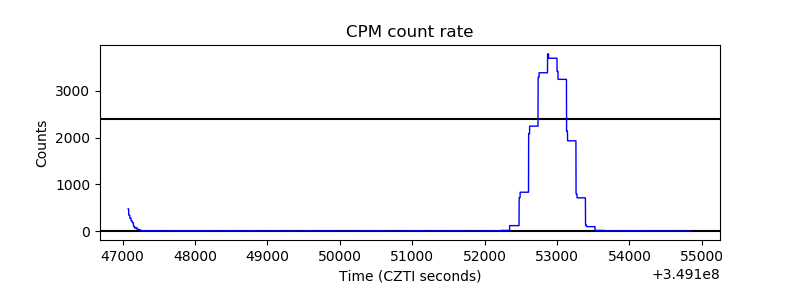 |
| CZT Counter | 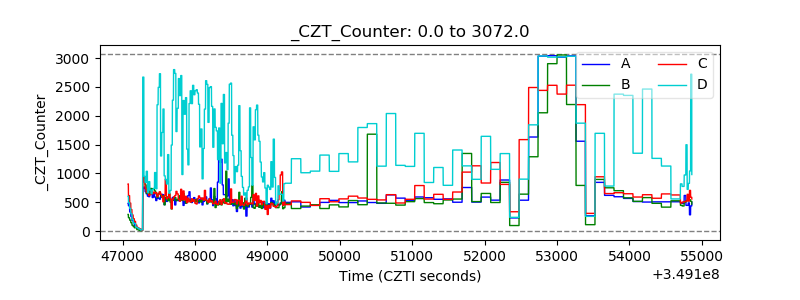 |
| +2.5 Volts monitor | 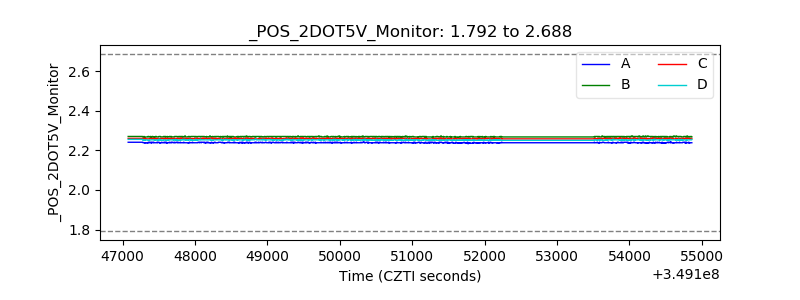 |
| +5 Volts monitor |  |
| _ROLL_ROT | 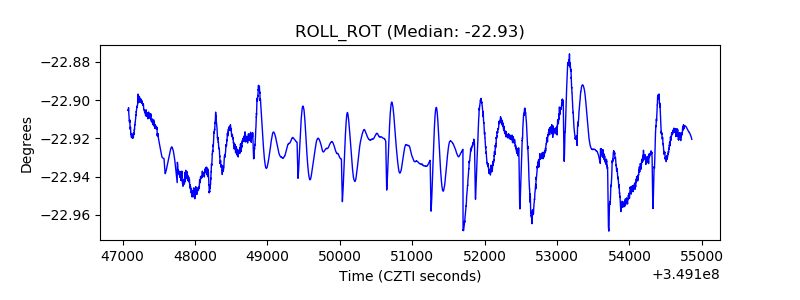 |
| _Roll_DEC | 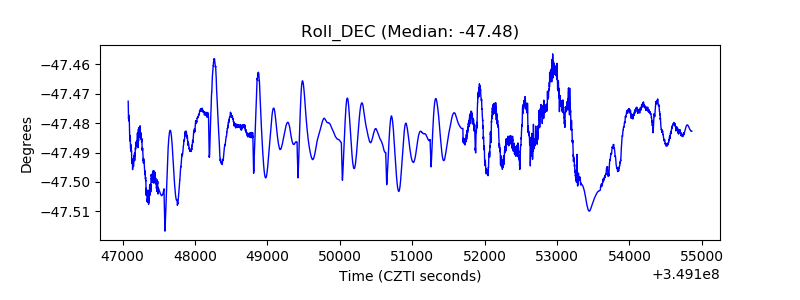 |
| _Roll_RA | 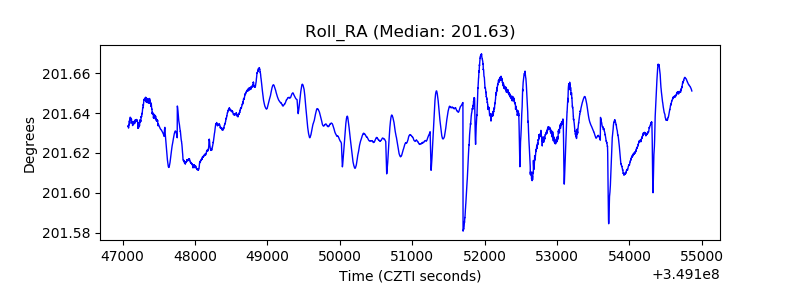 |
| Veto Counter | 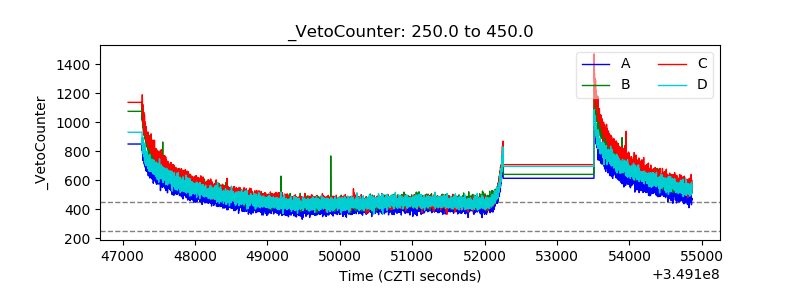 |