| Param | Original file | Final file |
|---|---|---|
| Filename | modeM0/AS1A10_103T01_9000004132_28790cztM0_level2.evt | modeM0/AS1A10_103T01_9000004132_28790cztM0_level2_quad_clean.evt |
| Size (bytes) | 603,792,000 | 97,683,840 |
| Size | 575.8 MB | 93.2 MB |
| Events in quadrant A | 3,266,730 | 650,514 |
| Events in quadrant B | 3,329,474 | 673,846 |
| Events in quadrant C | 3,659,196 | 650,562 |
| Events in quadrant D | 7,626,740 | 566,156 |
| Mode SS | |||
|---|---|---|---|
| Quadrant | BADHDUFLAG | Total packets | Discarded packets |
| A | 0 | 122 | 0 |
| B | 0 | 122 | 0 |
| C | 0 | 122 | 0 |
| D | 0 | 122 | 0 |
| Mode M0 | |||
|---|---|---|---|
| Quadrant | BADHDUFLAG | Total packets | Discarded packets |
| A | 0 | 13198 | 1 |
| B | 0 | 13502 | 1 |
| C | 0 | 14844 | 1 |
| D | 0 | 26899 | 1 |
| Mode M9 | |||
|---|---|---|---|
| Quadrant | BADHDUFLAG | Total packets | Discarded packets |
| A | 0 | 13 | 0 |
| B | 0 | 13 | 0 |
| C | 0 | 13 | 0 |
| D | 0 | 13 | 0 |
| Quadrant | Total seconds | Saturated seconds | Saturation percentage |
|---|---|---|---|
| A | 5967 | 33 | 0.553042% |
| B | 5967 | 75 | 1.256913% |
| C | 5968 | 137 | 2.295576% |
| D | 5968 | 1122 | 18.800268% |
Noise dominated data is calculated using 1-second bins in cleaned event files. If a bin has >2000 counts, and if more than 50% of those come from <1% of pixels, then it is considered to be noise-dominated and hence unusable.
| Quadrant | # 1 sec bins | Bins with >0 counts | Bins with >2000 counts | High rate bins dominated by noise | Noise dominated (total time) | Noise dominated (detector-on time) | Marked lightcurve |
|---|---|---|---|---|---|---|---|
| A | 7312 | 5967 | 1 | 1 | 0.01% | 0.02% | 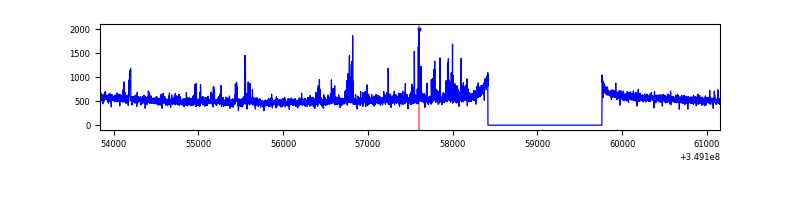 |
| B | 7312 | 5967 | 13 | 13 | 0.18% | 0.22% | 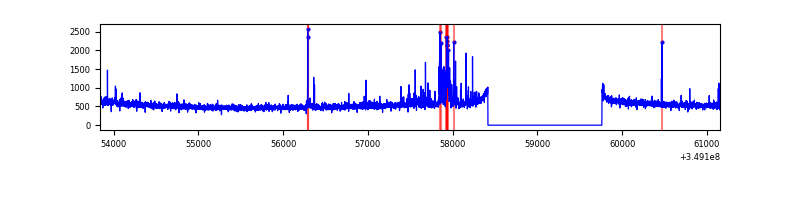 |
| C | 7313 | 5968 | 8 | 8 | 0.11% | 0.13% | 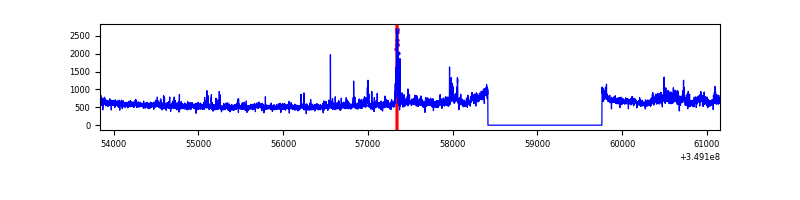 |
| D | 7313 | 5968 | 1076 | 1076 | 14.71% | 18.03% | 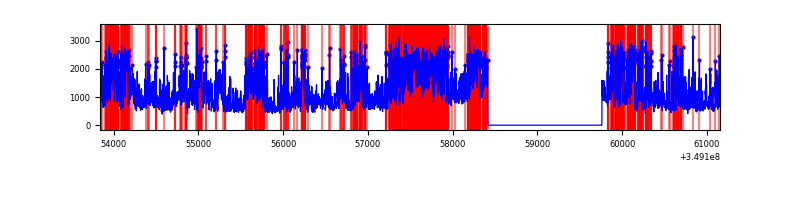 |
Top three noisy pixels from each quadrant. If the there are fewer than three noisy pixels in the level2.evt file, extra rows are filled as -1
| Pixel properties | Quadrant properties | ||||||
|---|---|---|---|---|---|---|---|
| Quadrant | DetID | PixID | Counts | Sigma | Mean | Median | Sigma |
| A | 14 | 235 | 128385 | 806.75 | 797 | 783 | 158.2 |
| A | 1 | 113 | 45969 | 285.68 | 797 | 783 | 158.2 |
| A | 13 | 254 | 11234 | 66.07 | 797 | 783 | 158.2 |
| B | 5 | 172 | 123512 | 840.46 | 800 | 782 | 146.0 |
| B | 10 | 246 | 21130 | 139.34 | 800 | 782 | 146.0 |
| B | 0 | 229 | 20691 | 136.34 | 800 | 782 | 146.0 |
| C | 3 | 233 | 314376 | 1712.04 | 794 | 803 | 183.2 |
| C | 14 | 238 | 147883 | 803.03 | 794 | 803 | 183.2 |
| C | 15 | 208 | 42803 | 229.31 | 794 | 803 | 183.2 |
| D | 1 | 52 | 2860985 | 16475.33 | 736 | 718 | 173.6 |
| D | 8 | 195 | 996469 | 5735.59 | 736 | 718 | 173.6 |
| D | 13 | 104 | 908452 | 5228.61 | 736 | 718 | 173.6 |
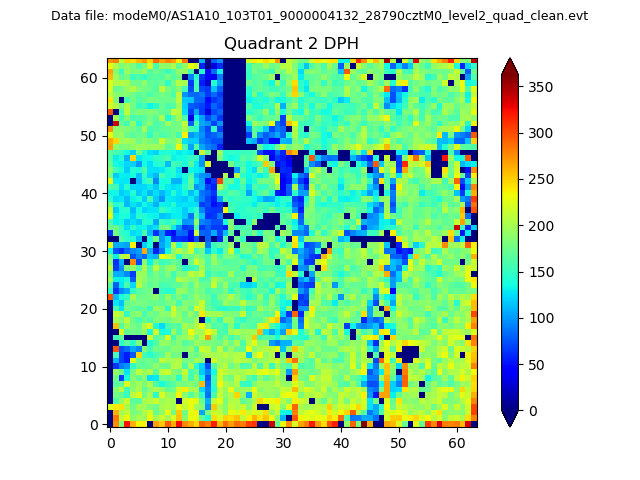
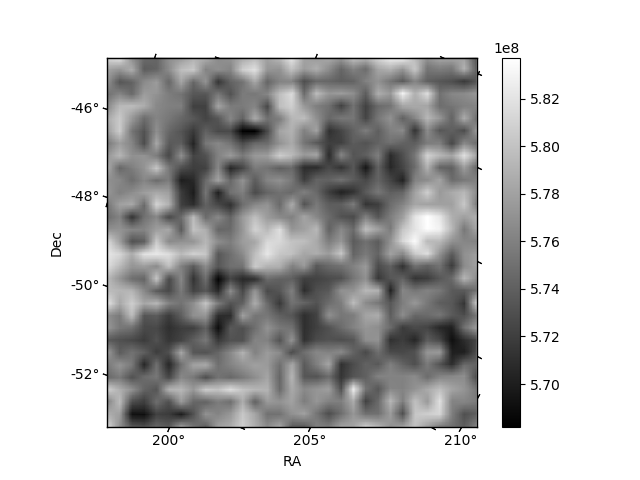
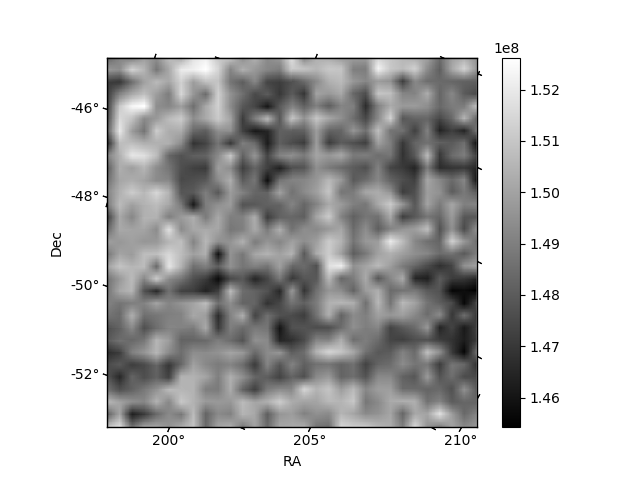
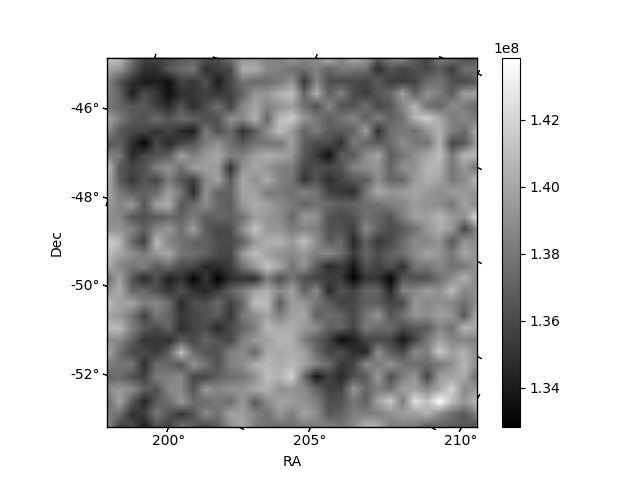
Histogram calculated using DETX and DETY for each event in the final _common_clean file
| Quadrant A | 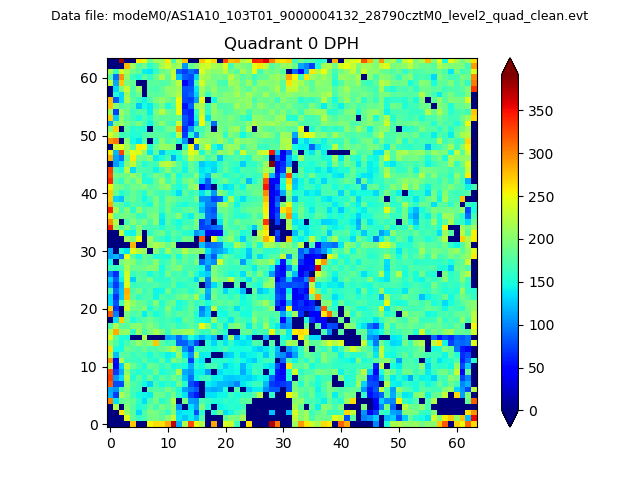 |
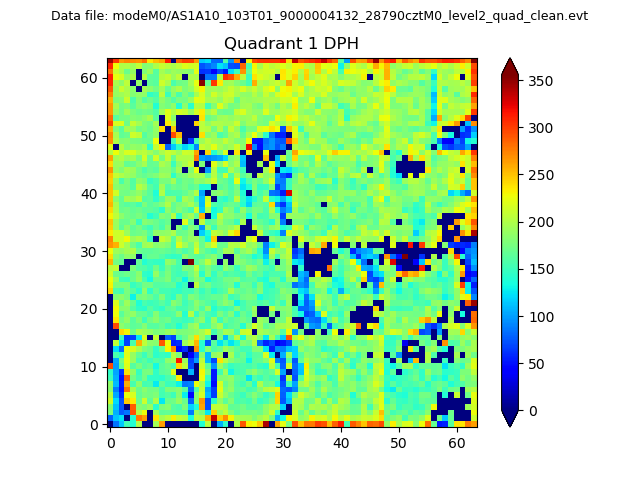 |
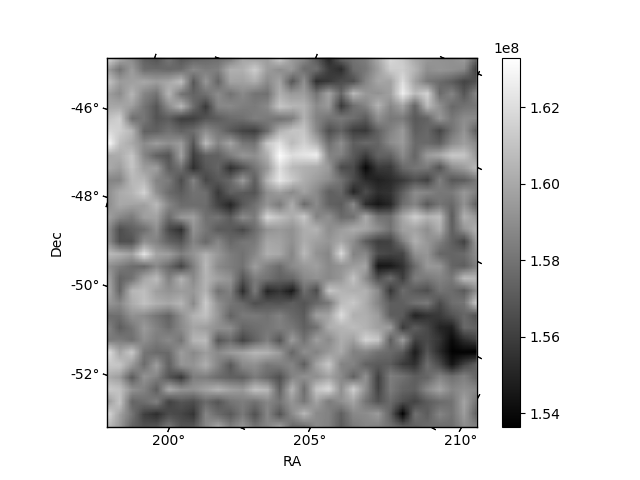
Quadrant B |
|---|---|---|---|
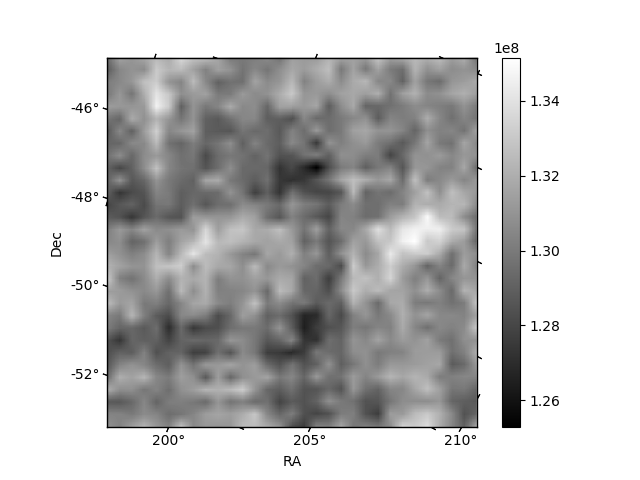
| Quadrant D | 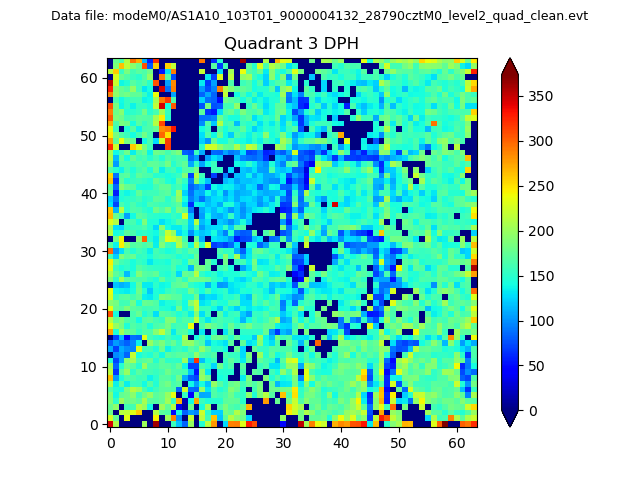 |
 |
Quadrant C |
| Plot type | Count rate plots | Images |
|---|---|---|
| Comparison with Poisson distribution Blue bars denote a histogram of data divided into 1 sec bins. Red curve is a Poisson curve with rate = median count rate of data. |
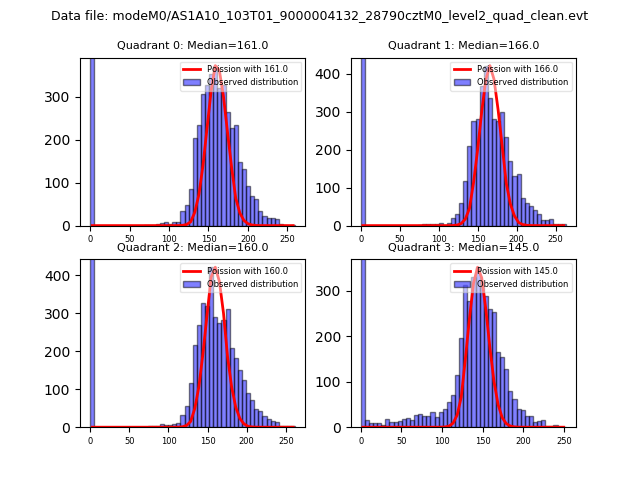 |
 |
| Quadrant-wise count rates Data is divided into 100 sec bins |
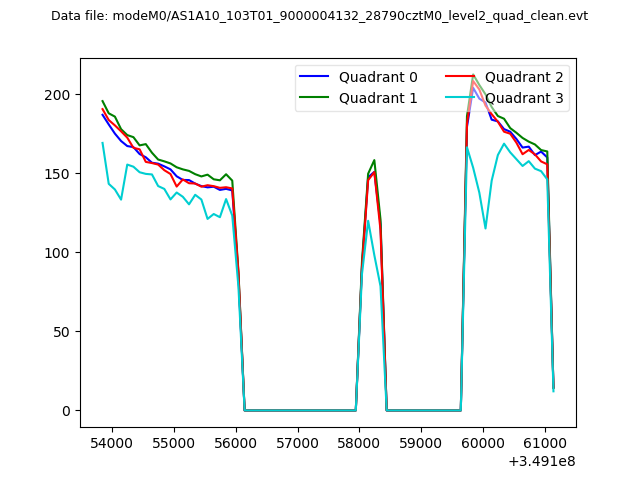 |
|
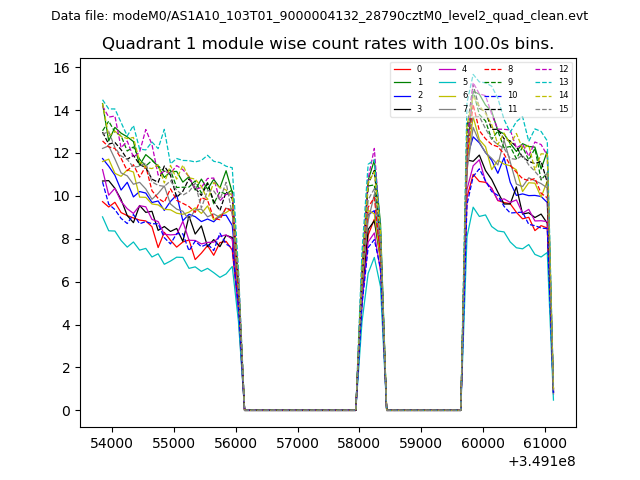
| Module-wise count rates for Quadrant A Data is divided into 100 sec bins |
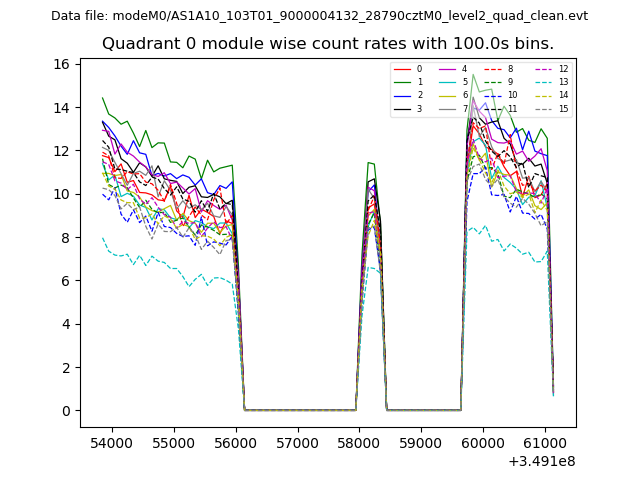 |
 |
| Module-wise count rates for Quadrant B Data is divided into 100 sec bins |
 |
 |
| Module-wise count rates for Quadrant C Data is divided into 100 sec bins |
 |
 |
| Module-wise count rates for Quadrant D Data is divided into 100 sec bins |
 |
 |
| Parameter | Plot |
|---|---|
| CZT HV Monitor | 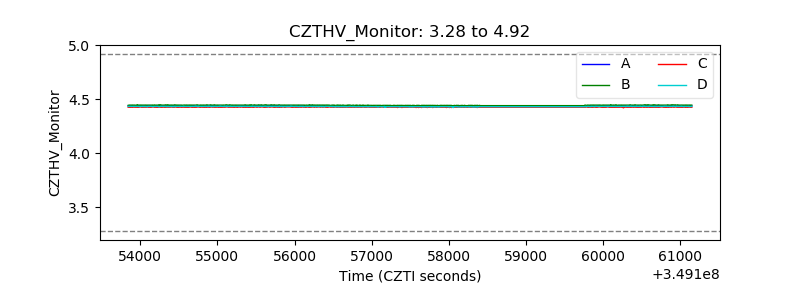 |
| D_VDD | 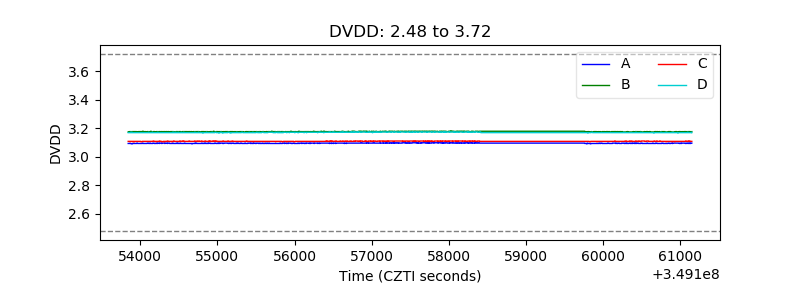 |
| Temperature 1 |  |
| Veto HV Monitor |  |
| Veto LLD |  |
| Alpha Counter | 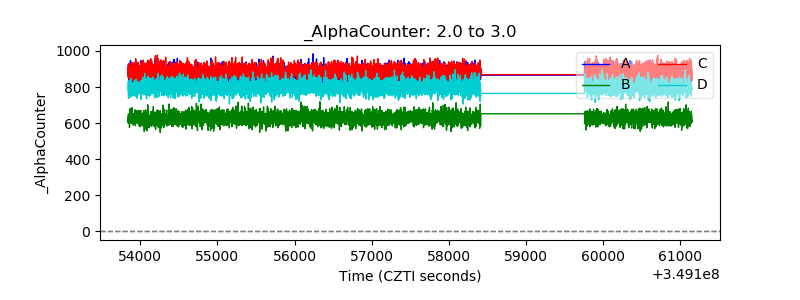 |
| _CPM_Rate | 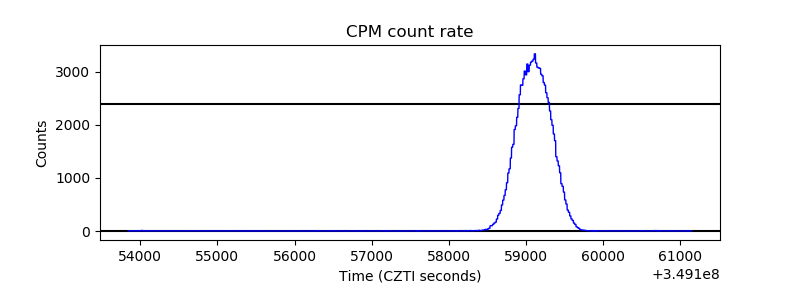 |
| CZT Counter | 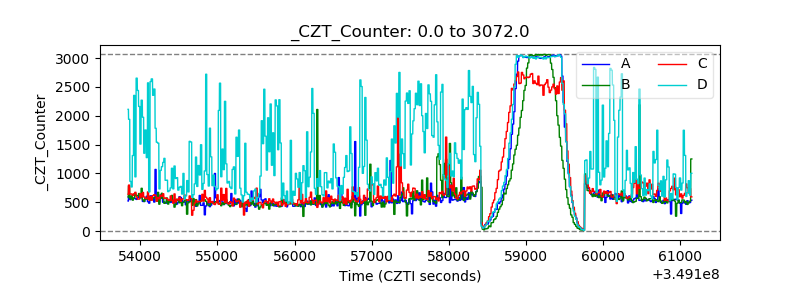 |
| +2.5 Volts monitor |  |
| +5 Volts monitor |  |
| _ROLL_ROT | 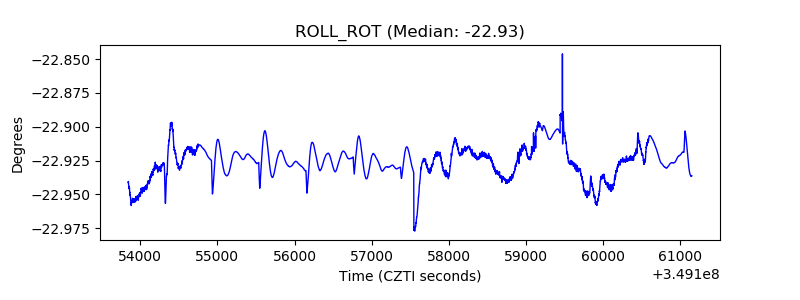 |
| _Roll_DEC | 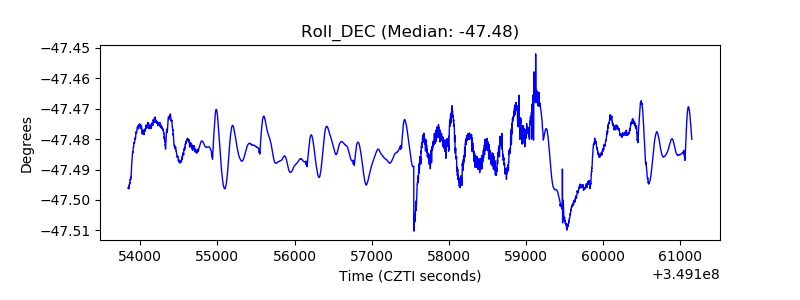 |
| _Roll_RA | 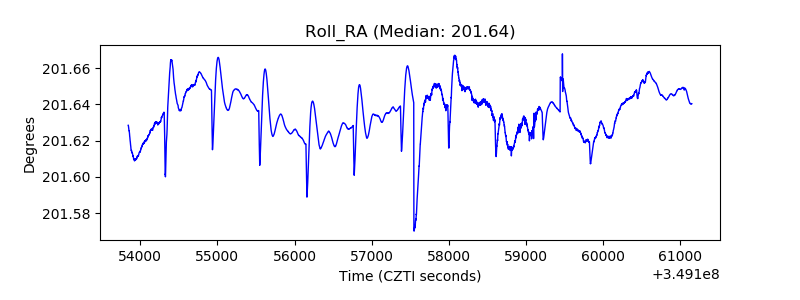 |
| Veto Counter |  |