| Param | Original file | Final file |
|---|---|---|
| Filename | modeM0/AS1A10_103T01_9000004132_28791cztM0_level2.evt | modeM0/AS1A10_103T01_9000004132_28791cztM0_level2_quad_clean.evt |
| Size (bytes) | 577,609,920 | 87,603,840 |
| Size | 550.9 MB | 83.5 MB |
| Events in quadrant A | 2,942,655 | 579,981 |
| Events in quadrant B | 3,324,787 | 592,506 |
| Events in quadrant C | 5,246,331 | 556,541 |
| Events in quadrant D | 5,603,852 | 535,039 |
| Mode SS | |||
|---|---|---|---|
| Quadrant | BADHDUFLAG | Total packets | Discarded packets |
| A | 0 | 112 | 0 |
| B | 0 | 112 | 0 |
| C | 0 | 112 | 0 |
| D | 0 | 112 | 0 |
| Mode M0 | |||
|---|---|---|---|
| Quadrant | BADHDUFLAG | Total packets | Discarded packets |
| A | 0 | 11824 | 1 |
| B | 0 | 13114 | 1 |
| C | 0 | 19751 | 1 |
| D | 0 | 20632 | 3 |
| Mode M9 | |||
|---|---|---|---|
| Quadrant | BADHDUFLAG | Total packets | Discarded packets |
| A | 0 | 14 | 0 |
| B | 0 | 14 | 0 |
| C | 0 | 14 | 0 |
| D | 0 | 14 | 0 |
| Quadrant | Total seconds | Saturated seconds | Saturation percentage |
|---|---|---|---|
| A | 5558 | 40 | 0.719683% |
| B | 5559 | 125 | 2.248606% |
| C | 5559 | 525 | 9.444145% |
| D | 5558 | 449 | 8.078445% |
Noise dominated data is calculated using 1-second bins in cleaned event files. If a bin has >2000 counts, and if more than 50% of those come from <1% of pixels, then it is considered to be noise-dominated and hence unusable.
| Quadrant | # 1 sec bins | Bins with >0 counts | Bins with >2000 counts | High rate bins dominated by noise | Noise dominated (total time) | Noise dominated (detector-on time) | Marked lightcurve |
|---|---|---|---|---|---|---|---|
| A | 6908 | 5559 | 0 | 0 | 0.00% | 0.00% |  |
| B | 6909 | 5559 | 38 | 38 | 0.55% | 0.68% |  |
| C | 6909 | 5559 | 95 | 95 | 1.38% | 1.71% |  |
| D | 6908 | 5559 | 412 | 412 | 5.96% | 7.41% |  |
Top three noisy pixels from each quadrant. If the there are fewer than three noisy pixels in the level2.evt file, extra rows are filled as -1
| Pixel properties | Quadrant properties | ||||||
|---|---|---|---|---|---|---|---|
| Quadrant | DetID | PixID | Counts | Sigma | Mean | Median | Sigma |
| A | 14 | 235 | 19092 | 123.31 | 747 | 733 | 148.9 |
| A | 15 | 174 | 18594 | 119.97 | 747 | 733 | 148.9 |
| A | 13 | 254 | 10436 | 65.17 | 747 | 733 | 148.9 |
| B | 10 | 245 | 186302 | 1363.17 | 743 | 726 | 136.1 |
| B | 10 | 246 | 79105 | 575.74 | 743 | 726 | 136.1 |
| B | 5 | 255 | 62209 | 451.63 | 743 | 726 | 136.1 |
| C | 3 | 233 | 2223524 | 13315.15 | 723 | 731 | 166.9 |
| C | 14 | 238 | 143537 | 855.45 | 723 | 731 | 166.9 |
| C | 14 | 254 | 39306 | 231.08 | 723 | 731 | 166.9 |
| D | 1 | 52 | 1568643 | 9104.22 | 723 | 705 | 172.2 |
| D | 8 | 195 | 663012 | 3845.68 | 723 | 705 | 172.2 |
| D | 13 | 104 | 561993 | 3259.11 | 723 | 705 | 172.2 |
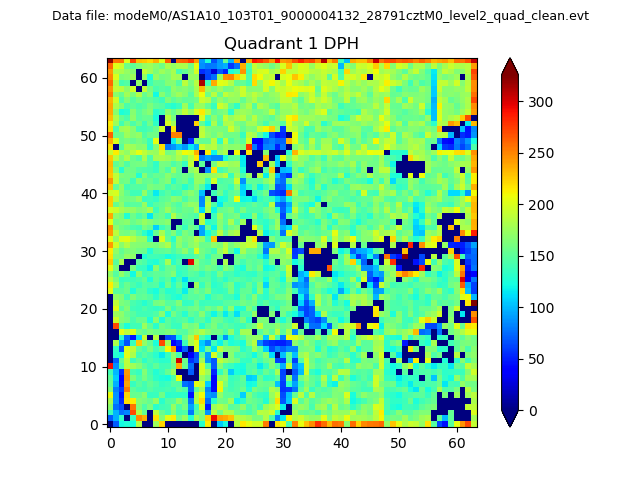
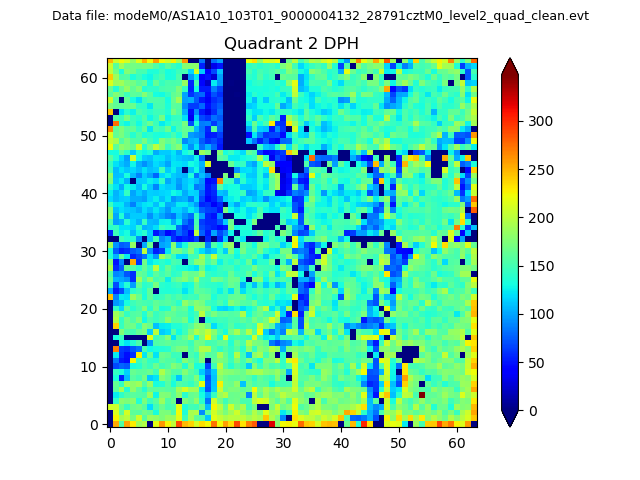
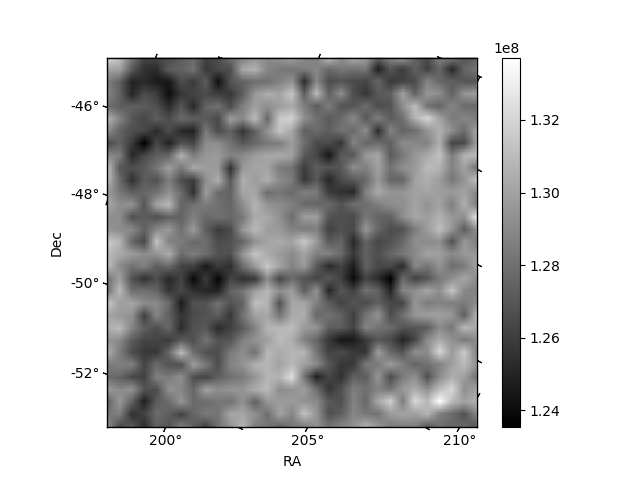
Histogram calculated using DETX and DETY for each event in the final _common_clean file
| Quadrant A |  |
 |
Quadrant B |
|---|---|---|---|
| Quadrant D |  |
 |
Quadrant C |
| Plot type | Count rate plots | Images |
|---|---|---|
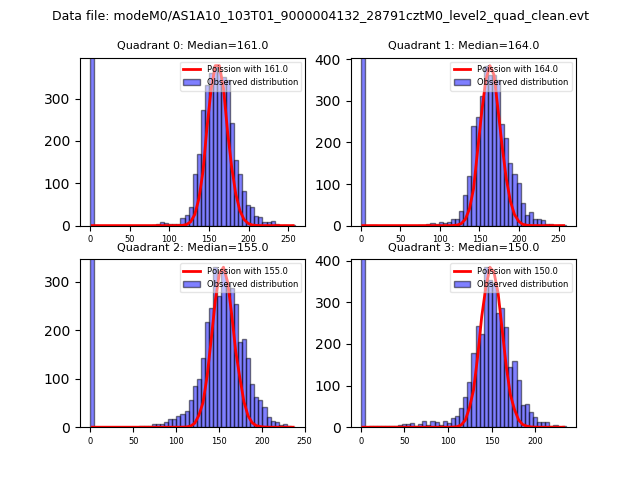
| Comparison with Poisson distribution Blue bars denote a histogram of data divided into 1 sec bins. Red curve is a Poisson curve with rate = median count rate of data. |
 |
 |
| Quadrant-wise count rates Data is divided into 100 sec bins |
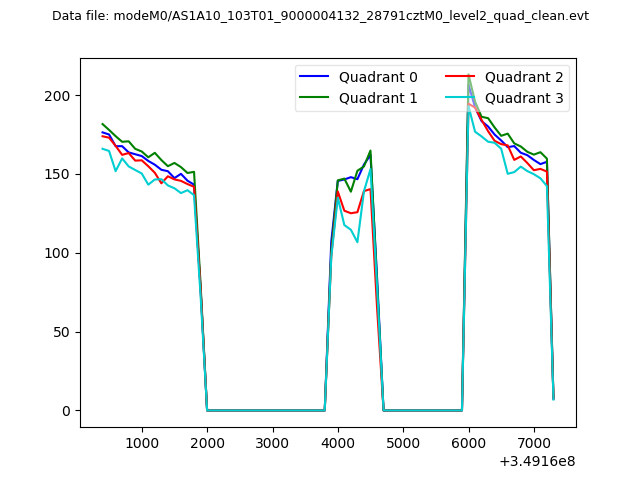 |
|
| Module-wise count rates for Quadrant A Data is divided into 100 sec bins |
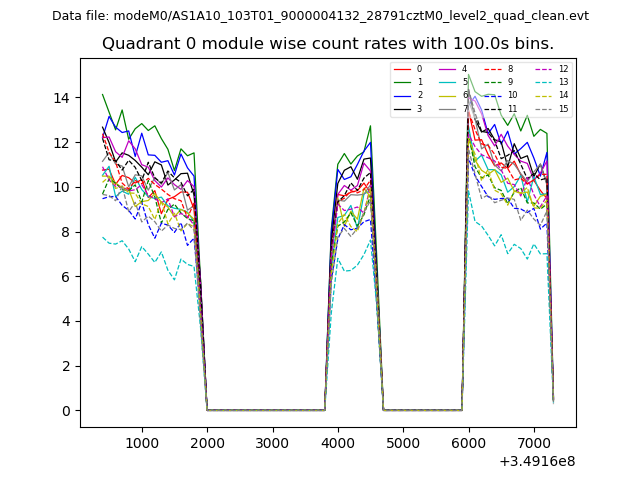 |
 |
| Module-wise count rates for Quadrant B Data is divided into 100 sec bins |
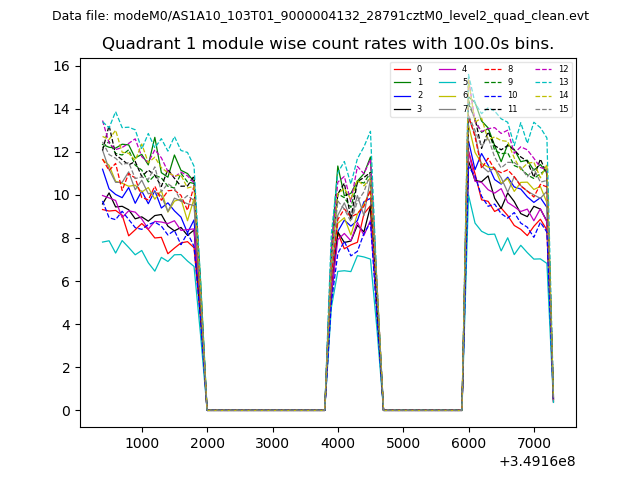 |
 |
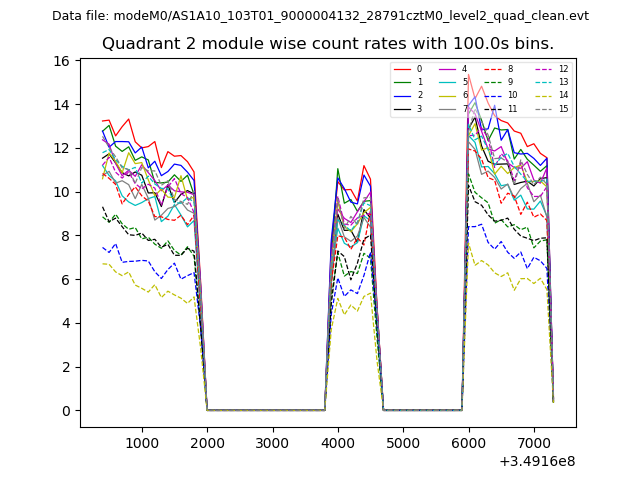
| Module-wise count rates for Quadrant C Data is divided into 100 sec bins |
 |
 |
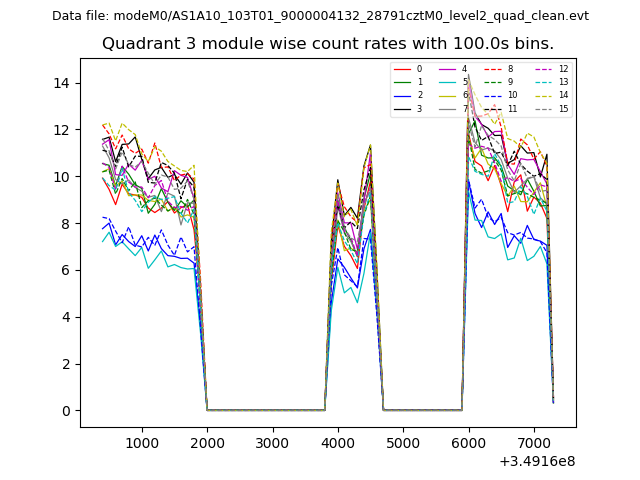
| Module-wise count rates for Quadrant D Data is divided into 100 sec bins |
 |
 |
| Parameter | Plot |
|---|---|
| CZT HV Monitor | 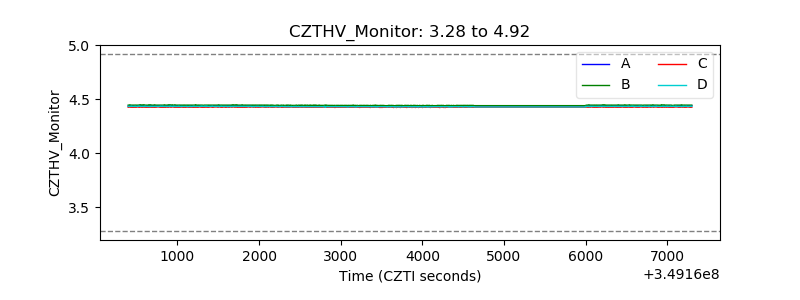 |
| D_VDD | 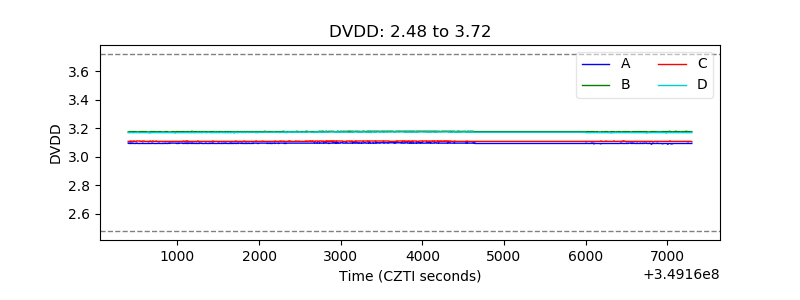 |
| Temperature 1 |  |
| Veto HV Monitor | 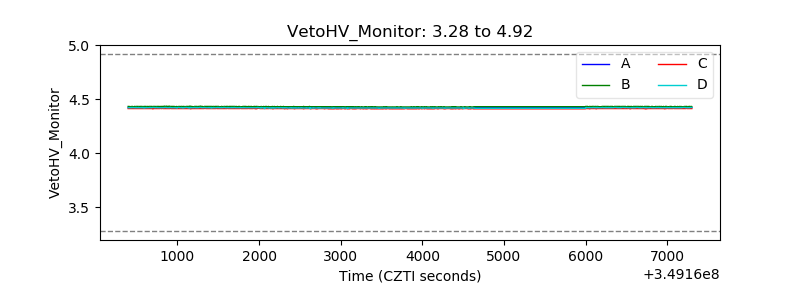 |
| Veto LLD | 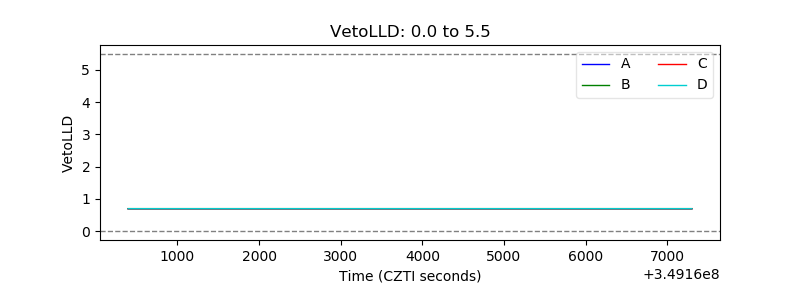 |
| Alpha Counter | 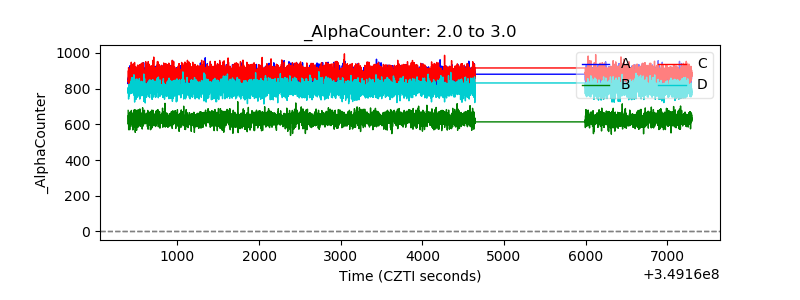 |
| _CPM_Rate | 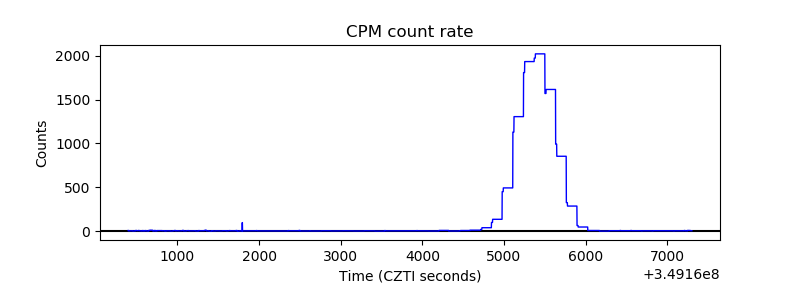 |
| CZT Counter | 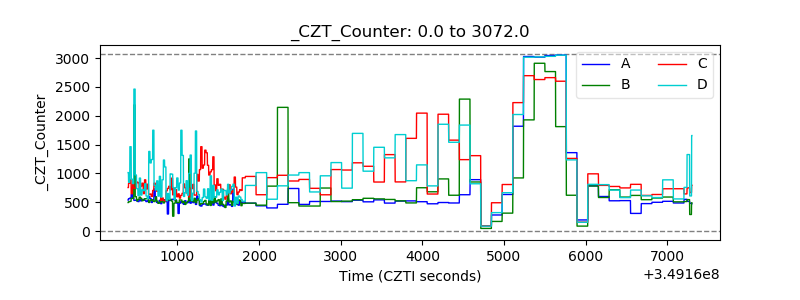 |
| +2.5 Volts monitor |  |
| +5 Volts monitor |  |
| _ROLL_ROT | 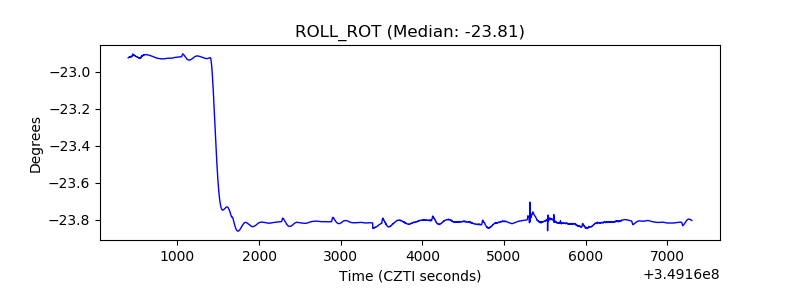 |
| _Roll_DEC | 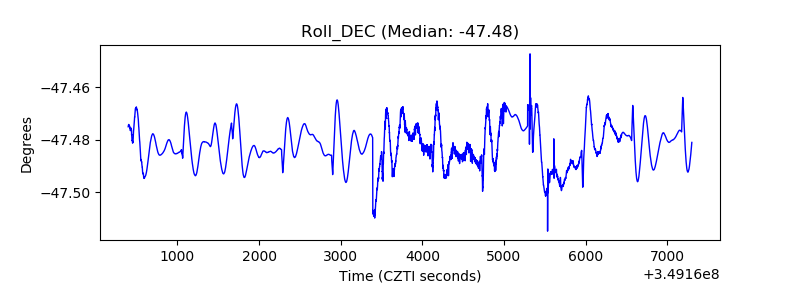 |
| _Roll_RA | 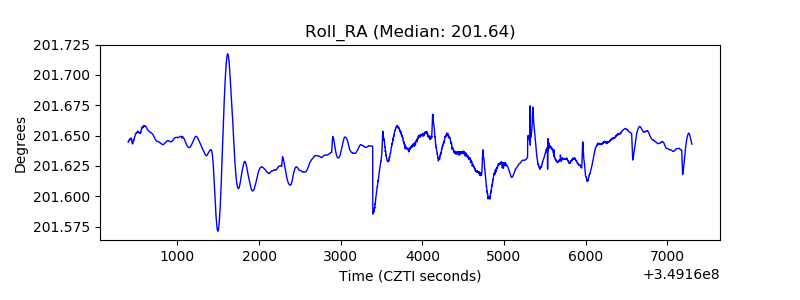 |
| Veto Counter | 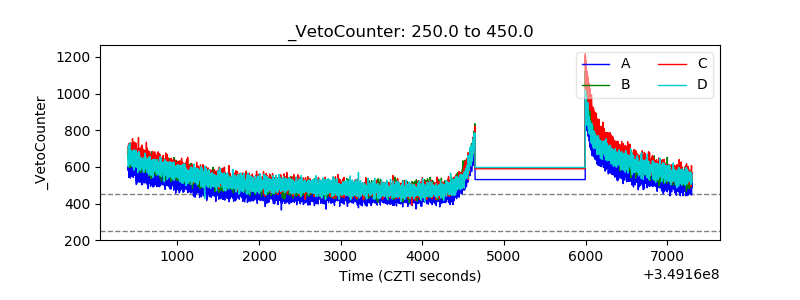 |