| Param | Original file | Final file |
|---|---|---|
| Filename | modeM0/AS1A10_103T01_9000004132_28792cztM0_level2.evt | modeM0/AS1A10_103T01_9000004132_28792cztM0_level2_quad_clean.evt |
| Size (bytes) | 647,429,760 | 100,468,800 |
| Size | 617.4 MB | 95.8 MB |
| Events in quadrant A | 3,255,482 | 665,897 |
| Events in quadrant B | 3,773,571 | 680,250 |
| Events in quadrant C | 5,629,594 | 645,741 |
| Events in quadrant D | 6,525,505 | 613,042 |
| Mode SS | |||
|---|---|---|---|
| Quadrant | BADHDUFLAG | Total packets | Discarded packets |
| A | 0 | 128 | 0 |
| B | 0 | 128 | 0 |
| C | 0 | 128 | 0 |
| D | 0 | 128 | 0 |
| Mode M0 | |||
|---|---|---|---|
| Quadrant | BADHDUFLAG | Total packets | Discarded packets |
| A | 0 | 13195 | 1 |
| B | 0 | 14839 | 1 |
| C | 0 | 21068 | 1 |
| D | 0 | 23979 | 1 |
| Mode M9 | |||
|---|---|---|---|
| Quadrant | BADHDUFLAG | Total packets | Discarded packets |
| A | 0 | 12 | 0 |
| B | 0 | 12 | 0 |
| C | 0 | 12 | 0 |
| D | 0 | 12 | 0 |
| Quadrant | Total seconds | Saturated seconds | Saturation percentage |
|---|---|---|---|
| A | 6266 | 59 | 0.941590% |
| B | 6265 | 204 | 3.256185% |
| C | 6265 | 578 | 9.225858% |
| D | 6265 | 549 | 8.762969% |
Noise dominated data is calculated using 1-second bins in cleaned event files. If a bin has >2000 counts, and if more than 50% of those come from <1% of pixels, then it is considered to be noise-dominated and hence unusable.
| Quadrant | # 1 sec bins | Bins with >0 counts | Bins with >2000 counts | High rate bins dominated by noise | Noise dominated (total time) | Noise dominated (detector-on time) | Marked lightcurve |
|---|---|---|---|---|---|---|---|
| A | 7506 | 6266 | 0 | 0 | 0.00% | 0.00% |  |
| B | 7505 | 6265 | 94 | 94 | 1.25% | 1.50% | 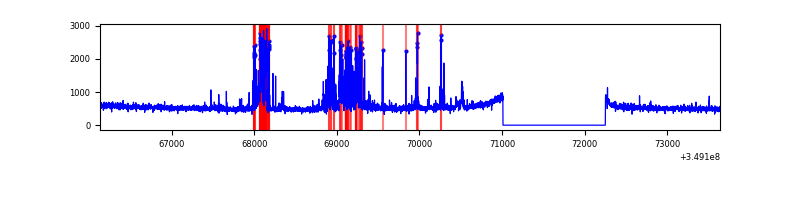 |
| C | 7505 | 6265 | 200 | 200 | 2.66% | 3.19% |  |
| D | 7505 | 6265 | 515 | 515 | 6.86% | 8.22% | 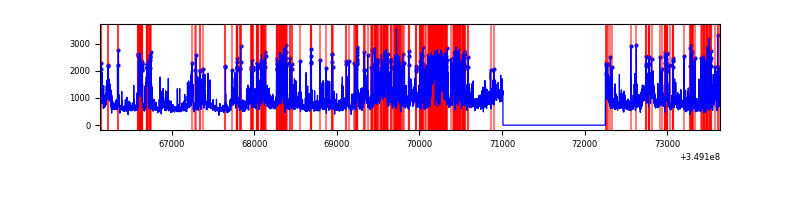 |
Top three noisy pixels from each quadrant. If the there are fewer than three noisy pixels in the level2.evt file, extra rows are filled as -1
| Pixel properties | Quadrant properties | ||||||
|---|---|---|---|---|---|---|---|
| Quadrant | DetID | PixID | Counts | Sigma | Mean | Median | Sigma |
| A | 15 | 174 | 17358 | 99.45 | 832 | 816 | 166.3 |
| A | 14 | 239 | 15412 | 87.75 | 832 | 816 | 166.3 |
| A | 13 | 254 | 11572 | 64.66 | 832 | 816 | 166.3 |
| B | 5 | 255 | 354322 | 2345.0 | 820 | 800 | 150.8 |
| B | 5 | 172 | 113536 | 747.81 | 820 | 800 | 150.8 |
| B | 10 | 246 | 26653 | 171.49 | 820 | 800 | 150.8 |
| C | 3 | 233 | 2115054 | 11395.68 | 801 | 810 | 185.5 |
| C | 14 | 238 | 163752 | 878.25 | 801 | 810 | 185.5 |
| C | 4 | 254 | 152752 | 818.96 | 801 | 810 | 185.5 |
| D | 1 | 52 | 1713162 | 9050.97 | 804 | 785 | 189.2 |
| D | 8 | 195 | 812815 | 4292.08 | 804 | 785 | 189.2 |
| D | 13 | 104 | 787716 | 4159.42 | 804 | 785 | 189.2 |
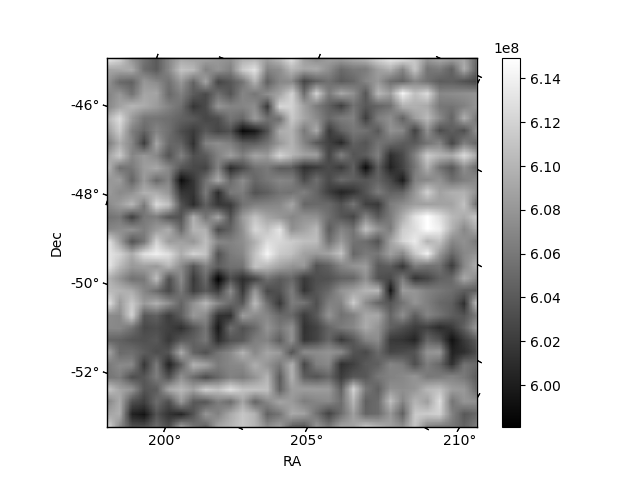
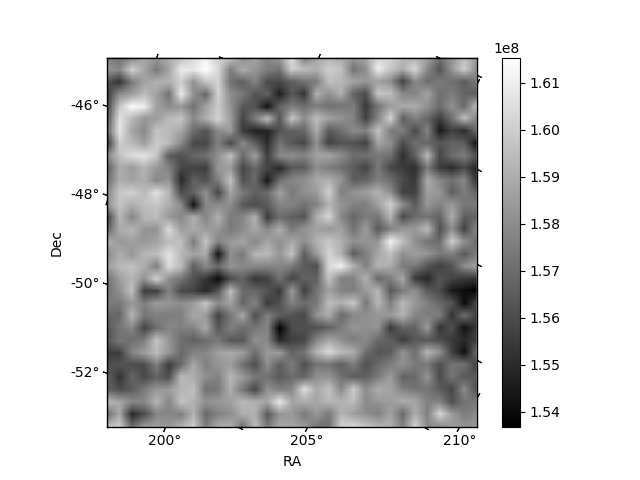
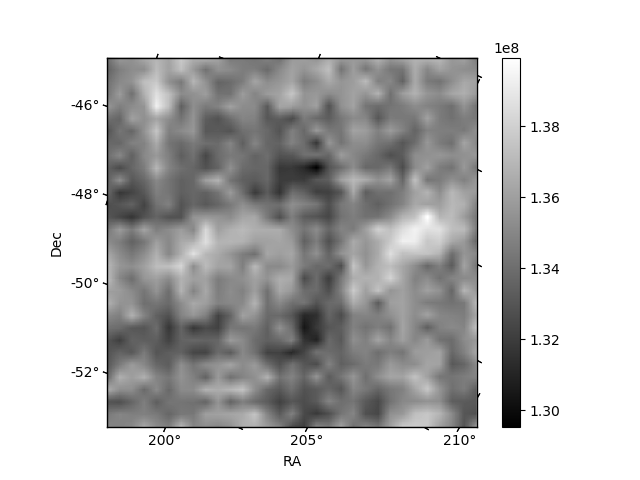
Histogram calculated using DETX and DETY for each event in the final _common_clean file
| Quadrant A | 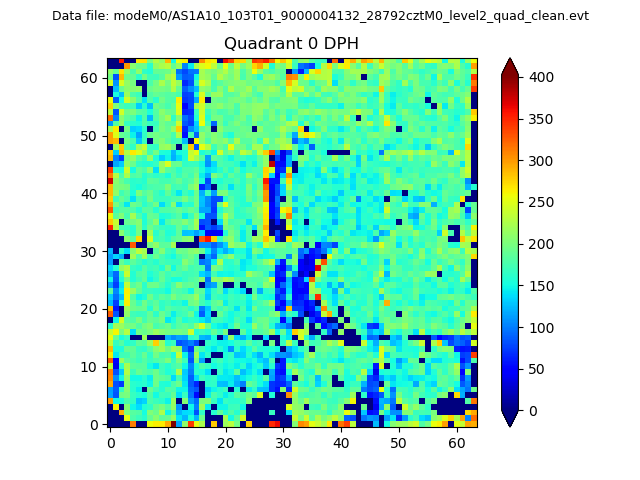 |
 |
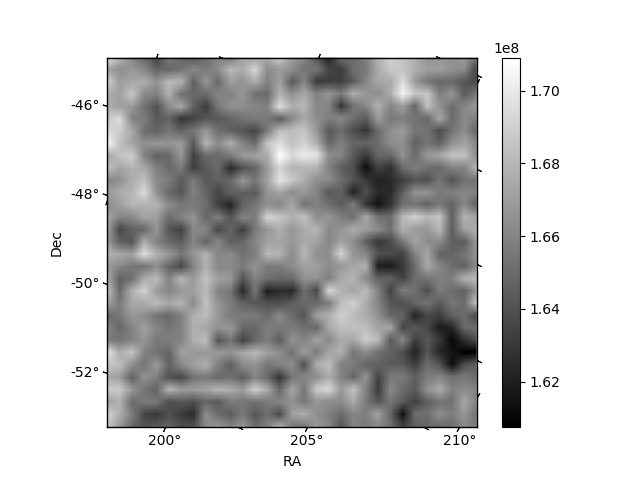
Quadrant B |
|---|---|---|---|
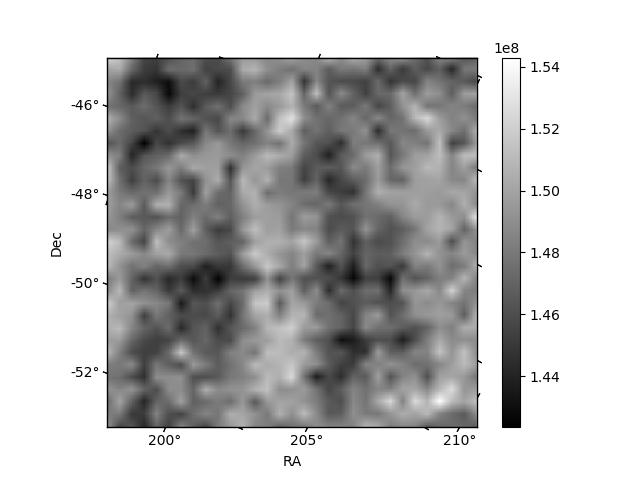
| Quadrant D |  |
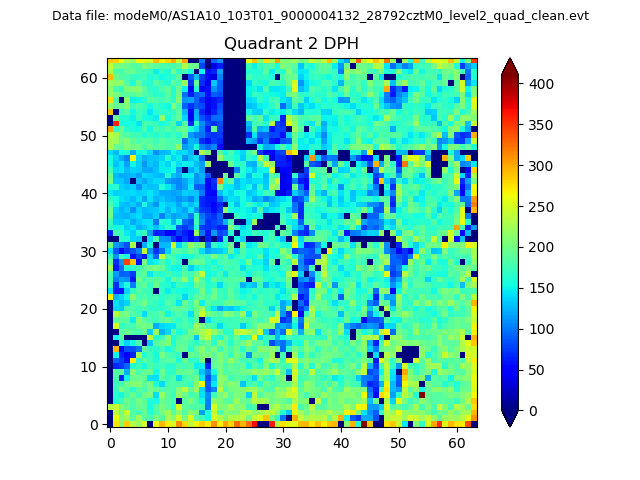 |
Quadrant C |
| Plot type | Count rate plots | Images |
|---|---|---|
| Comparison with Poisson distribution Blue bars denote a histogram of data divided into 1 sec bins. Red curve is a Poisson curve with rate = median count rate of data. |
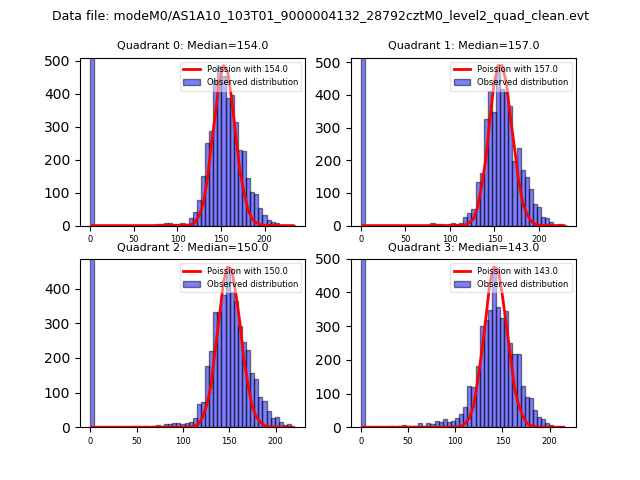 |
 |
| Quadrant-wise count rates Data is divided into 100 sec bins |
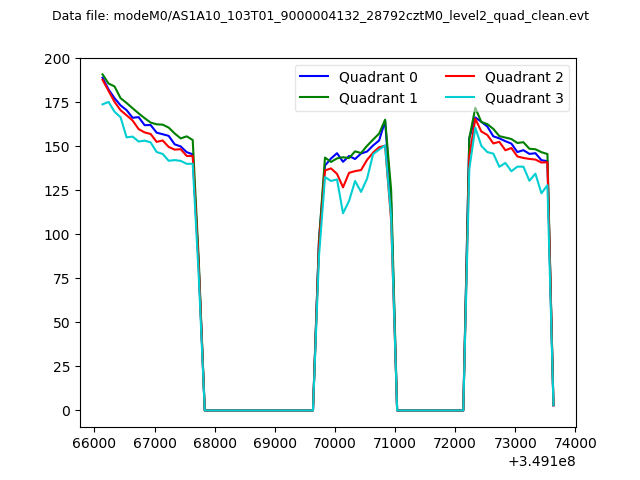 |
|
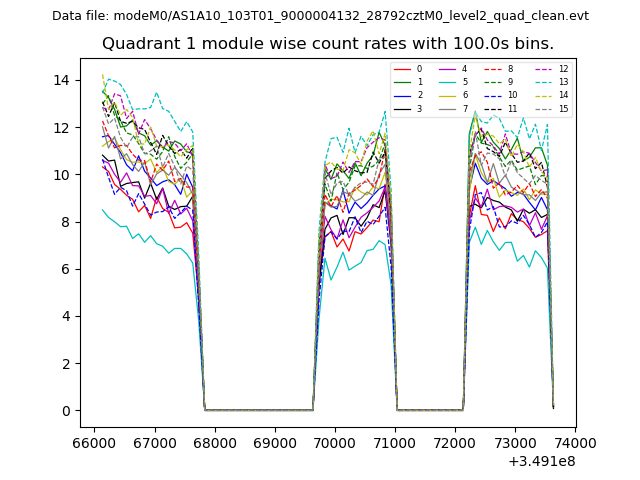
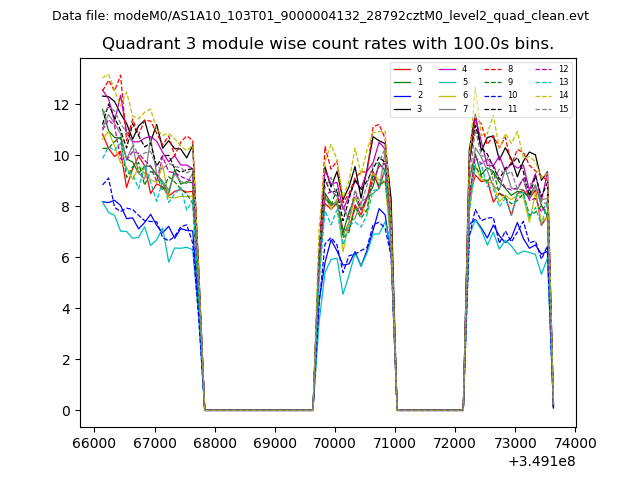
| Module-wise count rates for Quadrant A Data is divided into 100 sec bins |
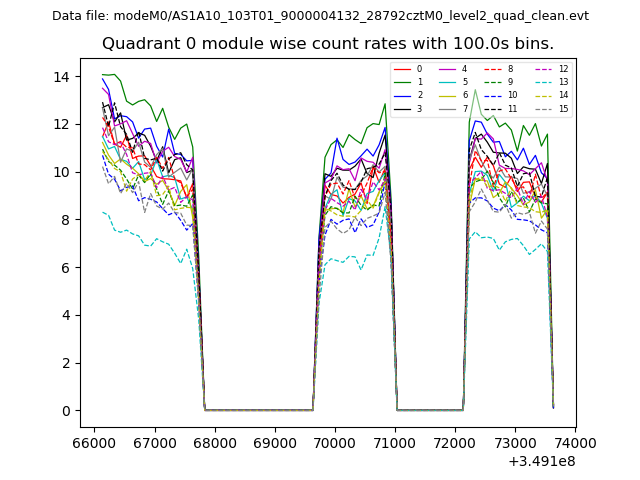 |
 |
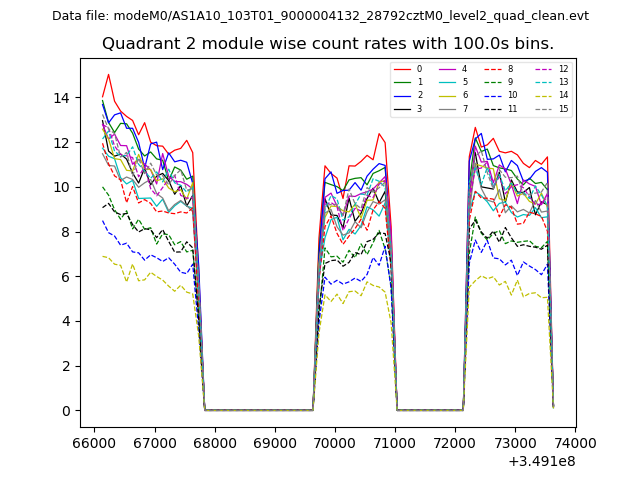
| Module-wise count rates for Quadrant B Data is divided into 100 sec bins |
 |
 |
| Module-wise count rates for Quadrant C Data is divided into 100 sec bins |
 |
 |
| Module-wise count rates for Quadrant D Data is divided into 100 sec bins |
 |
 |
| Parameter | Plot |
|---|---|
| CZT HV Monitor | 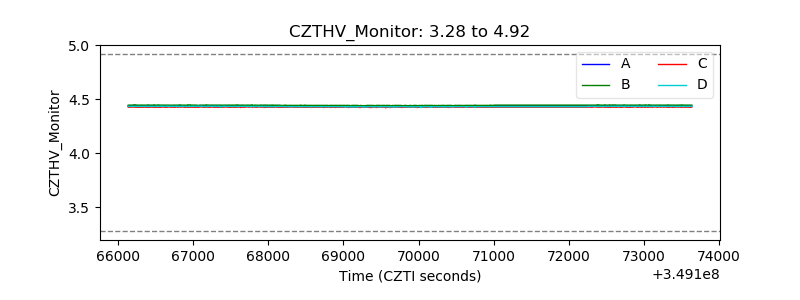 |
| D_VDD | 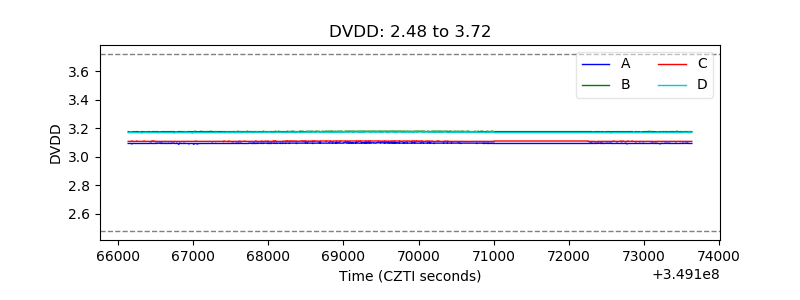 |
| Temperature 1 | 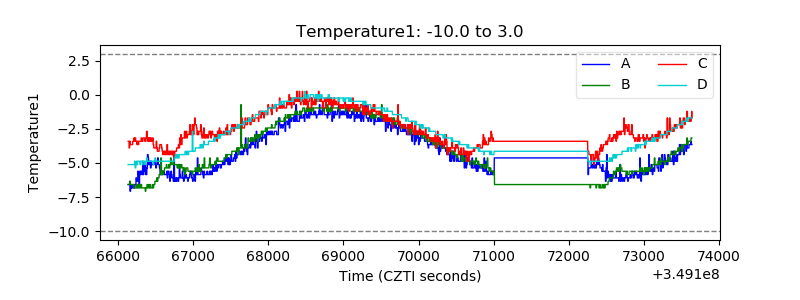 |
| Veto HV Monitor | 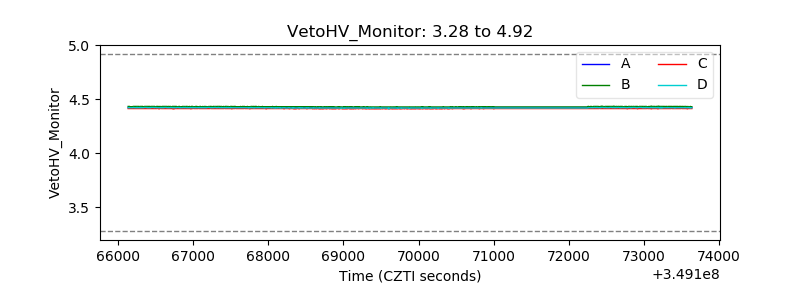 |
| Veto LLD | 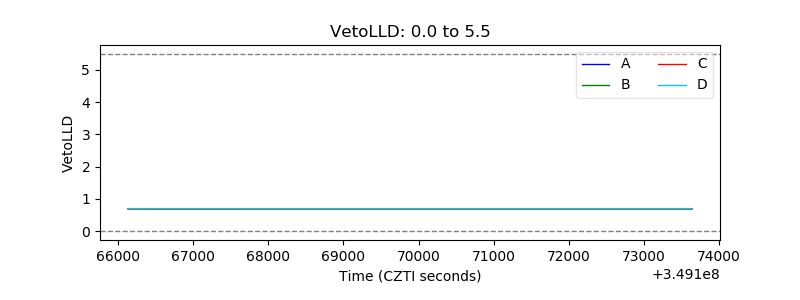 |
| Alpha Counter | 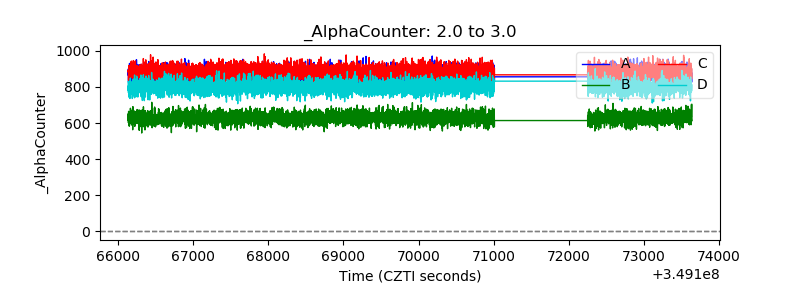 |
| _CPM_Rate | 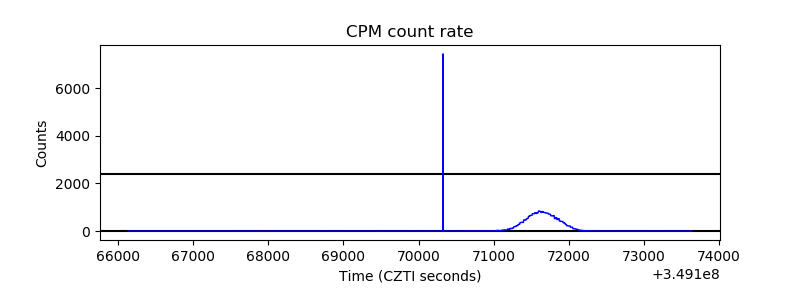 |
| CZT Counter | 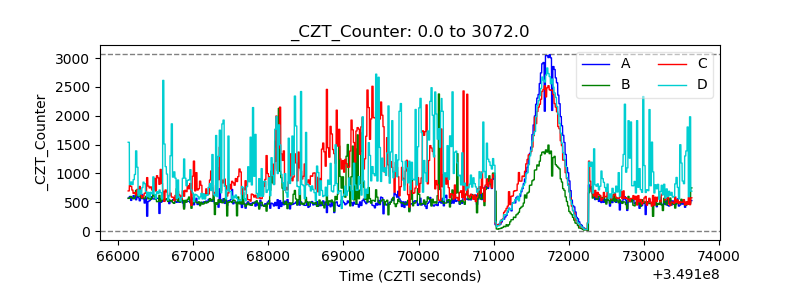 |
| +2.5 Volts monitor |  |
| +5 Volts monitor |  |
| _ROLL_ROT | 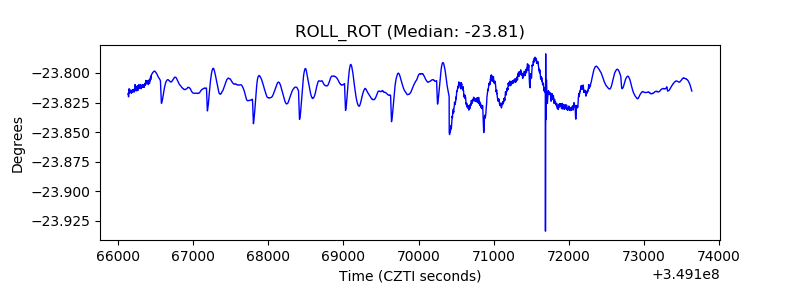 |
| _Roll_DEC | 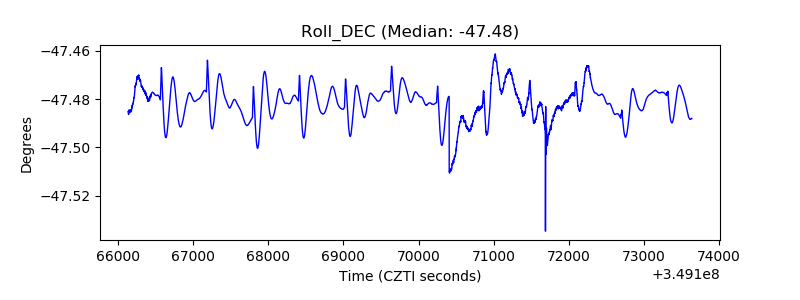 |
| _Roll_RA | 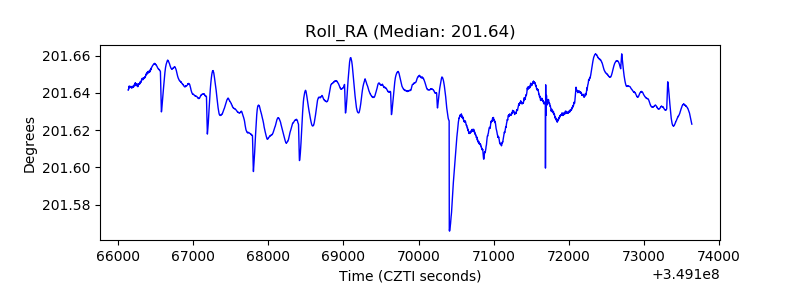 |
| Veto Counter | 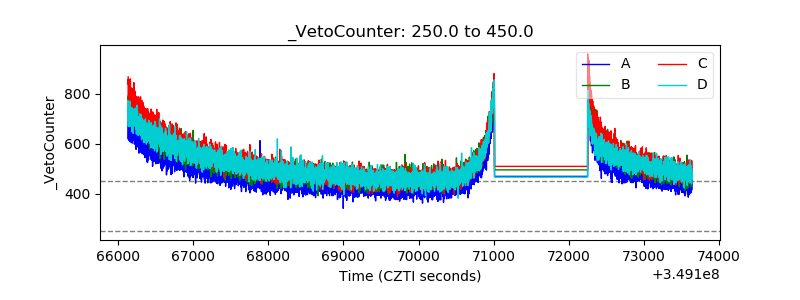 |