| Param | Original file | Final file |
|---|---|---|
| Filename | modeM0/AS1A10_103T01_9000004132_28794cztM0_level2.evt | modeM0/AS1A10_103T01_9000004132_28794cztM0_level2_quad_clean.evt |
| Size (bytes) | 656,072,640 | 83,462,400 |
| Size | 625.7 MB | 79.6 MB |
| Events in quadrant A | 4,143,710 | 509,700 |
| Events in quadrant B | 3,763,452 | 544,767 |
| Events in quadrant C | 4,550,819 | 502,388 |
| Events in quadrant D | 6,950,840 | 496,289 |
| Mode SS | |||
|---|---|---|---|
| Quadrant | BADHDUFLAG | Total packets | Discarded packets |
| A | 0 | 138 | 0 |
| B | 0 | 138 | 0 |
| C | 0 | 138 | 0 |
| D | 0 | 138 | 0 |
| Mode M0 | |||
|---|---|---|---|
| Quadrant | BADHDUFLAG | Total packets | Discarded packets |
| A | 0 | 16521 | 1 |
| B | 0 | 15382 | 1 |
| C | 0 | 17720 | 1 |
| D | 0 | 25376 | 1 |
| Mode M9 | |||
|---|---|---|---|
| Quadrant | BADHDUFLAG | Total packets | Discarded packets |
| A | 0 | 5 | 0 |
| B | 0 | 5 | 0 |
| C | 0 | 5 | 0 |
| D | 0 | 5 | 0 |
| Quadrant | Total seconds | Saturated seconds | Saturation percentage |
|---|---|---|---|
| A | 6801 | 449 | 6.601970% |
| B | 6802 | 315 | 4.630991% |
| C | 6802 | 791 | 11.628933% |
| D | 6802 | 1107 | 16.274625% |
Noise dominated data is calculated using 1-second bins in cleaned event files. If a bin has >2000 counts, and if more than 50% of those come from <1% of pixels, then it is considered to be noise-dominated and hence unusable.
| Quadrant | # 1 sec bins | Bins with >0 counts | Bins with >2000 counts | High rate bins dominated by noise | Noise dominated (total time) | Noise dominated (detector-on time) | Marked lightcurve |
|---|---|---|---|---|---|---|---|
| A | 7256 | 6801 | 266 | 266 | 3.67% | 3.91% | 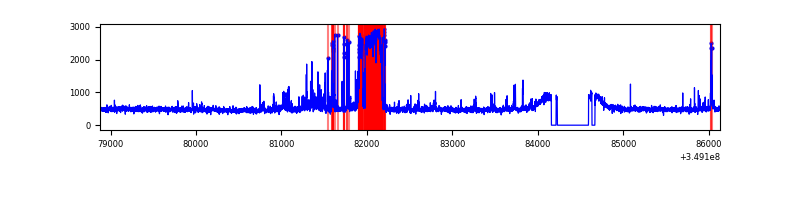 |
| B | 7257 | 6802 | 87 | 87 | 1.20% | 1.28% | 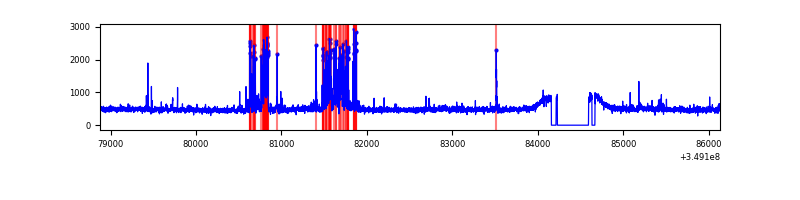 |
| C | 7256 | 6801 | 180 | 180 | 2.48% | 2.65% | 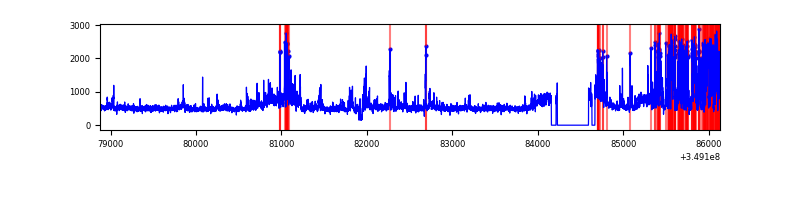 |
| D | 7257 | 6802 | 923 | 923 | 12.72% | 13.57% | 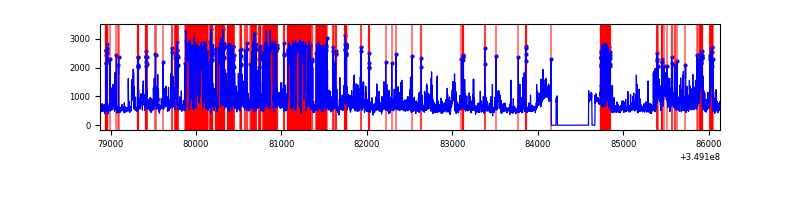 |
Top three noisy pixels from each quadrant. If the there are fewer than three noisy pixels in the level2.evt file, extra rows are filled as -1
| Pixel properties | Quadrant properties | ||||||
|---|---|---|---|---|---|---|---|
| Quadrant | DetID | PixID | Counts | Sigma | Mean | Median | Sigma |
| A | 15 | 174 | 619471 | 3707.18 | 823 | 802 | 166.9 |
| A | 14 | 235 | 321274 | 1920.33 | 823 | 802 | 166.9 |
| A | 14 | 239 | 15447 | 87.76 | 823 | 802 | 166.9 |
| B | 5 | 172 | 319119 | 1988.75 | 834 | 810 | 160.1 |
| B | 10 | 246 | 93828 | 581.16 | 834 | 810 | 160.1 |
| B | 0 | 189 | 24477 | 147.87 | 834 | 810 | 160.1 |
| C | 4 | 254 | 743318 | 4079.22 | 779 | 783 | 182.0 |
| C | 3 | 233 | 433165 | 2375.35 | 779 | 783 | 182.0 |
| C | 14 | 238 | 198491 | 1086.14 | 779 | 783 | 182.0 |
| D | 1 | 52 | 2497176 | 13634.24 | 764 | 742 | 183.1 |
| D | 8 | 195 | 965133 | 5267.01 | 764 | 742 | 183.1 |
| D | 13 | 104 | 325445 | 1773.36 | 764 | 742 | 183.1 |
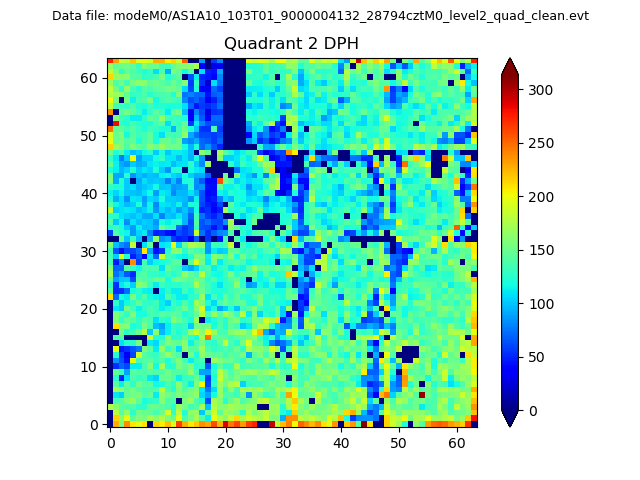
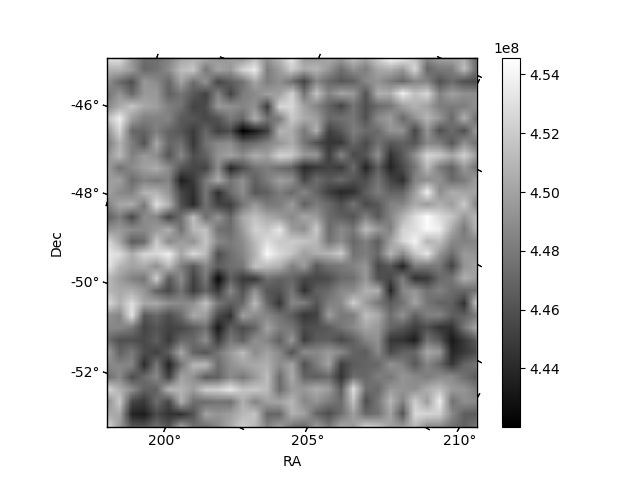
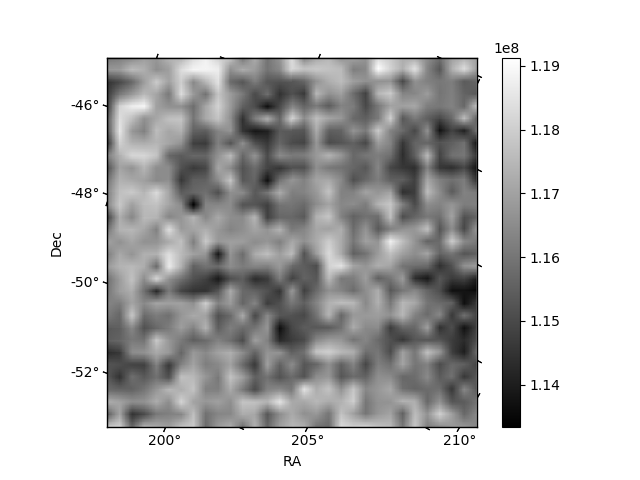
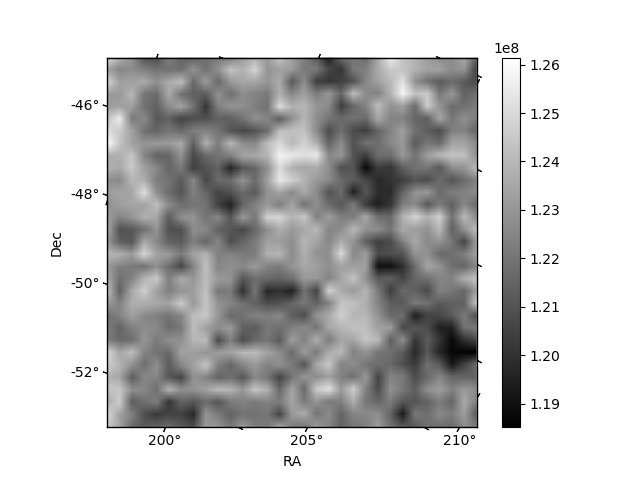
Histogram calculated using DETX and DETY for each event in the final _common_clean file
| Quadrant A | 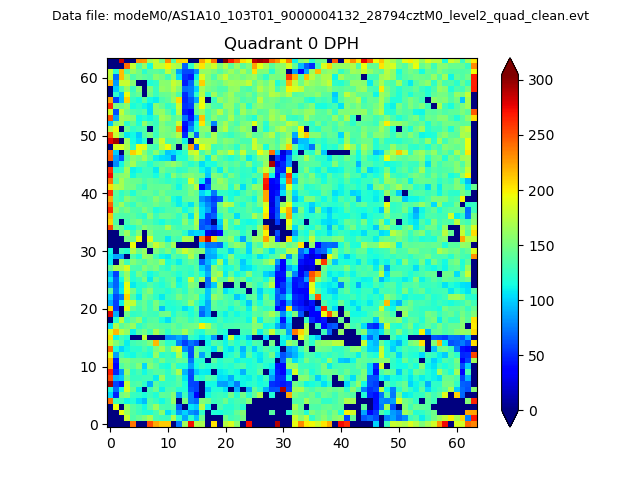 |
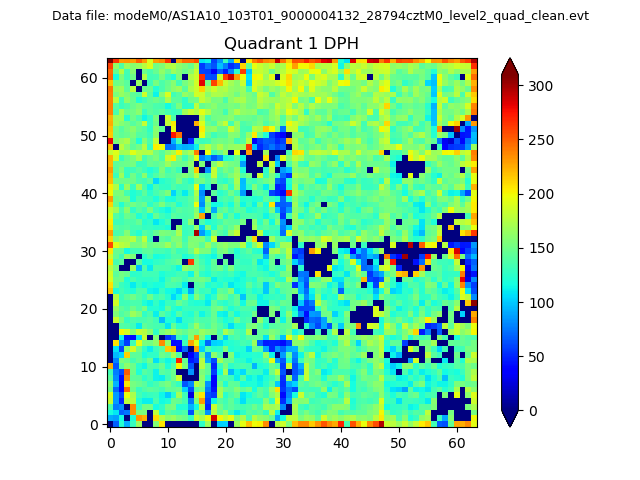 |
Quadrant B |
|---|---|---|---|
| Quadrant D | 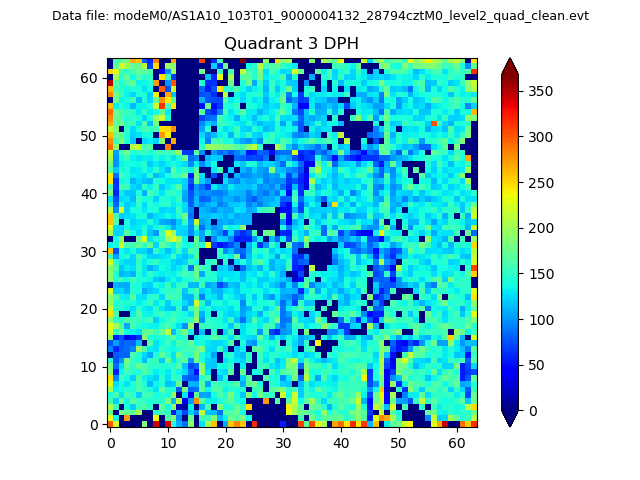 |
 |
Quadrant C |
| Plot type | Count rate plots | Images |
|---|---|---|
| Comparison with Poisson distribution Blue bars denote a histogram of data divided into 1 sec bins. Red curve is a Poisson curve with rate = median count rate of data. |
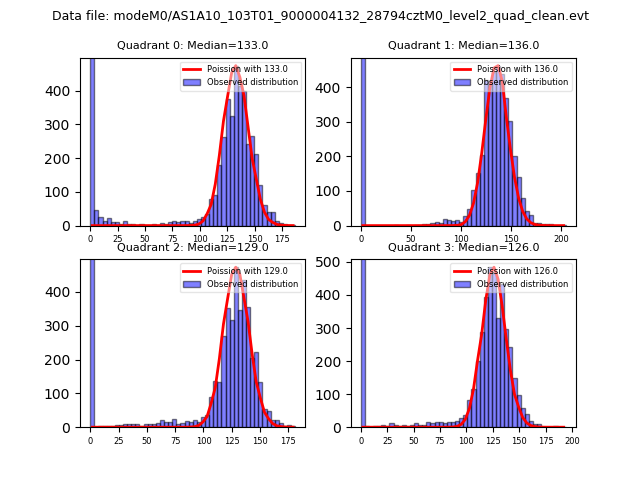 |
 |
| Quadrant-wise count rates Data is divided into 100 sec bins |
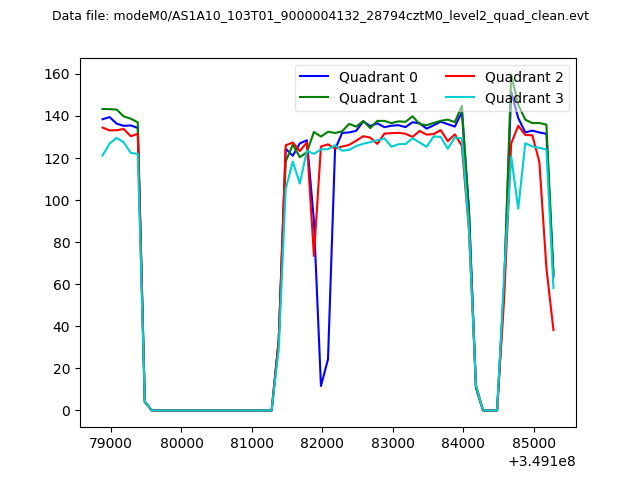 |
|
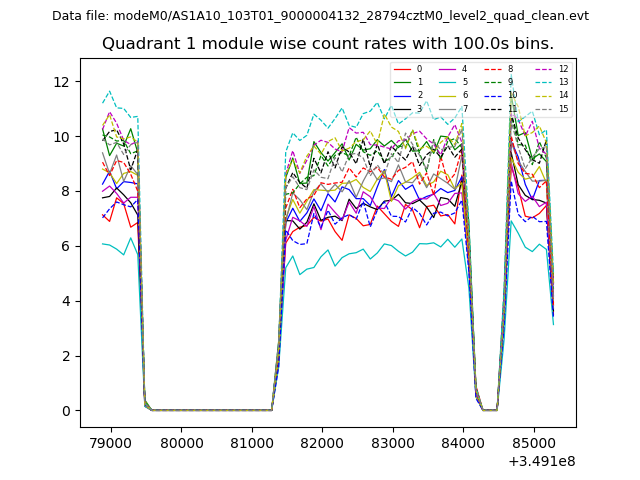
| Module-wise count rates for Quadrant A Data is divided into 100 sec bins |
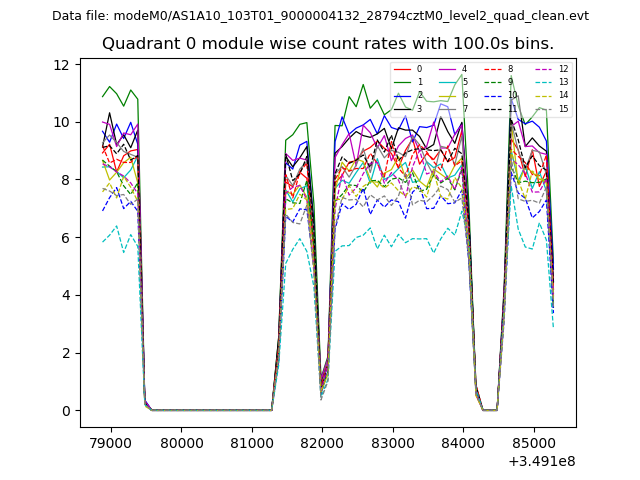 |
 |
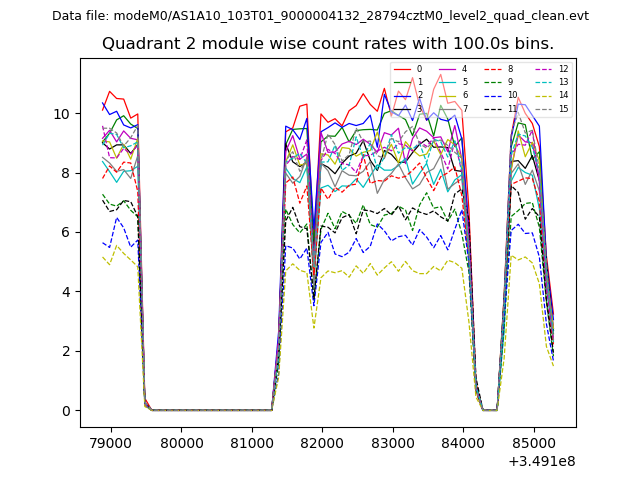
| Module-wise count rates for Quadrant B Data is divided into 100 sec bins |
 |
 |
| Module-wise count rates for Quadrant C Data is divided into 100 sec bins |
 |
 |
| Module-wise count rates for Quadrant D Data is divided into 100 sec bins |
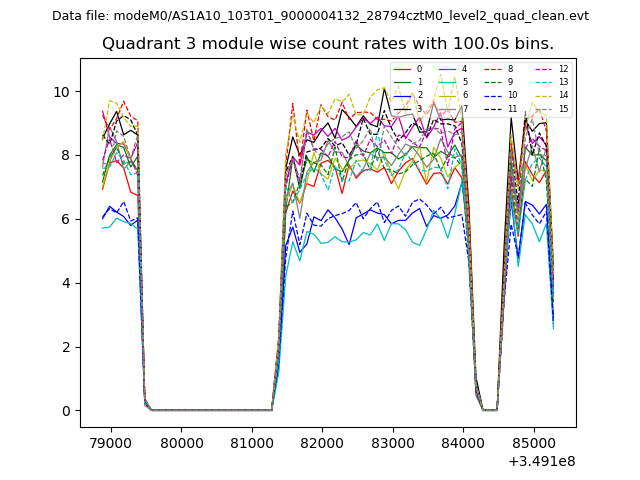 |
 |
| Parameter | Plot |
|---|---|
| CZT HV Monitor | 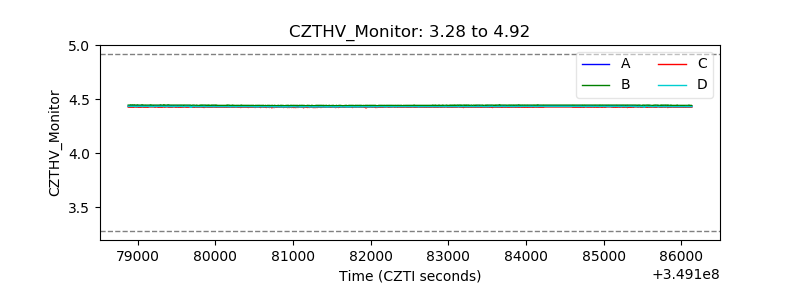 |
| D_VDD | 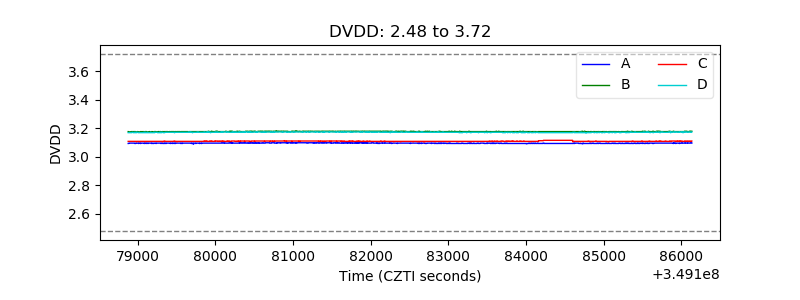 |
| Temperature 1 | 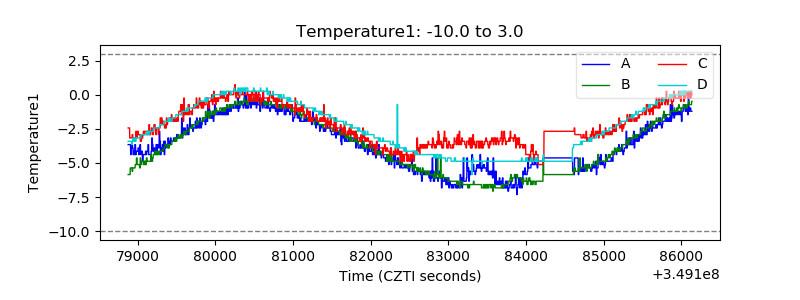 |
| Veto HV Monitor | 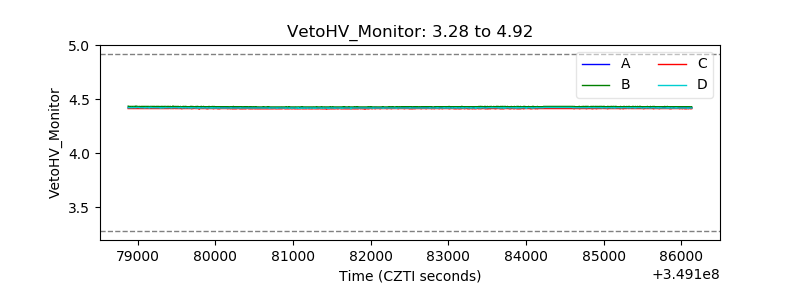 |
| Veto LLD | 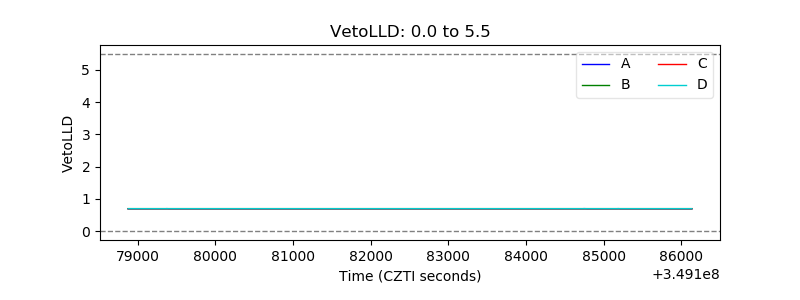 |
| Alpha Counter | 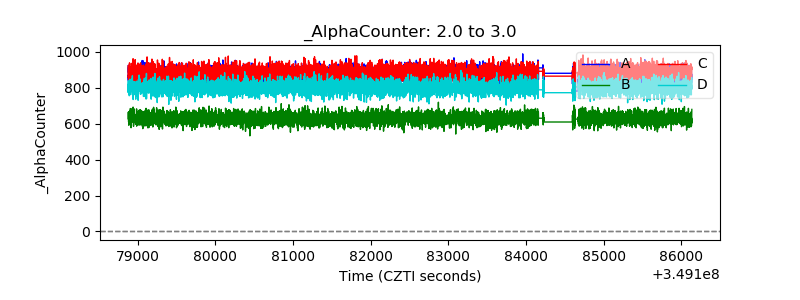 |
| _CPM_Rate | 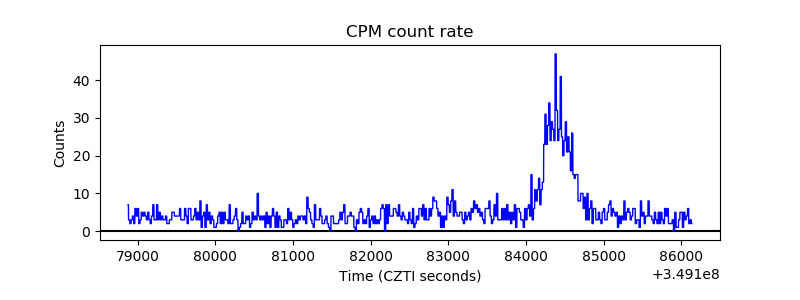 |
| CZT Counter | 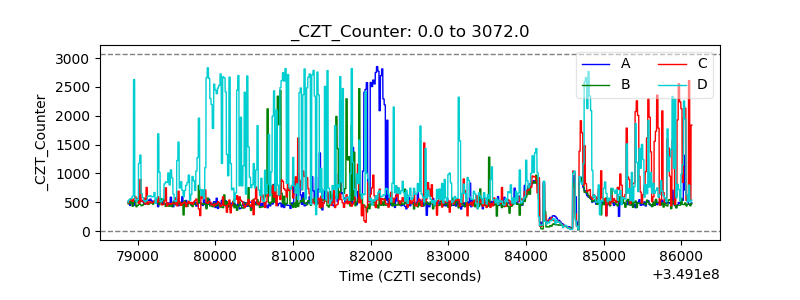 |
| +2.5 Volts monitor |  |
| +5 Volts monitor |  |
| _ROLL_ROT | 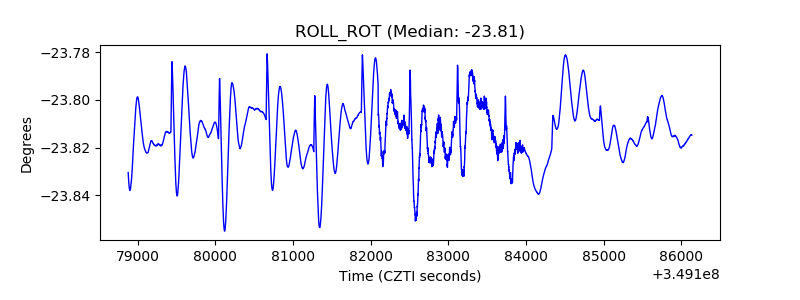 |
| _Roll_DEC | 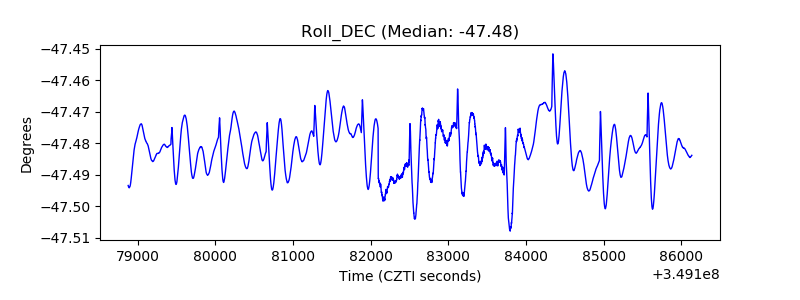 |
| _Roll_RA | 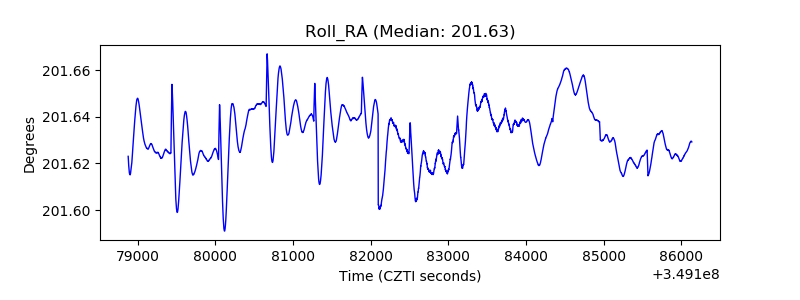 |
| Veto Counter | 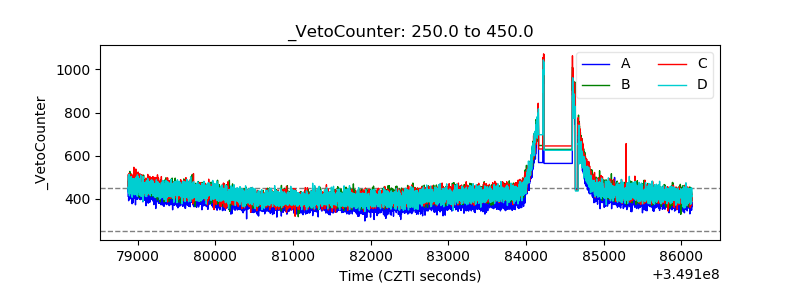 |