| Param | Original file | Final file |
|---|---|---|
| Filename | modeM0/AS1A10_103T01_9000004132_28795cztM0_level2.evt | modeM0/AS1A10_103T01_9000004132_28795cztM0_level2_quad_clean.evt |
| Size (bytes) | 793,189,440 | 85,645,440 |
| Size | 756.4 MB | 81.7 MB |
| Events in quadrant A | 4,032,390 | 547,772 |
| Events in quadrant B | 3,978,488 | 556,223 |
| Events in quadrant C | 7,533,404 | 439,045 |
| Events in quadrant D | 7,953,796 | 511,150 |
| Mode SS | |||
|---|---|---|---|
| Quadrant | BADHDUFLAG | Total packets | Discarded packets |
| A | 0 | 156 | 0 |
| B | 0 | 156 | 0 |
| C | 0 | 156 | 0 |
| D | 0 | 156 | 0 |
| Mode M0 | |||
|---|---|---|---|
| Quadrant | BADHDUFLAG | Total packets | Discarded packets |
| A | 0 | 16853 | 1 |
| B | 0 | 16641 | 1 |
| C | 0 | 27526 | 1 |
| D | 0 | 28904 | 1 |
| Mode M9 | |||
|---|---|---|---|
| Quadrant | BADHDUFLAG | Total packets | Discarded packets |
| A | 0 | 1 | 0 |
| B | 0 | 1 | 0 |
| C | 0 | 1 | 0 |
| D | 0 | 1 | 0 |
| Quadrant | Total seconds | Saturated seconds | Saturation percentage |
|---|---|---|---|
| A | 7741 | 263 | 3.397494% |
| B | 7741 | 297 | 3.836714% |
| C | 7741 | 2281 | 29.466477% |
| D | 7741 | 1225 | 15.824829% |
Noise dominated data is calculated using 1-second bins in cleaned event files. If a bin has >2000 counts, and if more than 50% of those come from <1% of pixels, then it is considered to be noise-dominated and hence unusable.
| Quadrant | # 1 sec bins | Bins with >0 counts | Bins with >2000 counts | High rate bins dominated by noise | Noise dominated (total time) | Noise dominated (detector-on time) | Marked lightcurve |
|---|---|---|---|---|---|---|---|
| A | 7821 | 7741 | 4 | 4 | 0.05% | 0.05% | 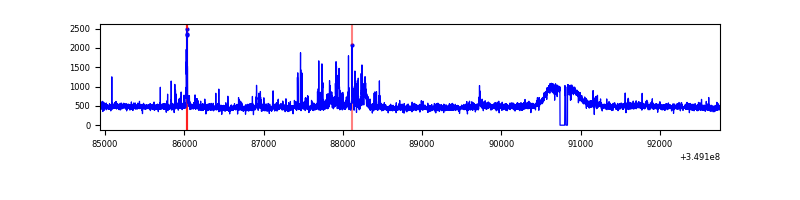 |
| B | 7821 | 7741 | 15 | 15 | 0.19% | 0.19% | 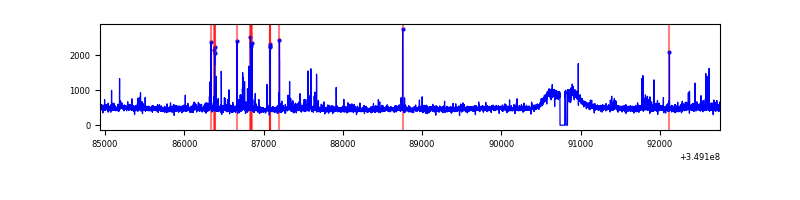 |
| C | 7821 | 7741 | 808 | 808 | 10.33% | 10.44% |  |
| D | 7821 | 7741 | 1069 | 1069 | 13.67% | 13.81% | 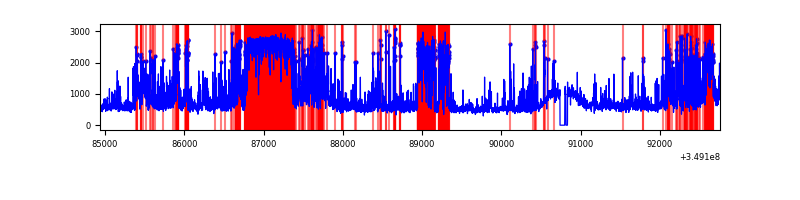 |
Top three noisy pixels from each quadrant. If the there are fewer than three noisy pixels in the level2.evt file, extra rows are filled as -1
| Pixel properties | Quadrant properties | ||||||
|---|---|---|---|---|---|---|---|
| Quadrant | DetID | PixID | Counts | Sigma | Mean | Median | Sigma |
| A | 14 | 235 | 211534 | 1081.24 | 965 | 943 | 194.8 |
| A | 4 | 2 | 33474 | 167.02 | 965 | 943 | 194.8 |
| A | 15 | 174 | 30401 | 151.25 | 965 | 943 | 194.8 |
| B | 5 | 172 | 72608 | 385.88 | 954 | 927 | 185.8 |
| B | 10 | 246 | 50695 | 267.91 | 954 | 927 | 185.8 |
| B | 0 | 229 | 34384 | 180.11 | 954 | 927 | 185.8 |
| C | 4 | 254 | 3703686 | 19343.35 | 812 | 816 | 191.4 |
| C | 14 | 238 | 258421 | 1345.7 | 812 | 816 | 191.4 |
| C | 14 | 254 | 192580 | 1001.75 | 812 | 816 | 191.4 |
| D | 1 | 52 | 1558290 | 7329.93 | 896 | 873 | 212.5 |
| D | 12 | 233 | 1498318 | 7047.67 | 896 | 873 | 212.5 |
| D | 8 | 195 | 874182 | 4110.2 | 896 | 873 | 212.5 |
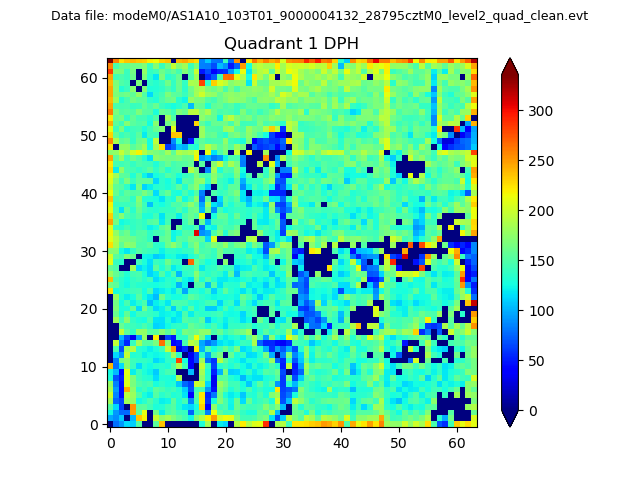
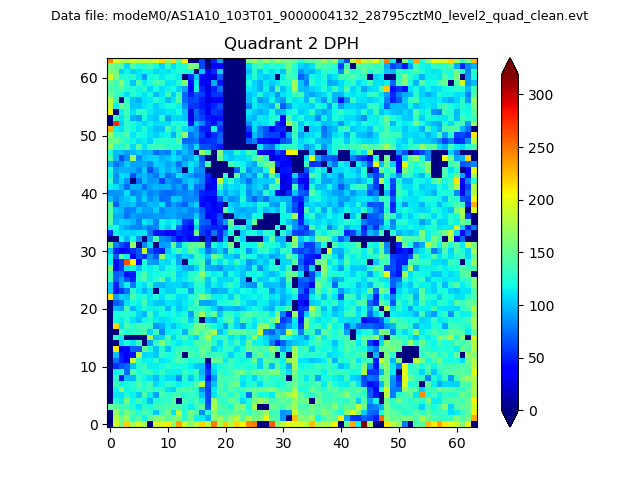
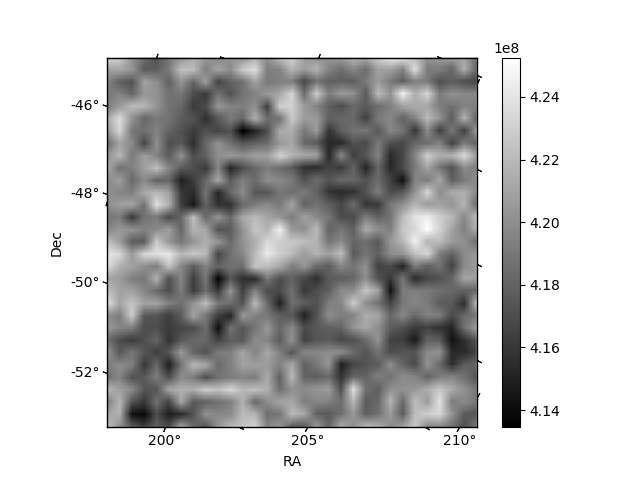
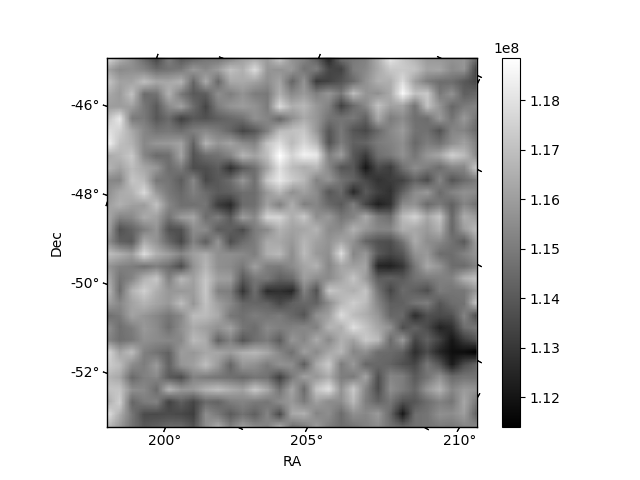
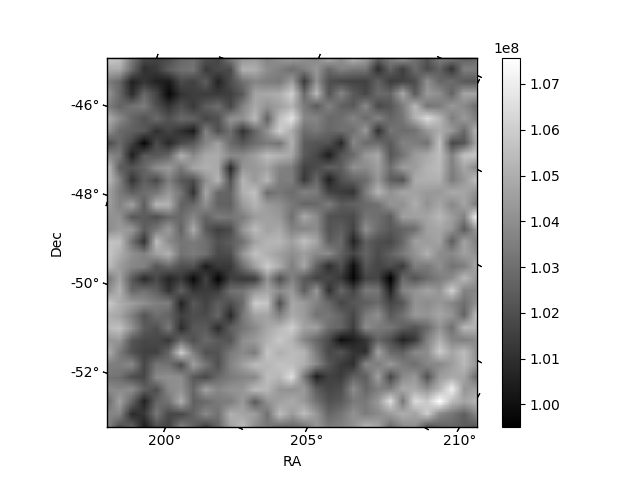
Histogram calculated using DETX and DETY for each event in the final _common_clean file
| Quadrant A | 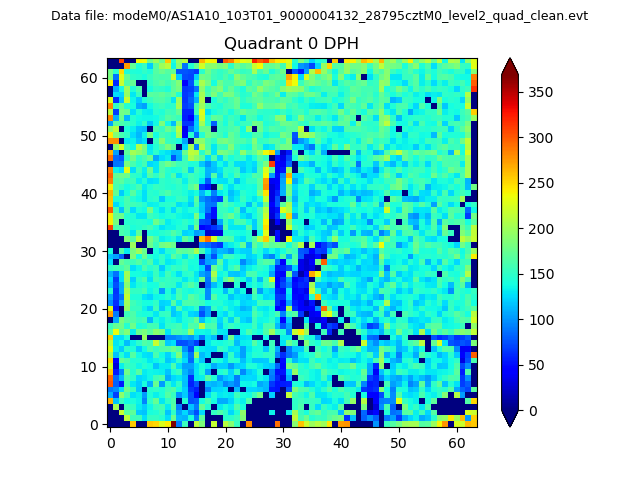 |
 |
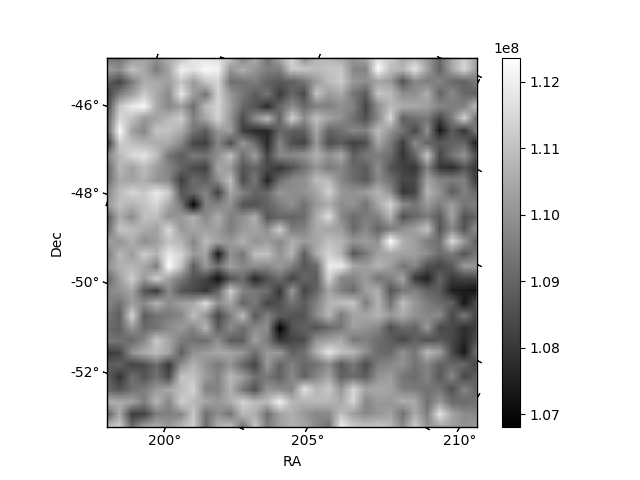
Quadrant B |
|---|---|---|---|
| Quadrant D | 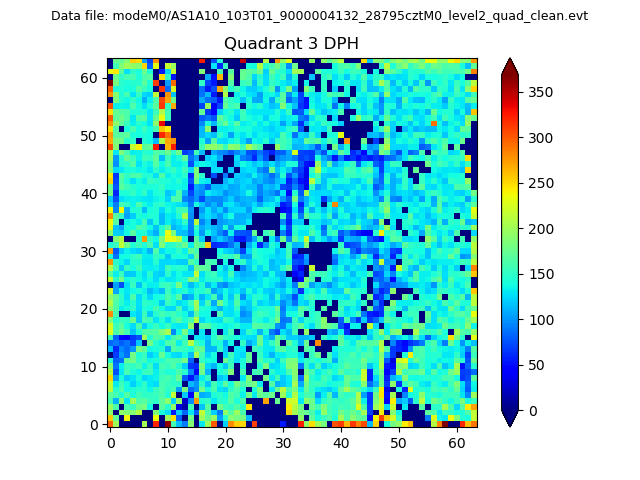 |
 |
Quadrant C |
| Plot type | Count rate plots | Images |
|---|---|---|
| Comparison with Poisson distribution Blue bars denote a histogram of data divided into 1 sec bins. Red curve is a Poisson curve with rate = median count rate of data. |
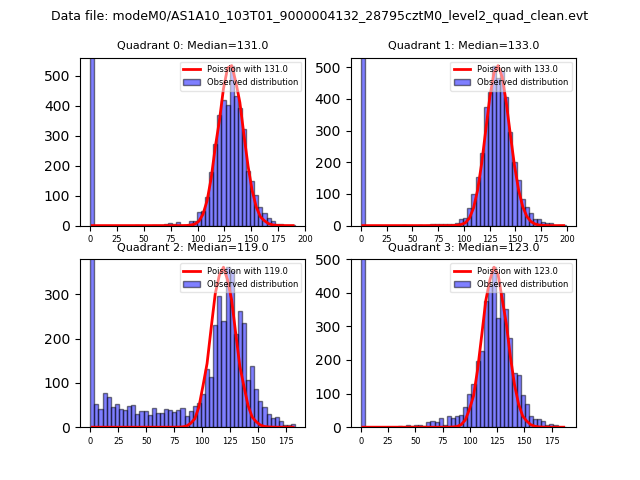 |
 |
| Quadrant-wise count rates Data is divided into 100 sec bins |
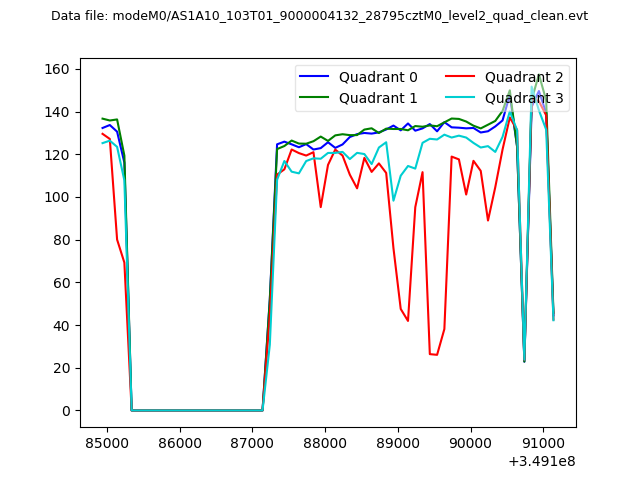 |
|
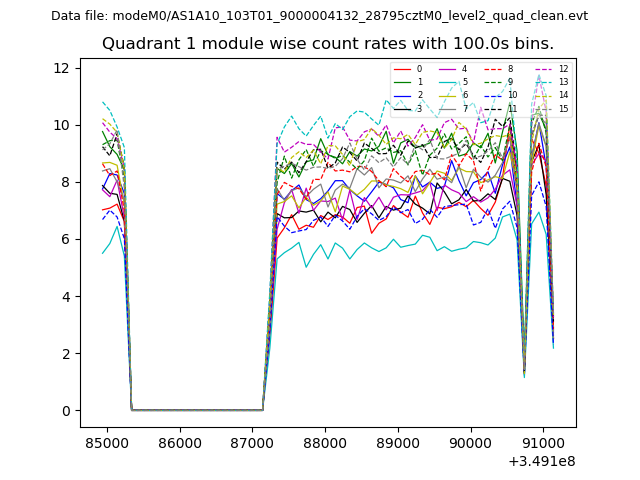
| Module-wise count rates for Quadrant A Data is divided into 100 sec bins |
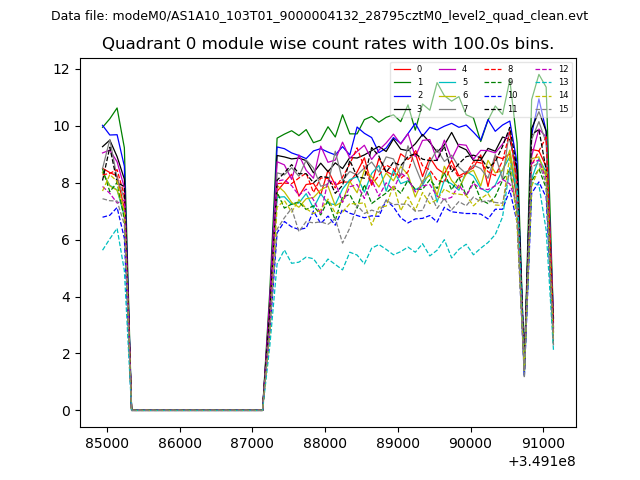 |
 |
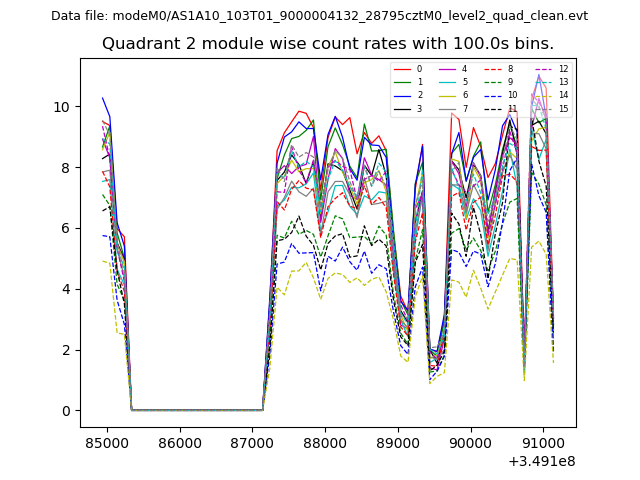
| Module-wise count rates for Quadrant B Data is divided into 100 sec bins |
 |
 |
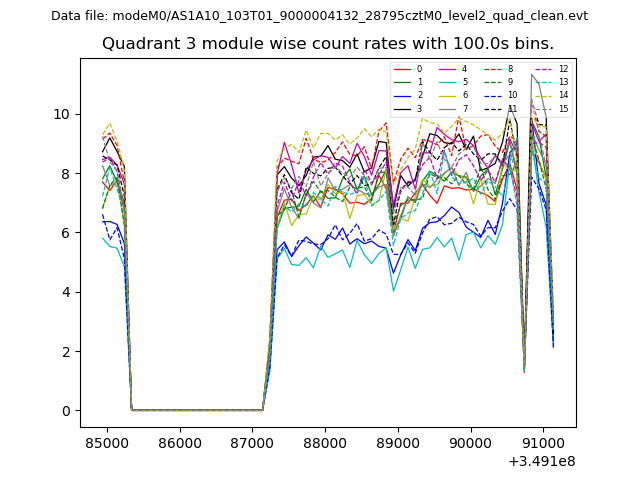
| Module-wise count rates for Quadrant C Data is divided into 100 sec bins |
 |
 |
| Module-wise count rates for Quadrant D Data is divided into 100 sec bins |
 |
 |
| Parameter | Plot |
|---|---|
| CZT HV Monitor | 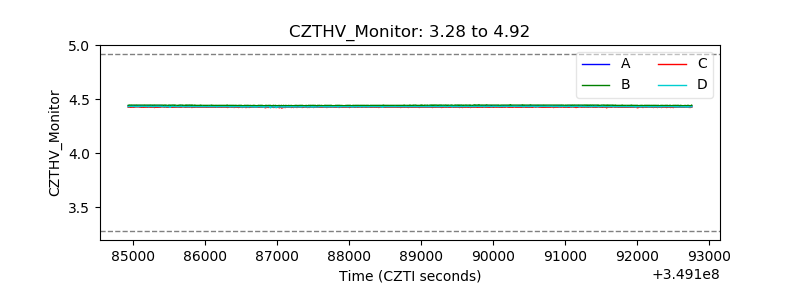 |
| D_VDD |  |
| Temperature 1 | 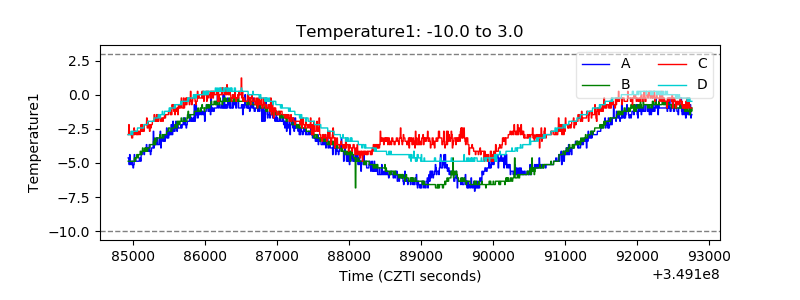 |
| Veto HV Monitor | 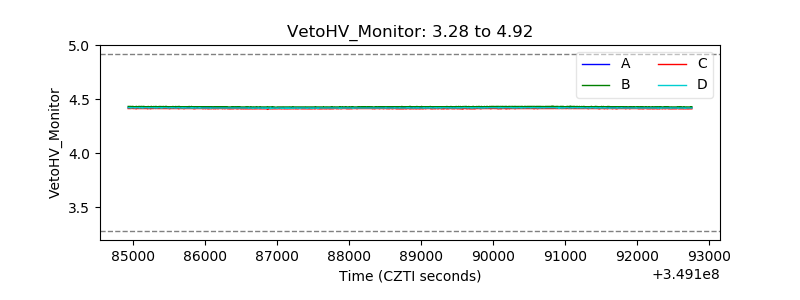 |
| Veto LLD | 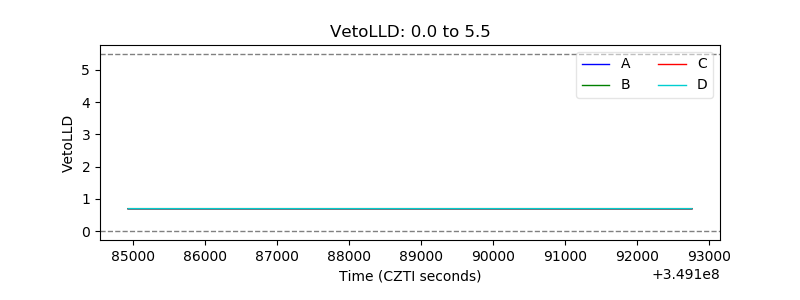 |
| Alpha Counter | 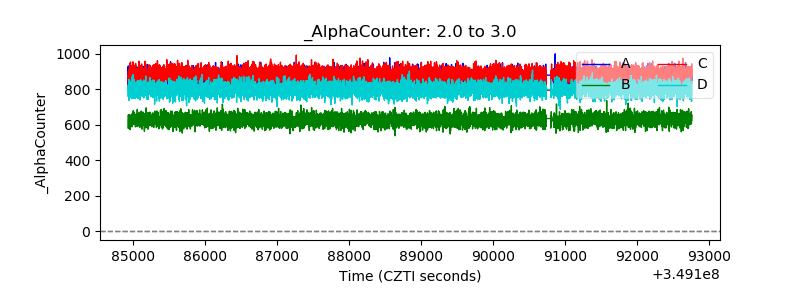 |
| _CPM_Rate | 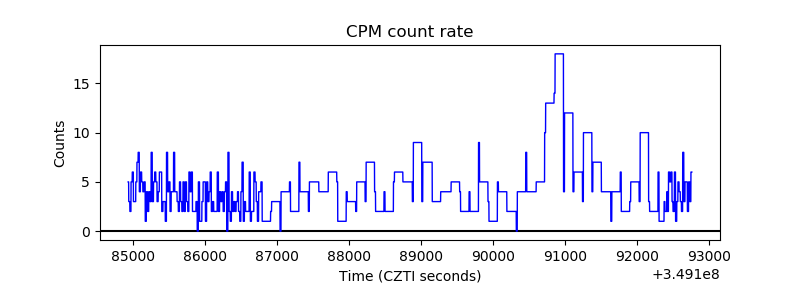 |
| CZT Counter | 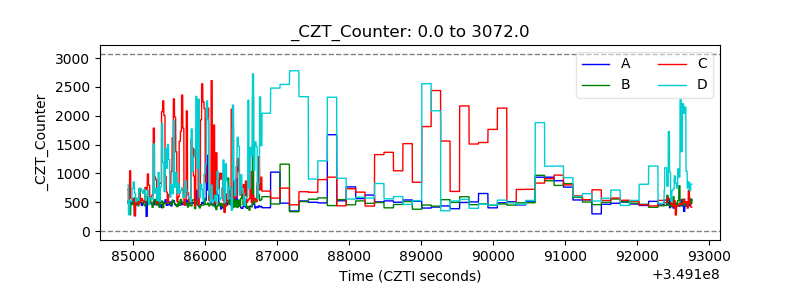 |
| +2.5 Volts monitor |  |
| +5 Volts monitor |  |
| _ROLL_ROT | 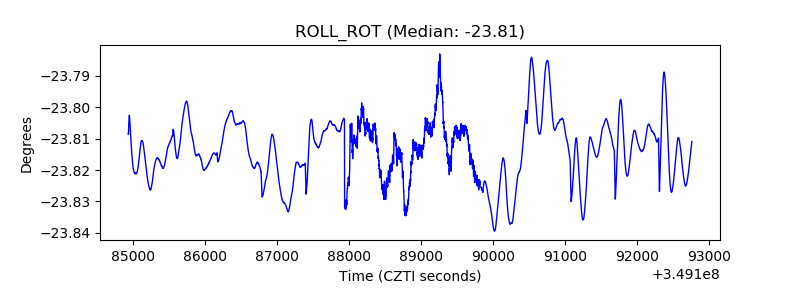 |
| _Roll_DEC | 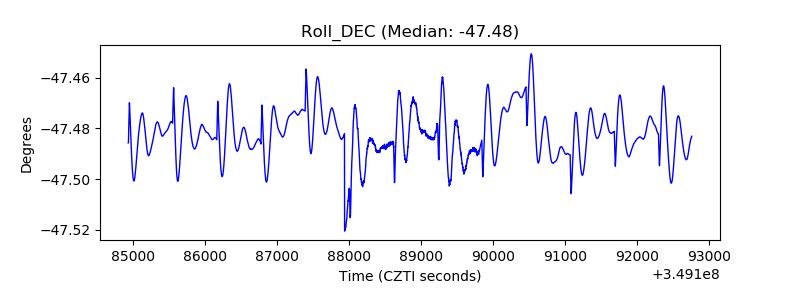 |
| _Roll_RA | 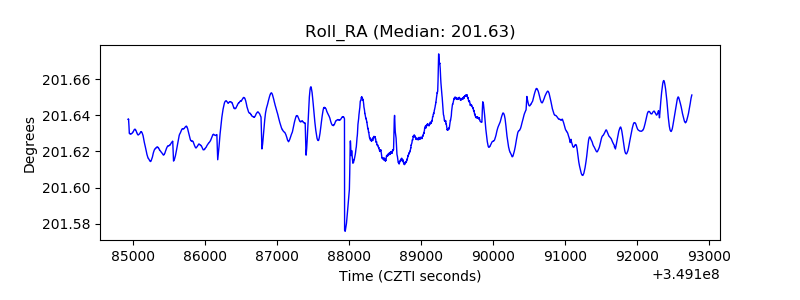 |
| Veto Counter | 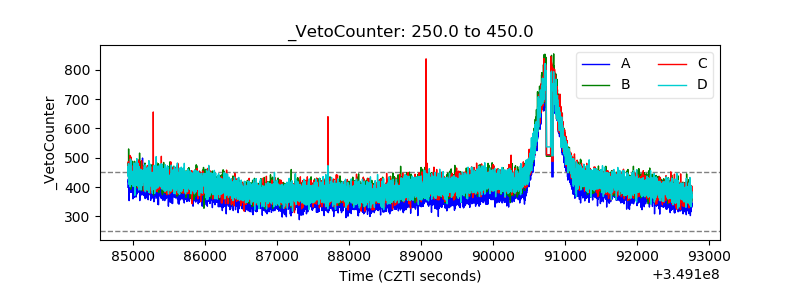 |