| Param | Original file | Final file |
|---|---|---|
| Filename | modeM0/AS1A10_103T01_9000004132_28796cztM0_level2.evt | modeM0/AS1A10_103T01_9000004132_28796cztM0_level2_quad_clean.evt |
| Size (bytes) | 667,471,680 | 88,133,760 |
| Size | 636.6 MB | 84.1 MB |
| Events in quadrant A | 4,189,600 | 539,255 |
| Events in quadrant B | 4,042,827 | 550,108 |
| Events in quadrant C | 4,713,106 | 519,233 |
| Events in quadrant D | 6,731,927 | 508,537 |
| Mode SS | |||
|---|---|---|---|
| Quadrant | BADHDUFLAG | Total packets | Discarded packets |
| A | 0 | 162 | 0 |
| B | 0 | 162 | 0 |
| C | 0 | 162 | 0 |
| D | 0 | 162 | 0 |
| Mode M0 | |||
|---|---|---|---|
| Quadrant | BADHDUFLAG | Total packets | Discarded packets |
| A | 0 | 17495 | 2 |
| B | 0 | 16980 | 2 |
| C | 0 | 19102 | 2 |
| D | 0 | 25496 | 2 |
| Mode M9 | |||
|---|---|---|---|
| Quadrant | BADHDUFLAG | Total packets | Discarded packets |
| A | 0 | 4 | 0 |
| B | 0 | 4 | 0 |
| C | 0 | 4 | 0 |
| D | 0 | 4 | 0 |
| Quadrant | Total seconds | Saturated seconds | Saturation percentage |
|---|---|---|---|
| A | 7933 | 234 | 2.949704% |
| B | 7933 | 259 | 3.264843% |
| C | 7933 | 496 | 6.252364% |
| D | 7932 | 479 | 6.038830% |
Noise dominated data is calculated using 1-second bins in cleaned event files. If a bin has >2000 counts, and if more than 50% of those come from <1% of pixels, then it is considered to be noise-dominated and hence unusable.
| Quadrant | # 1 sec bins | Bins with >0 counts | Bins with >2000 counts | High rate bins dominated by noise | Noise dominated (total time) | Noise dominated (detector-on time) | Marked lightcurve |
|---|---|---|---|---|---|---|---|
| A | 8293 | 7933 | 8 | 8 | 0.10% | 0.10% |  |
| B | 8293 | 7933 | 6 | 6 | 0.07% | 0.08% |  |
| C | 8292 | 7932 | 47 | 47 | 0.57% | 0.59% | 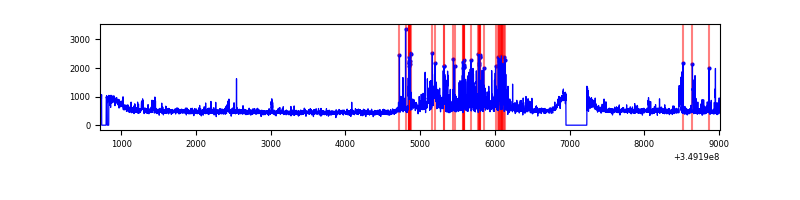 |
| D | 8292 | 7932 | 325 | 325 | 3.92% | 4.10% | 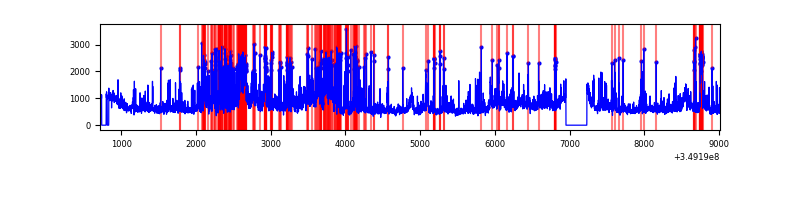 |
Top three noisy pixels from each quadrant. If the there are fewer than three noisy pixels in the level2.evt file, extra rows are filled as -1
| Pixel properties | Quadrant properties | ||||||
|---|---|---|---|---|---|---|---|
| Quadrant | DetID | PixID | Counts | Sigma | Mean | Median | Sigma |
| A | 14 | 235 | 274952 | 1371.46 | 987 | 964 | 199.8 |
| A | 15 | 174 | 62405 | 307.55 | 987 | 964 | 199.8 |
| A | 13 | 254 | 15041 | 70.46 | 987 | 964 | 199.8 |
| B | 5 | 255 | 70503 | 367.29 | 978 | 951 | 189.4 |
| B | 0 | 229 | 54382 | 282.16 | 978 | 951 | 189.4 |
| B | 12 | 111 | 23072 | 116.82 | 978 | 951 | 189.4 |
| C | 4 | 254 | 536043 | 2438.52 | 937 | 944 | 219.4 |
| C | 14 | 238 | 194220 | 880.79 | 937 | 944 | 219.4 |
| C | 3 | 233 | 188974 | 856.88 | 937 | 944 | 219.4 |
| D | 1 | 52 | 1342101 | 5866.33 | 952 | 924 | 228.6 |
| D | 8 | 195 | 852107 | 3723.09 | 952 | 924 | 228.6 |
| D | 13 | 104 | 652814 | 2851.38 | 952 | 924 | 228.6 |
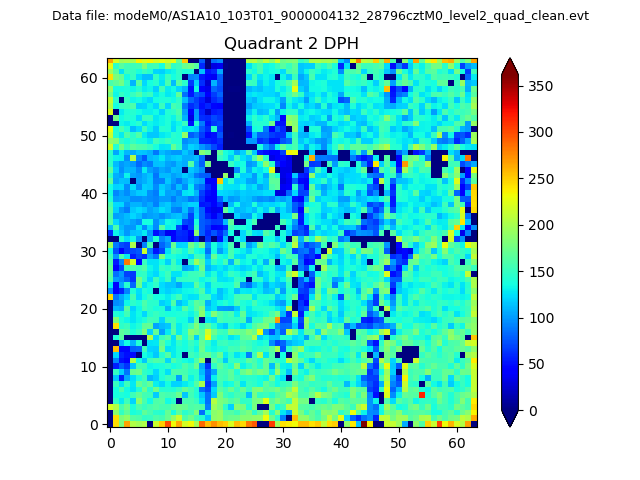
Histogram calculated using DETX and DETY for each event in the final _common_clean file
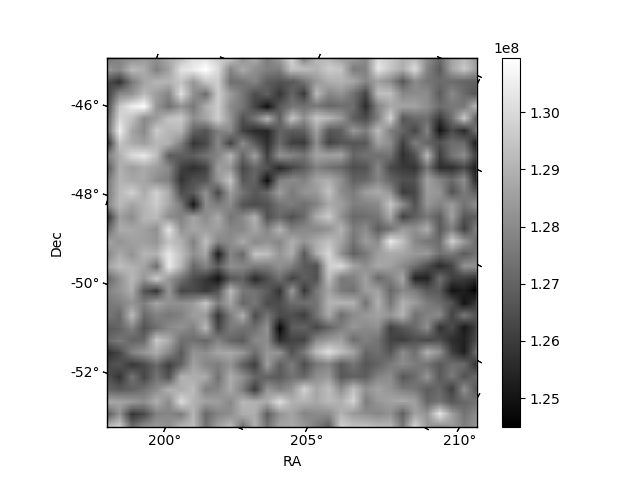
| Quadrant A | 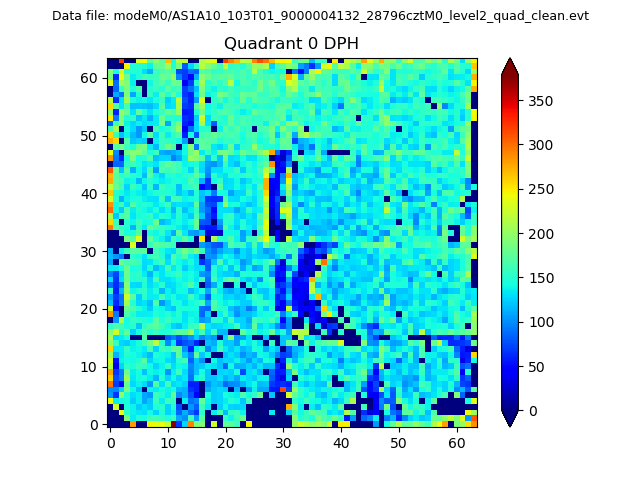 |
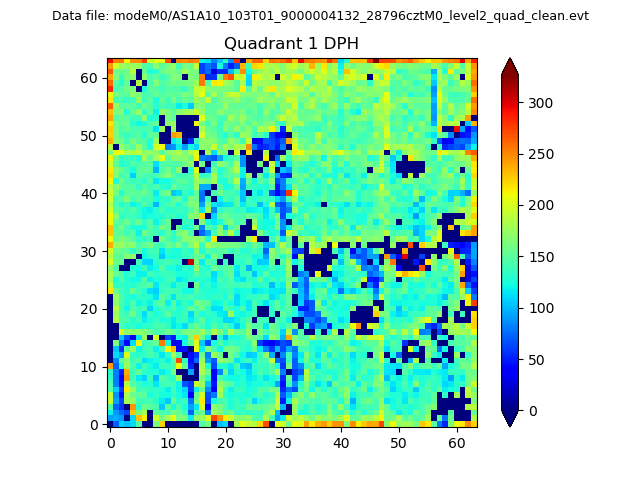 |
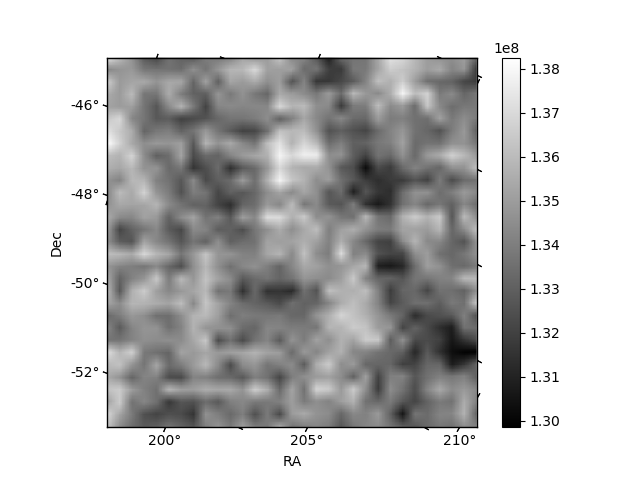
Quadrant B |
|---|---|---|---|
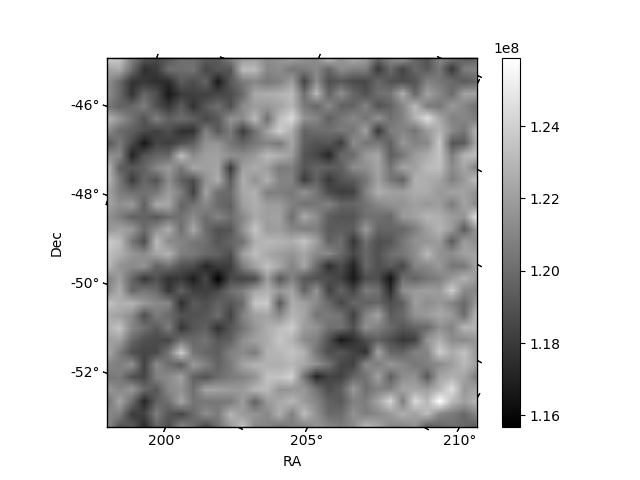
| Quadrant D | 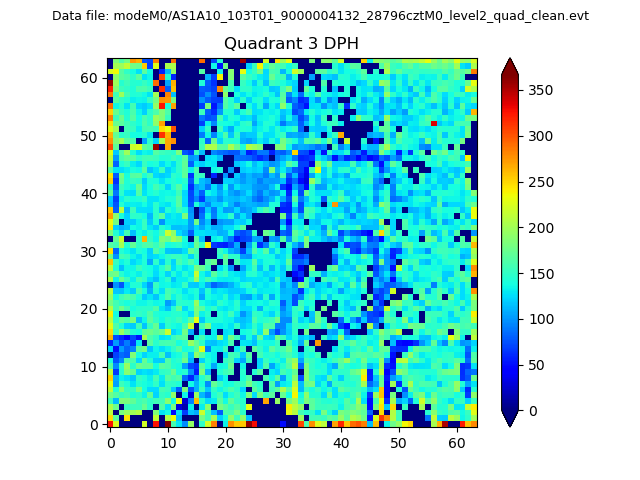 |
 |
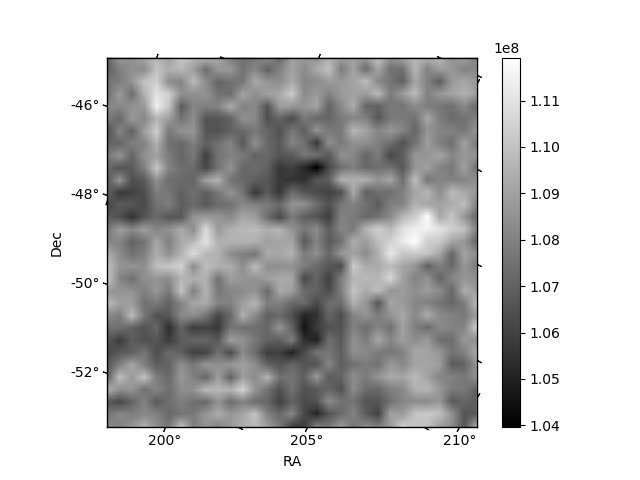
Quadrant C |
| Plot type | Count rate plots | Images |
|---|---|---|
| Comparison with Poisson distribution Blue bars denote a histogram of data divided into 1 sec bins. Red curve is a Poisson curve with rate = median count rate of data. |
 |
 |
| Quadrant-wise count rates Data is divided into 100 sec bins |
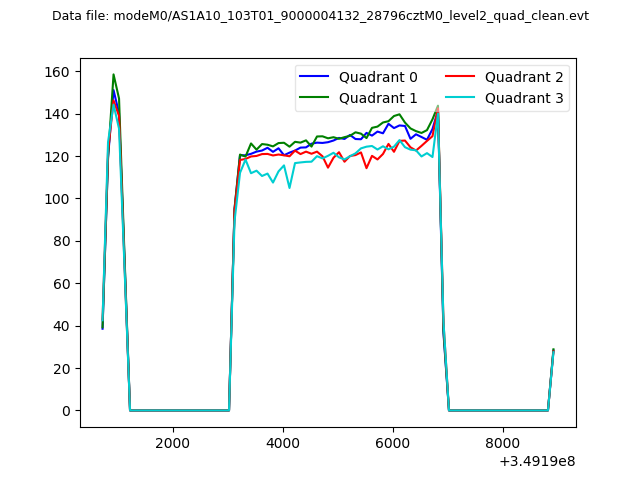 |
|
| Module-wise count rates for Quadrant A Data is divided into 100 sec bins |
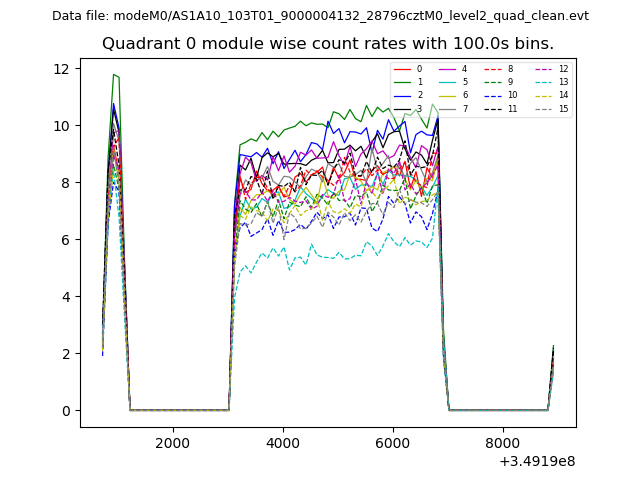 |
 |
| Module-wise count rates for Quadrant B Data is divided into 100 sec bins |
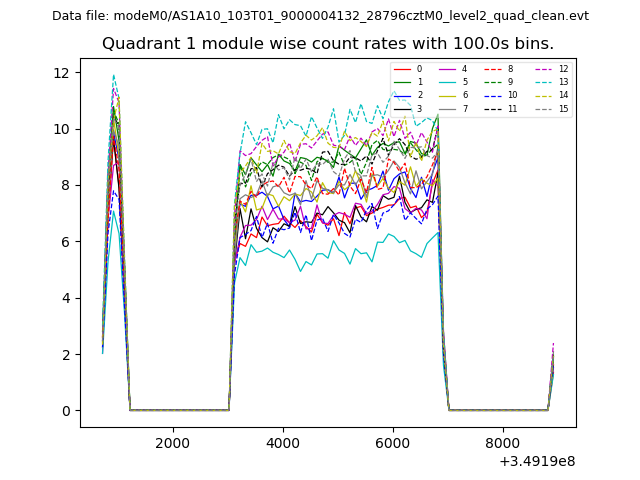 |
 |
| Module-wise count rates for Quadrant C Data is divided into 100 sec bins |
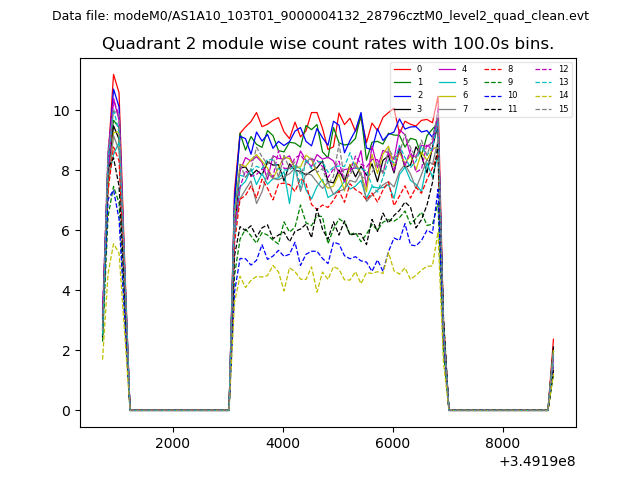 |
 |
| Module-wise count rates for Quadrant D Data is divided into 100 sec bins |
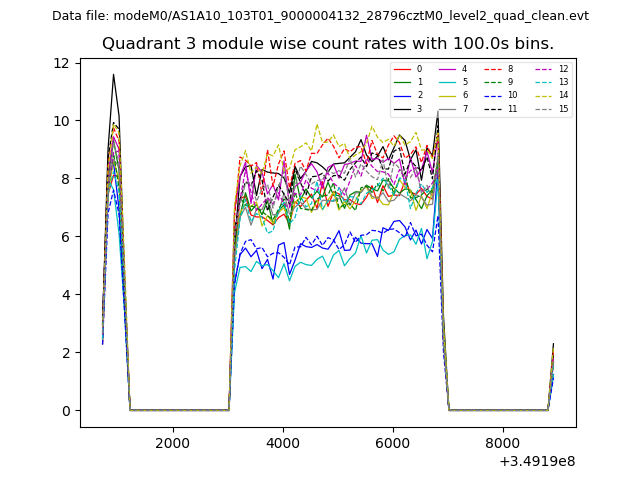 |
 |
| Parameter | Plot |
|---|---|
| CZT HV Monitor | 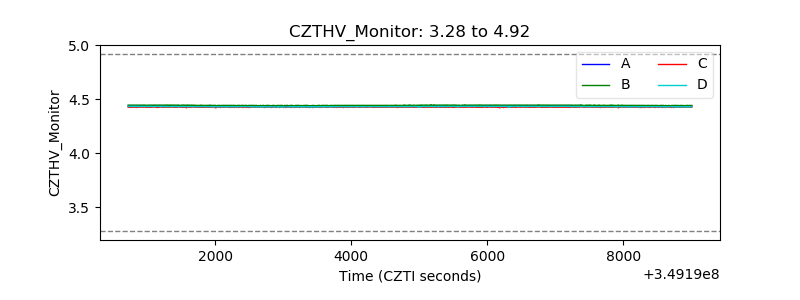 |
| D_VDD | 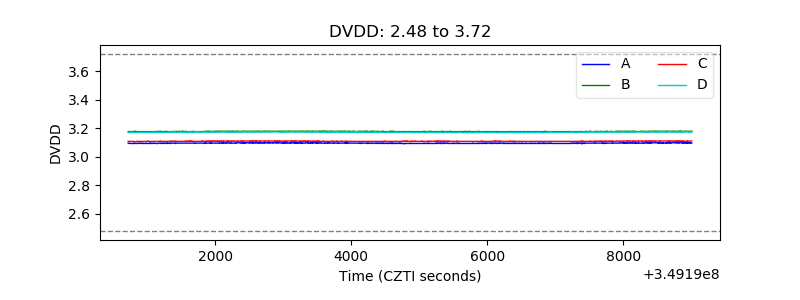 |
| Temperature 1 | 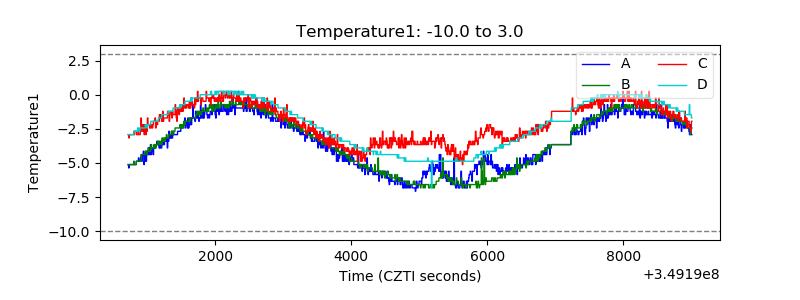 |
| Veto HV Monitor | 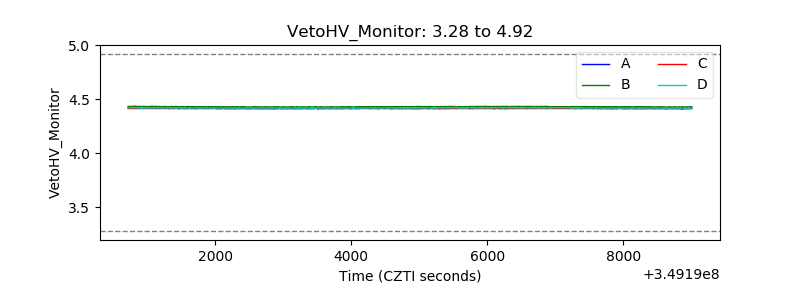 |
| Veto LLD | 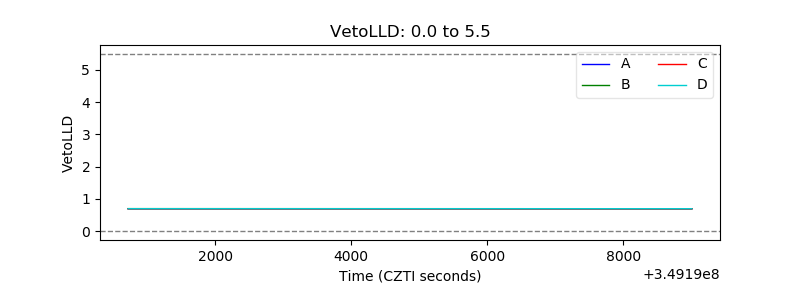 |
| Alpha Counter | 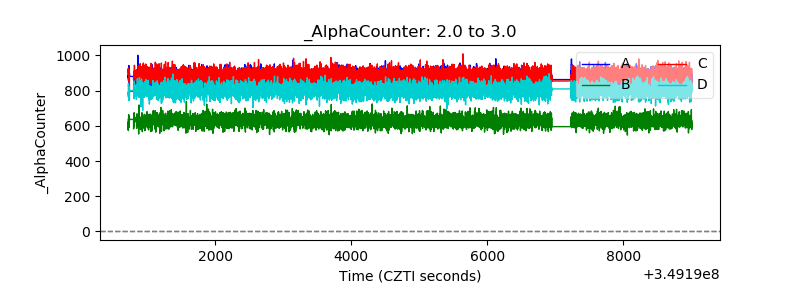 |
| _CPM_Rate | 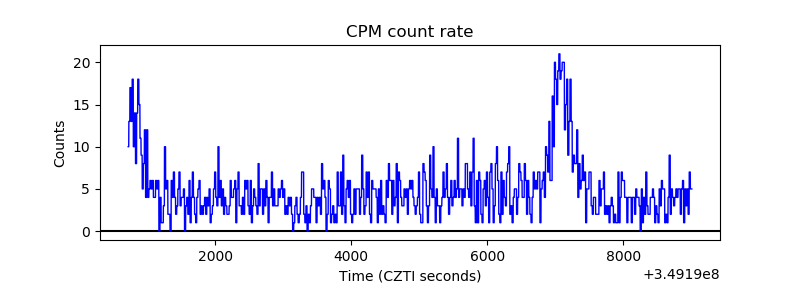 |
| CZT Counter | 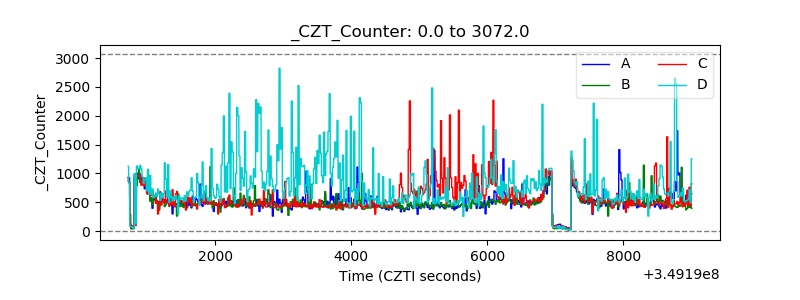 |
| +2.5 Volts monitor | 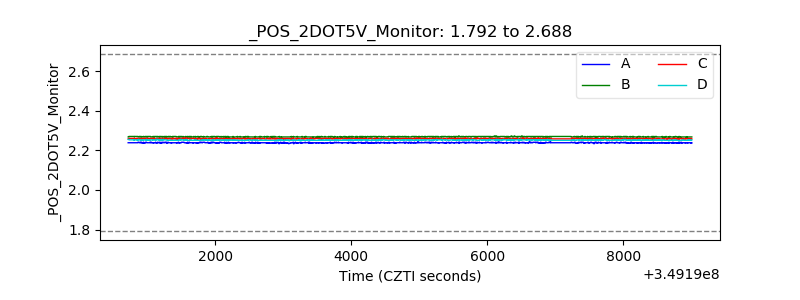 |
| +5 Volts monitor |  |
| _ROLL_ROT |  |
| _Roll_DEC | 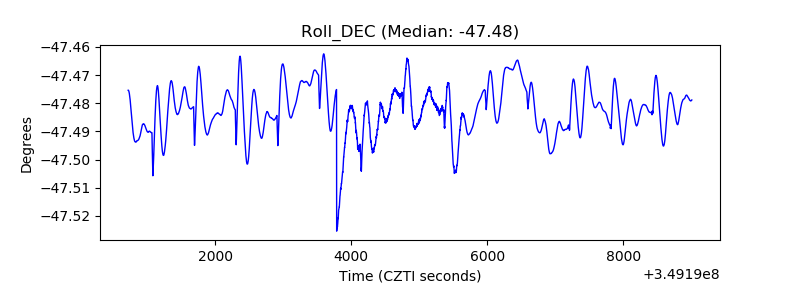 |
| _Roll_RA | 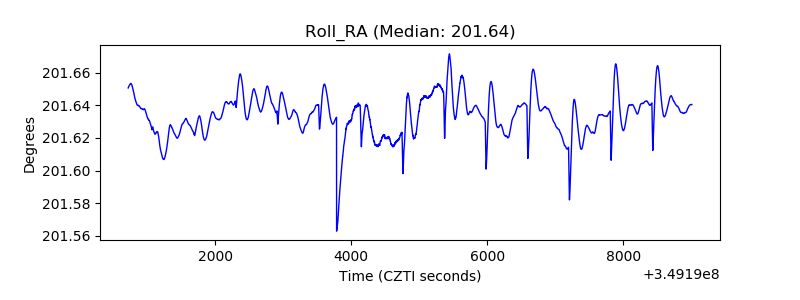 |
| Veto Counter | 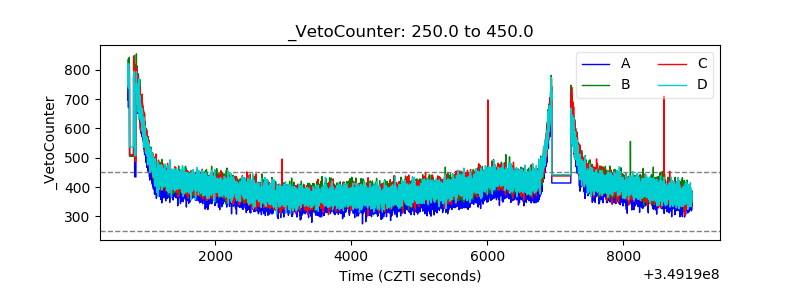 |