| Param | Original file | Final file |
|---|---|---|
| Filename | modeM0/AS1A10_103T01_9000004132_28799cztM0_level2.evt | modeM0/AS1A10_103T01_9000004132_28799cztM0_level2_quad_clean.evt |
| Size (bytes) | 1,268,383,680 | 219,473,280 |
| Size | 1.2 GB | 209.3 MB |
| Events in quadrant A | 8,053,919 | 1,413,591 |
| Events in quadrant B | 7,726,139 | 1,443,580 |
| Events in quadrant C | 8,594,456 | 1,366,244 |
| Events in quadrant D | 12,957,350 | 1,319,102 |
| Mode SS | |||
|---|---|---|---|
| Quadrant | BADHDUFLAG | Total packets | Discarded packets |
| A | 0 | 326 | 0 |
| B | 0 | 326 | 0 |
| C | 0 | 326 | 0 |
| D | 0 | 326 | 0 |
| Mode M0 | |||
|---|---|---|---|
| Quadrant | BADHDUFLAG | Total packets | Discarded packets |
| A | 0 | 34292 | 4 |
| B | 0 | 33404 | 3 |
| C | 0 | 35607 | 3 |
| D | 0 | 49504 | 3 |
| Mode M9 | |||
|---|---|---|---|
| Quadrant | BADHDUFLAG | Total packets | Discarded packets |
| A | 0 | 14 | 0 |
| B | 0 | 14 | 0 |
| C | 0 | 14 | 0 |
| D | 0 | 14 | 0 |
| Quadrant | Total seconds | Saturated seconds | Saturation percentage |
|---|---|---|---|
| A | 16013 | 191 | 1.192781% |
| B | 16014 | 232 | 1.448732% |
| C | 16014 | 663 | 4.140127% |
| D | 16014 | 995 | 6.213313% |
Noise dominated data is calculated using 1-second bins in cleaned event files. If a bin has >2000 counts, and if more than 50% of those come from <1% of pixels, then it is considered to be noise-dominated and hence unusable.
| Quadrant | # 1 sec bins | Bins with >0 counts | Bins with >2000 counts | High rate bins dominated by noise | Noise dominated (total time) | Noise dominated (detector-on time) | Marked lightcurve |
|---|---|---|---|---|---|---|---|
| A | 17378 | 16013 | 13 | 13 | 0.07% | 0.08% | 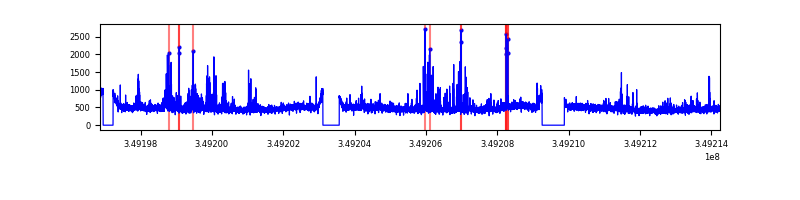 |
| B | 17379 | 16014 | 15 | 15 | 0.09% | 0.09% | 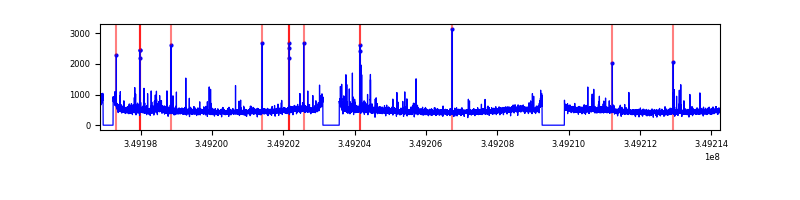 |
| C | 17379 | 16014 | 89 | 89 | 0.51% | 0.56% | 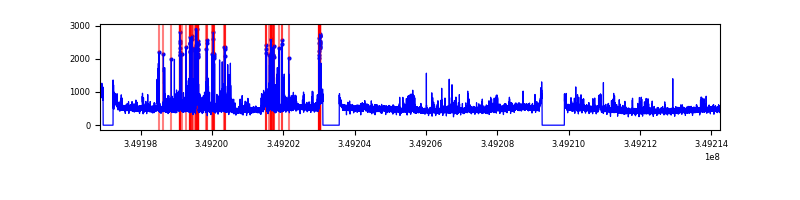 |
| D | 17379 | 16014 | 852 | 852 | 4.90% | 5.32% | 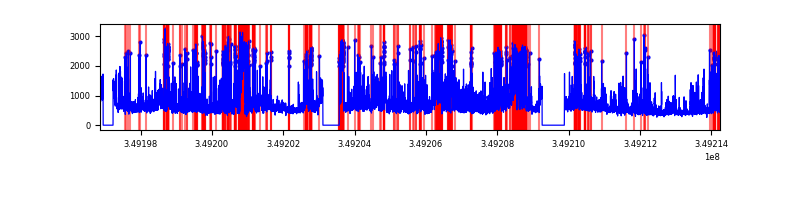 |
Top three noisy pixels from each quadrant. If the there are fewer than three noisy pixels in the level2.evt file, extra rows are filled as -1
| Pixel properties | Quadrant properties | ||||||
|---|---|---|---|---|---|---|---|
| Quadrant | DetID | PixID | Counts | Sigma | Mean | Median | Sigma |
| A | 14 | 235 | 525265 | 1367.66 | 1902 | 1858 | 382.7 |
| A | 15 | 174 | 85769 | 219.26 | 1902 | 1858 | 382.7 |
| A | 14 | 239 | 36710 | 91.07 | 1902 | 1858 | 382.7 |
| B | 5 | 255 | 103655 | 283.58 | 1896 | 1847 | 359.0 |
| B | 10 | 246 | 76692 | 208.48 | 1896 | 1847 | 359.0 |
| B | 0 | 229 | 59926 | 161.78 | 1896 | 1847 | 359.0 |
| C | 4 | 254 | 532603 | 1246.91 | 1817 | 1828 | 425.7 |
| C | 14 | 238 | 397640 | 929.85 | 1817 | 1828 | 425.7 |
| C | 15 | 208 | 223227 | 520.11 | 1817 | 1828 | 425.7 |
| D | 1 | 52 | 1903925 | 4410.35 | 1810 | 1762 | 431.3 |
| D | 12 | 79 | 1886066 | 4368.94 | 1810 | 1762 | 431.3 |
| D | 8 | 195 | 985646 | 2281.23 | 1810 | 1762 | 431.3 |
Histogram calculated using DETX and DETY for each event in the final _common_clean file
| Quadrant A | 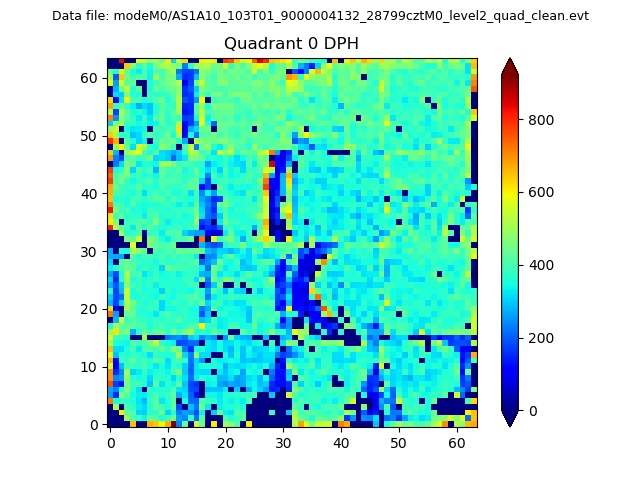 |
 |
Quadrant B |
|---|---|---|---|
| Quadrant D |  |
 |
Quadrant C |
| Plot type | Count rate plots | Images |
|---|---|---|
| Comparison with Poisson distribution Blue bars denote a histogram of data divided into 1 sec bins. Red curve is a Poisson curve with rate = median count rate of data. |
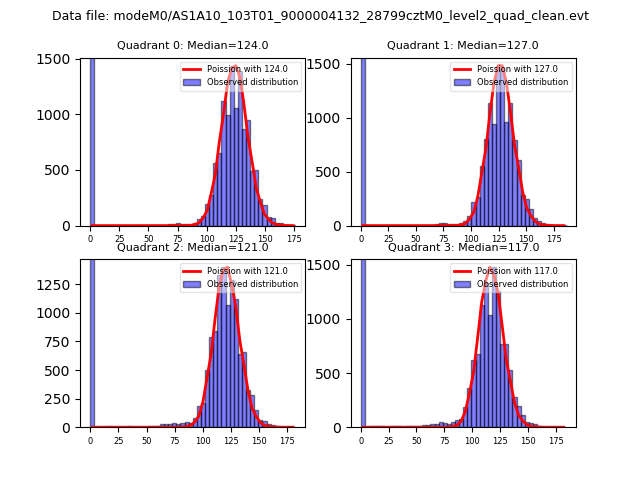 |
 |
| Quadrant-wise count rates Data is divided into 100 sec bins |
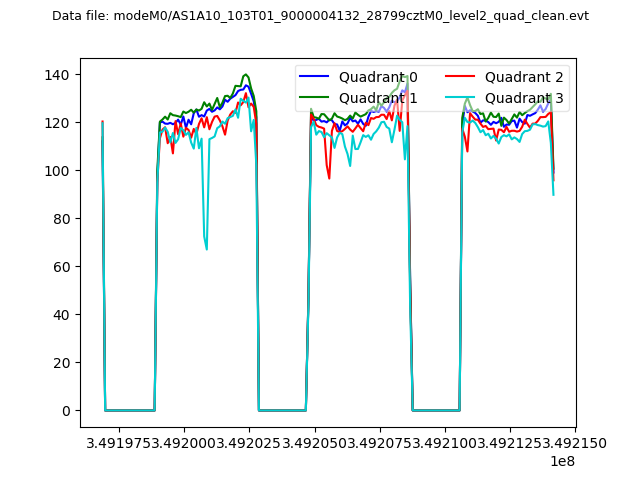 |
|
| Module-wise count rates for Quadrant A Data is divided into 100 sec bins |
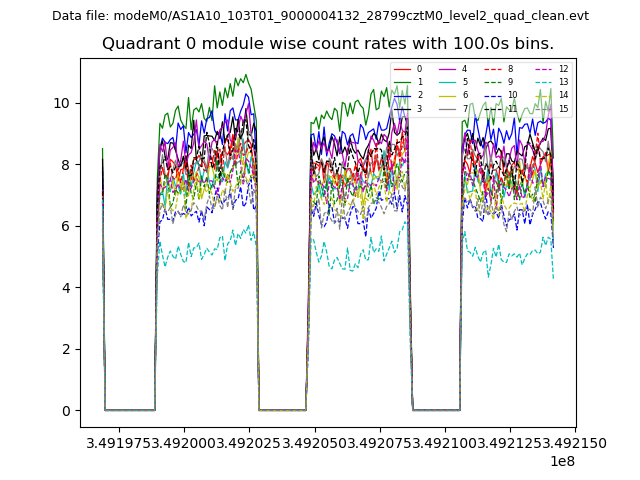 |
 |
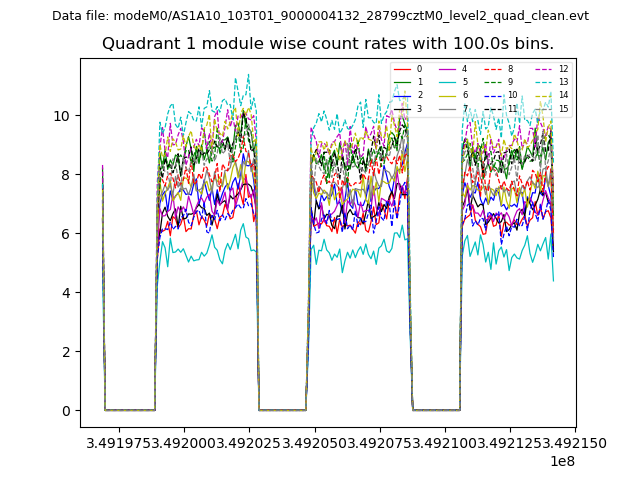
| Module-wise count rates for Quadrant B Data is divided into 100 sec bins |
 |
 |
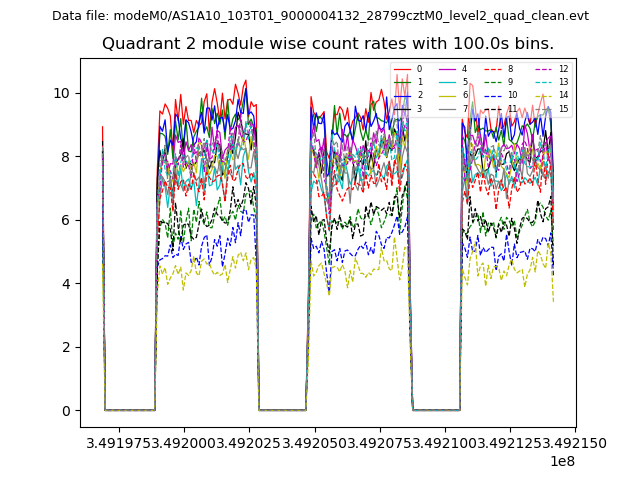
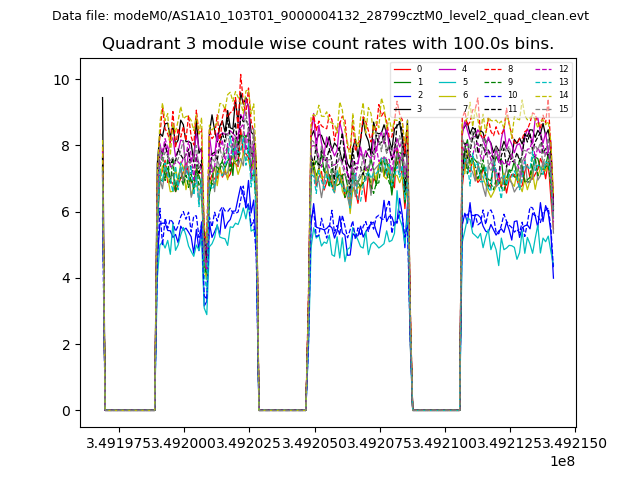
| Module-wise count rates for Quadrant C Data is divided into 100 sec bins |
 |
 |
| Module-wise count rates for Quadrant D Data is divided into 100 sec bins |
 |
 |
| Parameter | Plot |
|---|---|
| CZT HV Monitor | 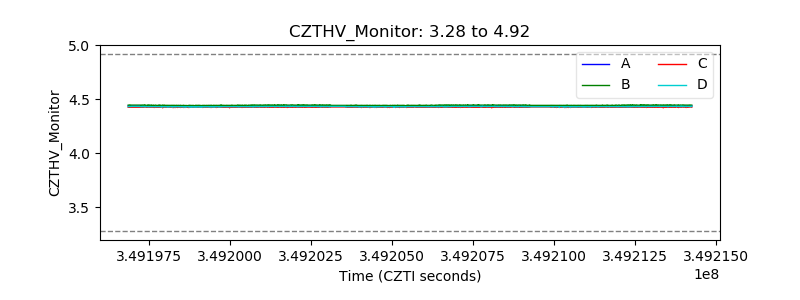 |
| D_VDD | 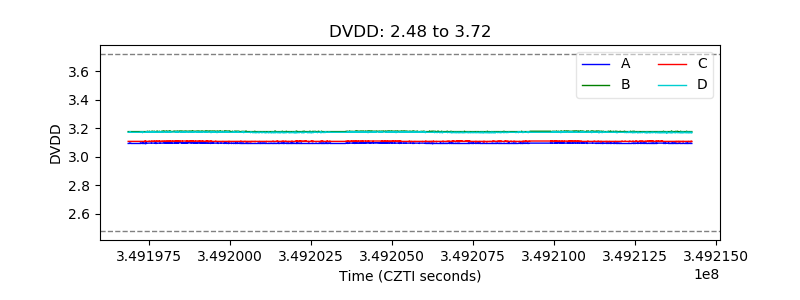 |
| Temperature 1 | 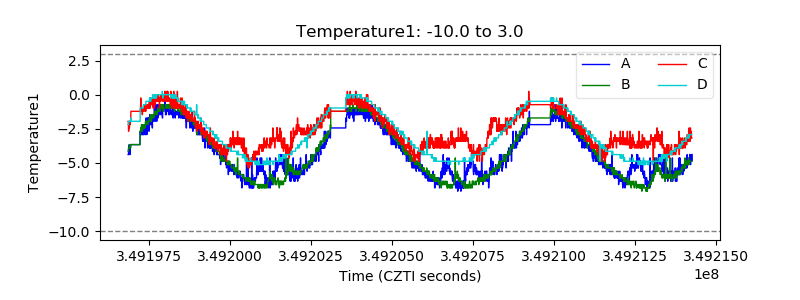 |
| Veto HV Monitor | 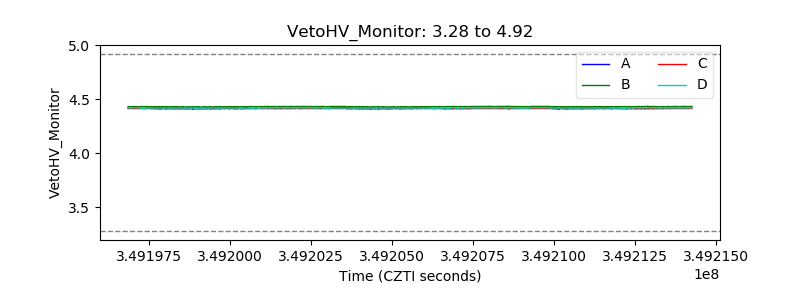 |
| Veto LLD | 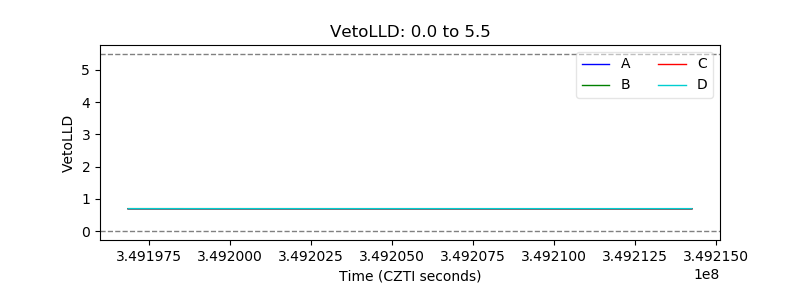 |
| Alpha Counter | 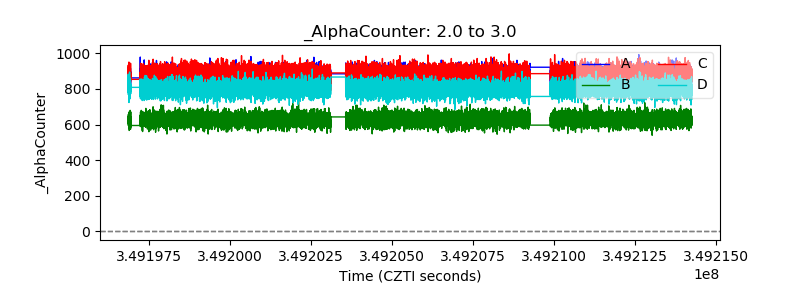 |
| _CPM_Rate | 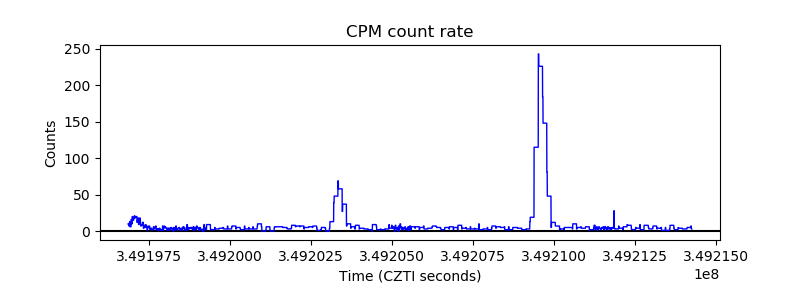 |
| CZT Counter | 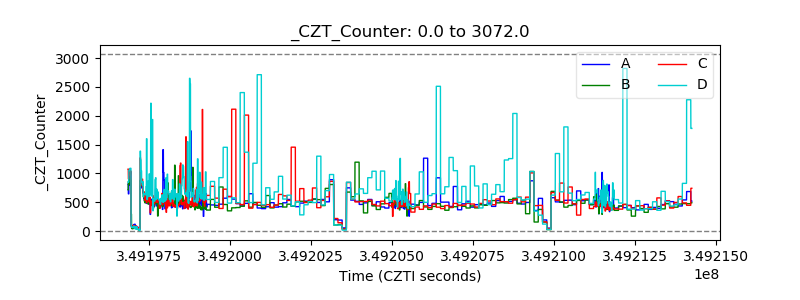 |
| +2.5 Volts monitor |  |
| +5 Volts monitor |  |
| _ROLL_ROT | 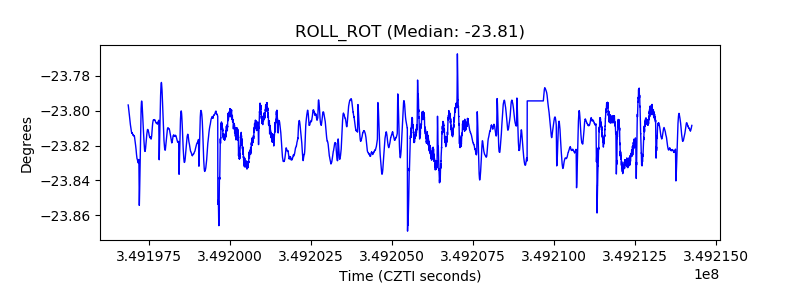 |
| _Roll_DEC | 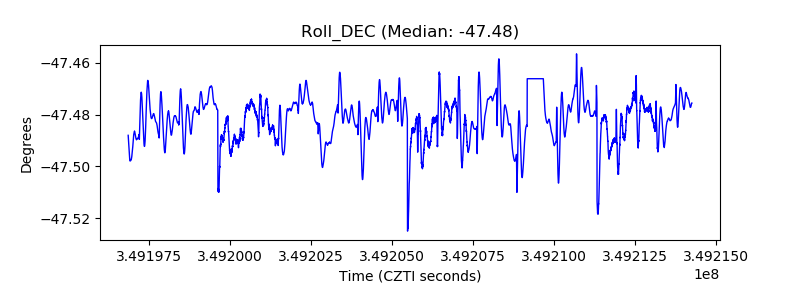 |
| _Roll_RA | 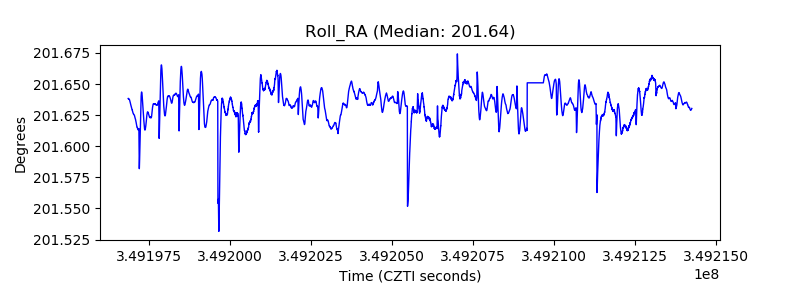 |
| Veto Counter | 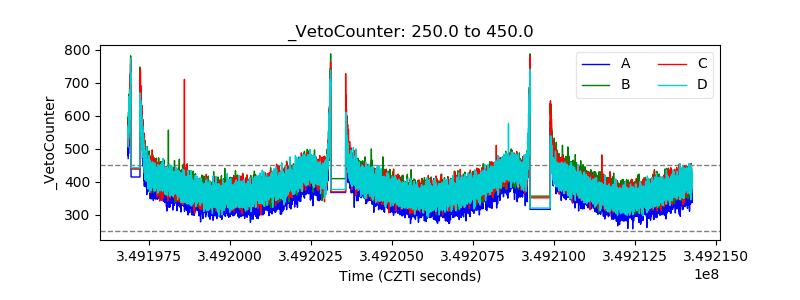 |